
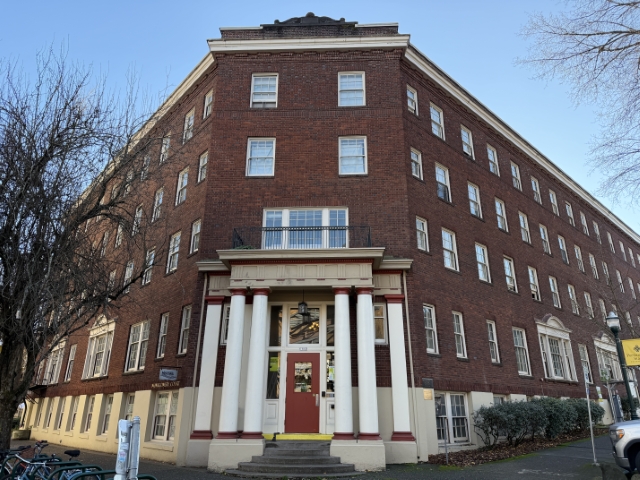
Photo: Portland Appraisal Blog (CC BY-SA 4.0)
Portland State University continues to advance plans to demolish two early-20th-century buildings—Montgomery Court and Blackstone Hall—to make way for a new 550-bed student housing complex on the South Park Blocks. Both structures, acquired by the university in 1969, are included on Portland’s Historic Resources Inventory but lack stronger local landmark or National Register designation, offering limited protection against demolition. Deconstruction remains scheduled for fall 2026, despite ongoing advocacy from preservation groups emphasizing the buildings’ architectural and cultural significance, lower carbon impact of rehabilitation, and potential eligibility for tax incentives.

Photo: Portland Appraisal Blog (CC BY-SA 4.0)

Photo: Portland Appraisal Blog

Photo: Portland Appraisal Blog
These institutional debates mirror tensions in the residential market, where buyers, sellers, realtors, and lenders frequently navigate historic designations and their implications for property alterations, maintenance, and value.
Understanding Historic Designations in Portland
Portland maintains multiple layers of historic recognition, each with varying implications for private owners:
- National Register of Historic Places — A federal honorary listing that qualifies properties for rehabilitation tax credits (20% federal for income-producing; Oregon offers a 10-year special assessment freeze) but imposes no automatic local restrictions on alterations or demolition for private residential use.
- Local Historic Landmarks or Conservation Districts — The strictest level; exterior changes, additions, or demolitions require Historic Resource Review, which can result in denial.
- Historic Resources Inventory only — Documentation of significance with minimal protections (possible 120-day demolition delay for higher-ranked properties), similar to the PSU buildings.
A common misconception among buyers (and even a few agents) is that any pre-1930 home—or even one from the 1850s—is automatically “historic.” It is not. Only properties formally listed on official registries carry designation. Due diligence early in a transaction—via Portland Maps Historic Resource layer or title report—helps clarify responsibilities.
Rare Sales of Verified Registered Historic Homes in Portland
From 2023 through Q3 2025, only 15 single-family residential properties with confirmed historic designation changed hands in Portland—roughly one every two to three months—after excluding listings that described homes as merely old.
These historic-designated homes command elevated prices—averaging over $1.25 million across the period—reflecting strong demand for authentic early-20th-century architecture in Portland’s most marketable neighborhoods. However, they are not necessarily the most expensive properties in those areas. Many newly constructed or extensively remodeled custom homes (without historic restrictions) routinely sell for significantly more. For buyers specifically seeking a registered historic property, though, the investment is substantial.
| Year Sold | # of Sales | Avg Close Price | Avg Yr Blt | Avg Total SF |
|---|---|---|---|---|
| 2023 | 5 | $990,044 | 1913 | 3,405 |
| 2024 | 4 | $1,226,424 | 1903 | 4,701 |
| 2025 | 6 | $1,498,817 | 1923 | 5,281 |
| Total | 15 | $1,256,588 | 1914 | 4,501 |
Sales cluster in Portland’s premier historic neighborhoods: Irvington, Mt. Tabor, Hosford-Abernethy, and Southwest Hills.

Surprisingly, sales price shows almost no correlation with exact year built—value is driven by historic status and prime neighborhood location.
Owning a designated historic home represents a significant financial commitment, with higher acquisition costs, ongoing maintenance, and regulatory review for major changes. Potential incentives, such as tax credits and special assessments, can offset some burdens for qualifying owners.
Historic properties—whether the institutional buildings at PSU or the late‑19th and early‑20th‑century homes across Portland—connect the present generation to the rich and vibrant history of previous generations and the loss of any of these structures feels like losing a bit of the past. The tension between retention or eventually letting such properties go will probably never go away.
Sources & Further Reading
- Preservation debate and building history: OPB Coverage
- National Register overview and incentives: National Park Service
- Portland local landmark and district rules: City of Portland Program Overview
- Historic Resources Inventory details: City of Portland Inventory
- Making changes to designated properties: City of Portland Guidelines
- Historic and conservation districts: City of Portland Districts
- Trying to Save Architectural History at PSU: Architectural Heritage Center | Portland, OR
- The Portland Region Q3 2025 Market Update: Portland Appraisal Blog

Thanks for reading—I hope you found a useful insight or an unexpected nugget along the way. If you enjoyed the post, please consider subscribing for future updates.
CODA
Are you an agent in Portland and wonder why appraisers always do “x”?
A homeowner with questions about appraiser methodology?
If so, feel free to reach out—I enjoy connecting with market participants across Portland and the surrounding counties, and am always happy to help where I can.
And if you’re in need of appraisal services in Portland or anywhere in the Portland Region, we’d be glad to assist.


.jpg)