

The first quarter of 2025 is already drawing to a close, but let’s take the time to review how the Portland Region’s condominium market performed in 2024. High mortgage interest rates have been a concern in all segments of the housing market and condominiums were no exception. To be direct, 2024 was not a great year for condos.
Let’s take a look at how the Portland Region’s condo market performed as a whole and by individual county. We already examined the 2024 single-family detached home market and will have future posts dealing with attached homes and manufactured homes.
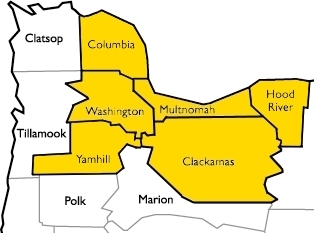
Let’s define the Portland Region as the following six counties: Columbia, Clackamas, Hood River, Multnomah, Washington, and Yamhill—essentially all counties contiguous with Portland’s home county of Multnomah, plus Yamhill.
DATA HOUSEKEEPING
The information in this post will be based on properties that sold on the open market, defined as listed in RMLS, the primary multiple listing service for the Portland Region. The data was parsed with tools created by the blog author to weed out/correct, among other things, listing errors and misclassifications (e.g. condominium sales hiding in other categories, such as in the attached or single-family category). It is important to understand that condominium is a classification of ownership and that condos come in many distinct varieties: detached, attached, townhome style, common wall, or even large converted apartment complexes. Condos are the ultimate chameleons, and can be mistaken for any other type of housing segment. With condominiums the property owner does not own the land or even the structure itself, but only the air space within the walls of the unit. The property owner also has an interest in the common elements on the site. Condos almost always entail monthly dues to the governing HOA. Condominiums often have distinct mortgage underwriting guidelines and it is important for real estate agents and appraisers to classify them properly.
Finally, RMLS has a listing category, SNL (Sold Not Listed), that allows agents to put properties that were sold off market into the database. Those properties have been excluded from the following analyses.
Portland Region 2024 Condo Overview

2024 was worse than 2023 in most important metrics. The following table compares 2024 with 2023:

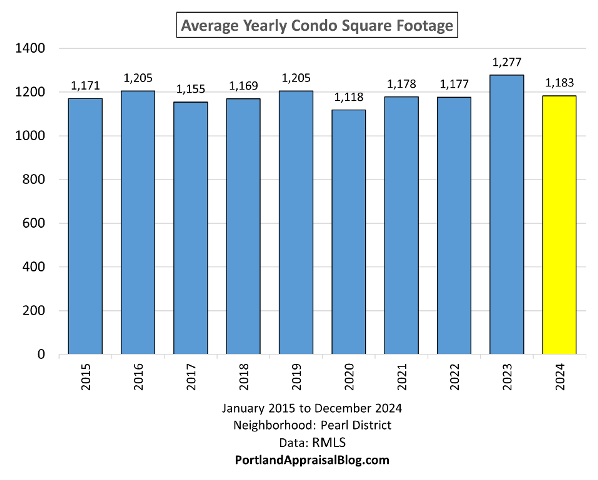
Total sales volume was just north of $900 million, dropping over 8% from the previous year. Some of that decrease was due to a slight dip in the average size of the units selling in 2024 compared to the previous year, but average price per square foot was down as well. Typically as a unit gets smaller its price per square foot increases, so a drop in both total square footage and price per square foot definitely indicates a weaker market.
While prices have declined, the average monthly HOA dues increased nearly 3% in the region.
Bank owned and short sales both decreased in 2024 as compared to the previous year; the numbers are trivial and represent less than 1% of the entire market.
The only real bright spot in 2024 was more new construction condominium units came online that year. The annual increase was a healthy 35.7%.
Let’s dive into the rest of the data with some visuals.
SALES VOLUME
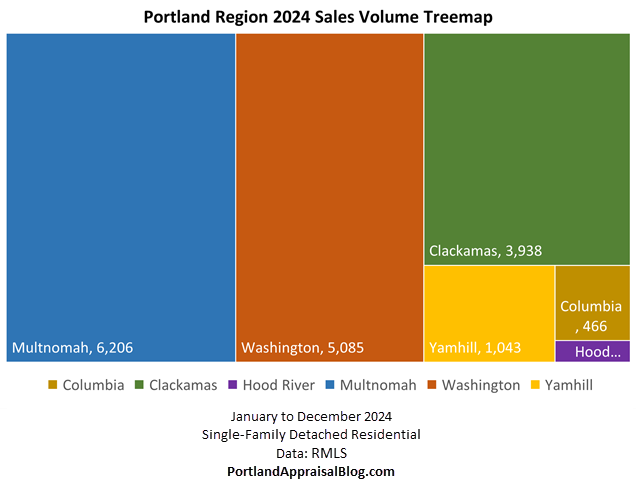
The following is a treemap of condo sales volume in the Portland Region for the year 2024:

Unsurprisingly, Multnomah County had the most sales (~64% of the entire market), with 93% of all Multnomah sales being in the City of Portland. Clackamas, Multnomah, and Washington counties comprised virtually all of the sales volume, with Columbia, Hood River, and Yamhill barely getting over 1%.
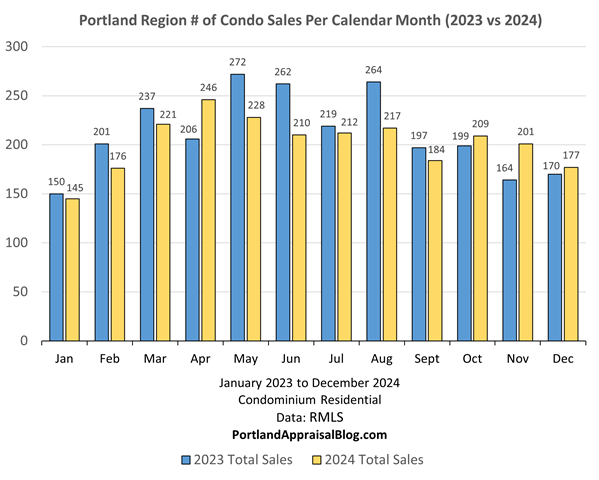
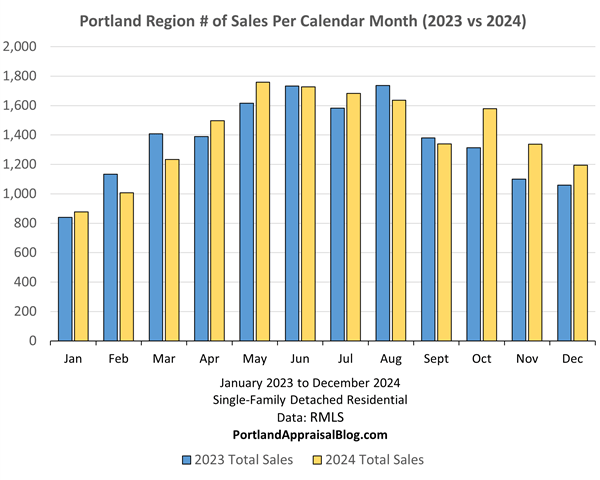
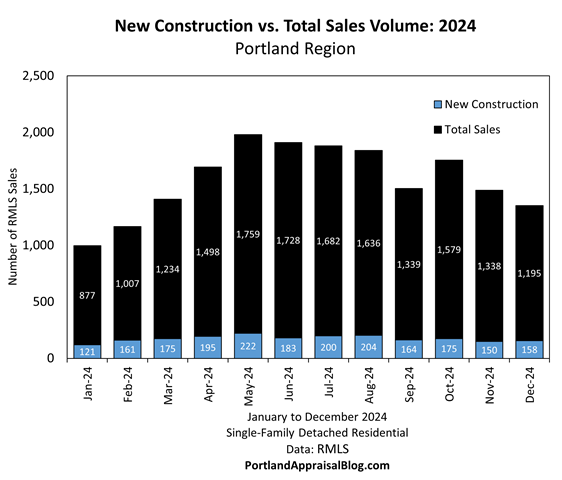
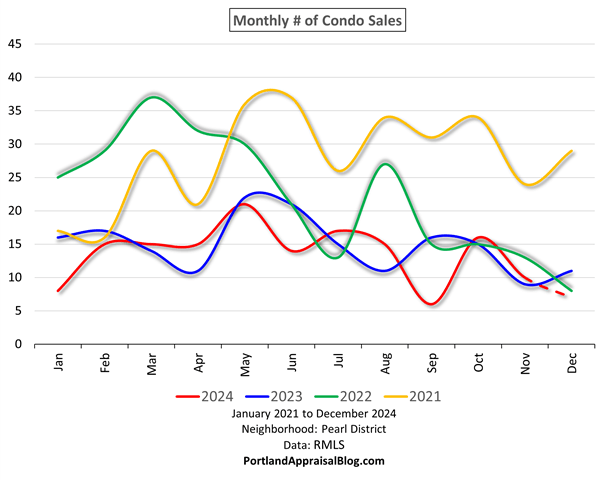
Sales peaked in April of 2024 and then began to gradually decline:

As the following graph shows, 2023 beat 2024 eight out twelve months:
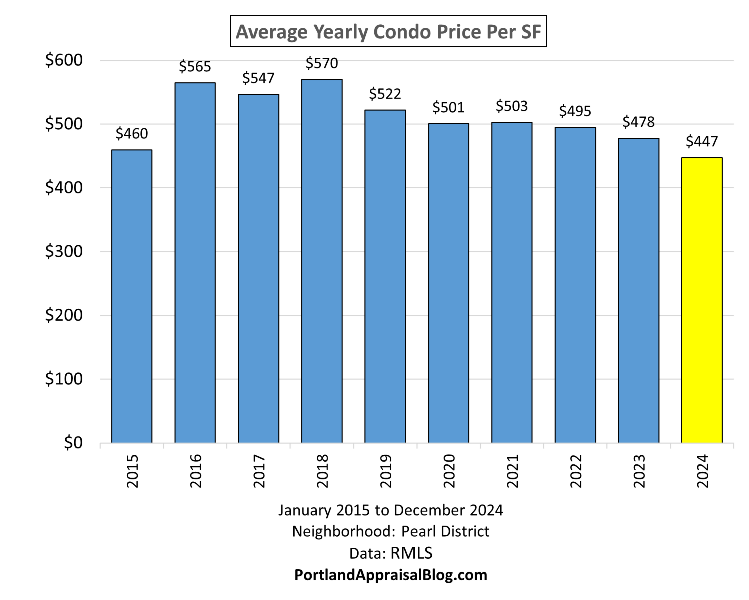
SALES PRICE
Prices were u-shaped during the months of February to July, with the year’s peak being in June. Late summer to fall/winter saw prices mostly declining.

2023 was ahead of 2024 every single month, with a couple of near ties in the months of May and November:

NEW CONSTRUCTION
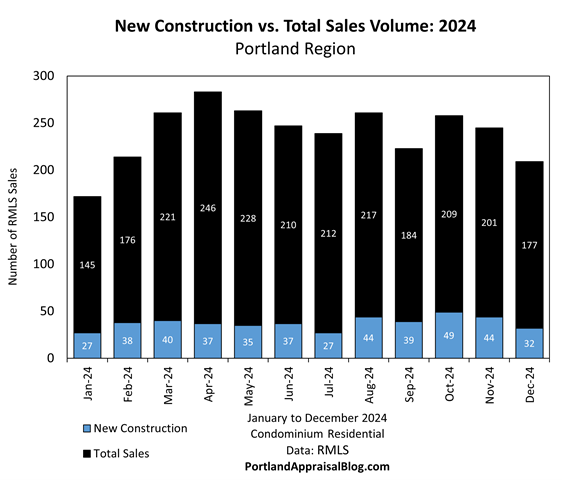
New construction was fairly level in 2024, averaging between 13-23% of monthly sales:
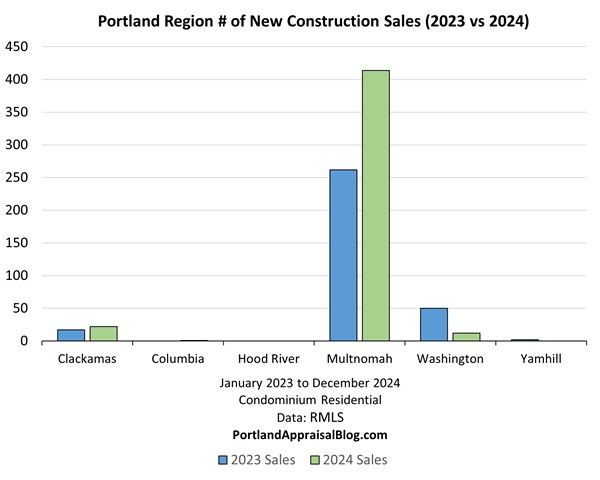
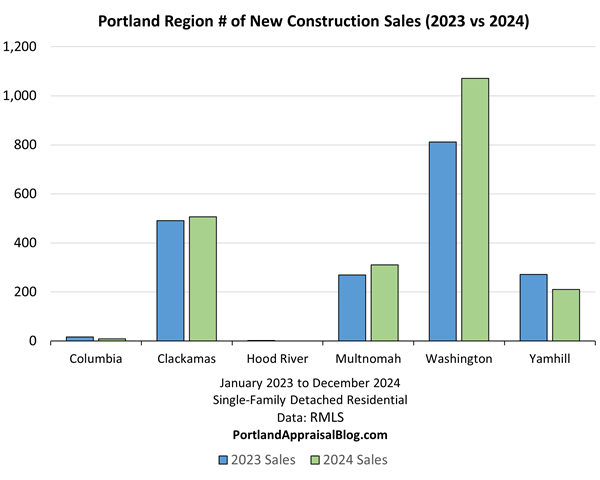
Multnomah County had the biggest share of new condominiums as well as the biggest year-over-year increase:
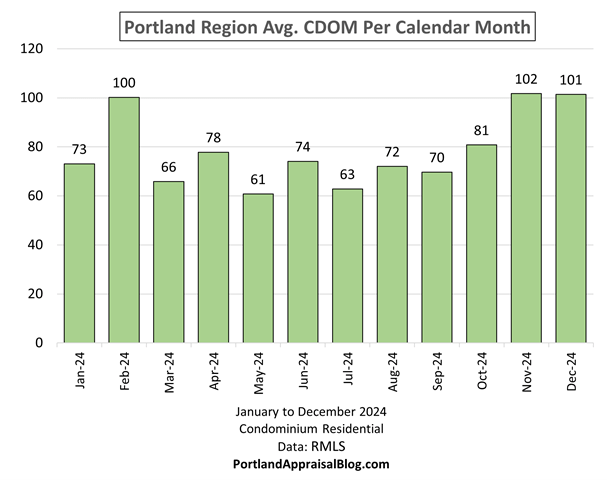
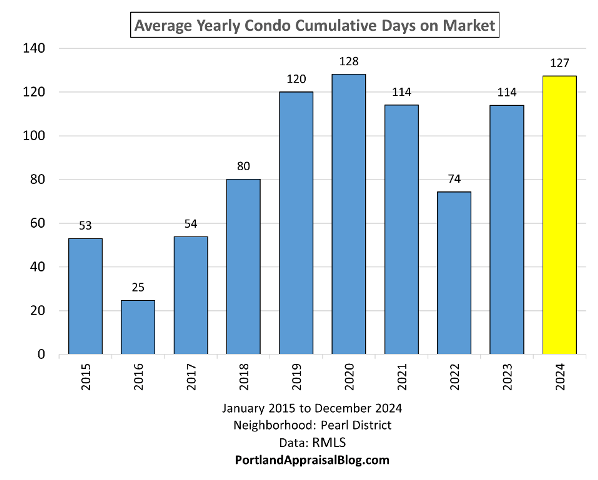
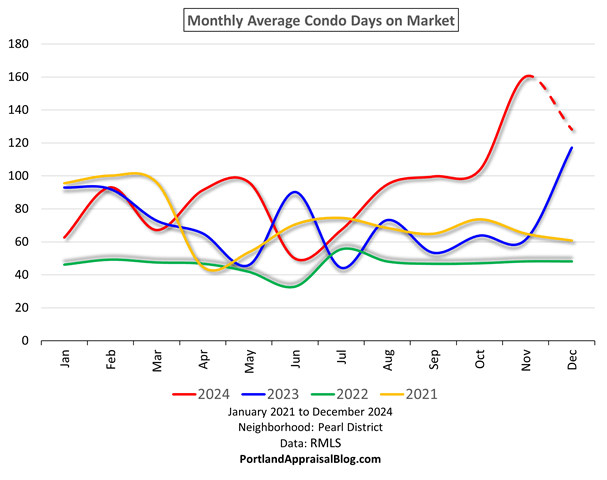
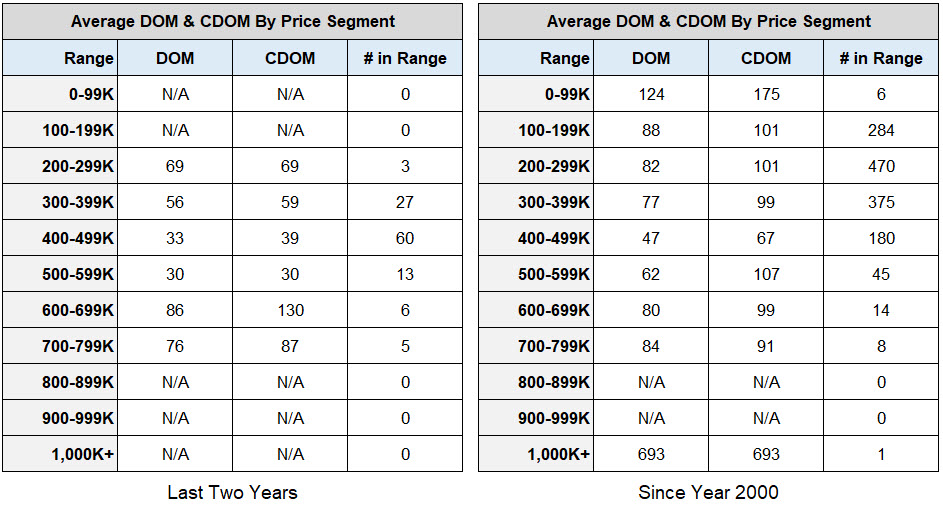
CUMULATIVE DAYS ON MARKET
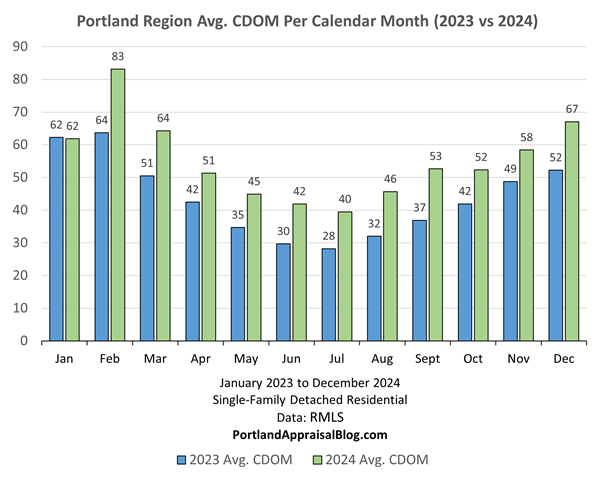
The average cumulative days on market edged towards three months for the entire year of 2024. Marketing time varied seasonally, with the slowest months being November and December:
Average marketing time was up sharply in 2024 compared to 2023:

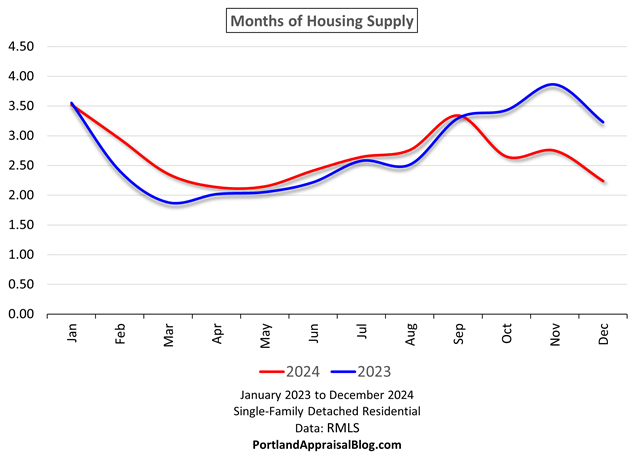
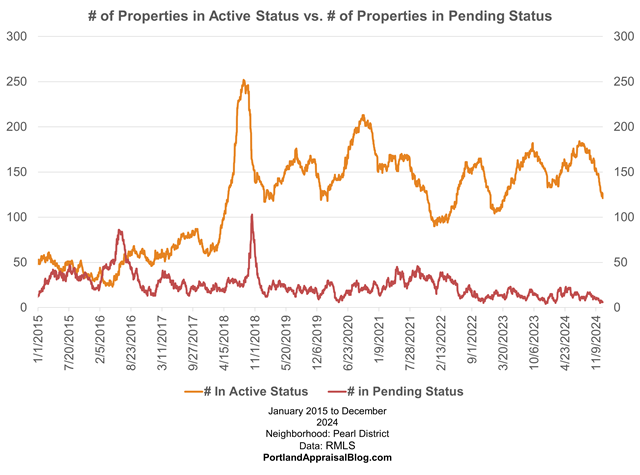
HOUSING SUPPLY
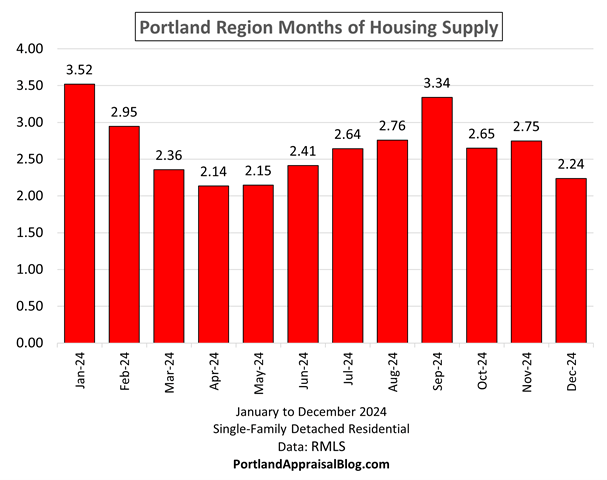
Housing supply tracks how long would it take the market to exhaust all available inventory at the current rate of absorption. For most of 2024 the months of housing supply was above 5 months, with the year averaging 5.6 months.

2024 was significantly above 2023 in months of housing supply for nearly every month, with parity only being reached in November and December. The extended marketing times combined with the higher prices may make condominiums a more attractive housing option compared to single-family detached—particularly for first-time buyers:

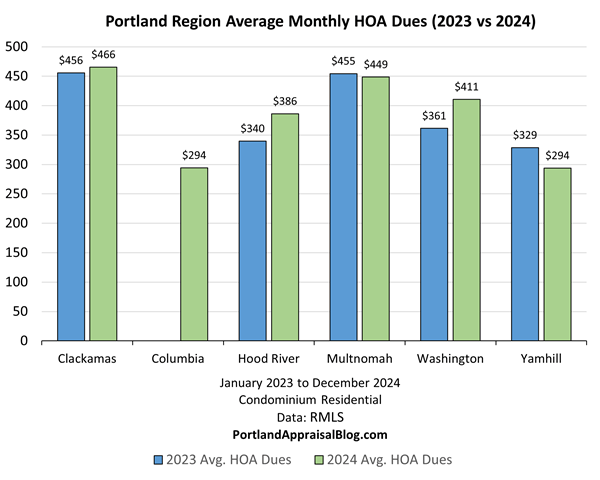
HOA DUES
HOA dues for the region increased by nearly 3%, with the average being $440. Surprisingly, monthly dues in Multnomah and Yamhill counties declined in 2024, while Clackamas, Hood River, and Washington counties all saw increases. Columbia County had no condominium sales in 2023.
MISC STATS
Before concluding our overview of the Portland Region as a whole, let’s look at some miscellaneous stats:

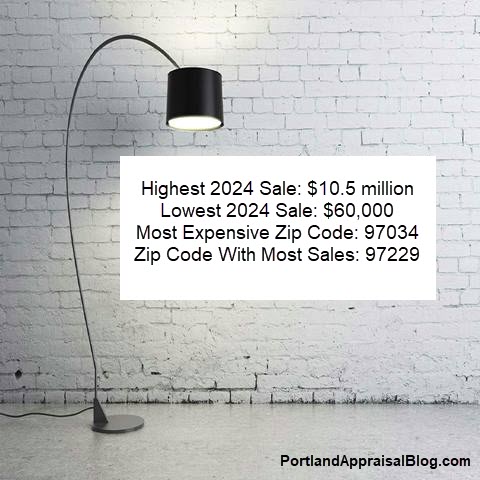
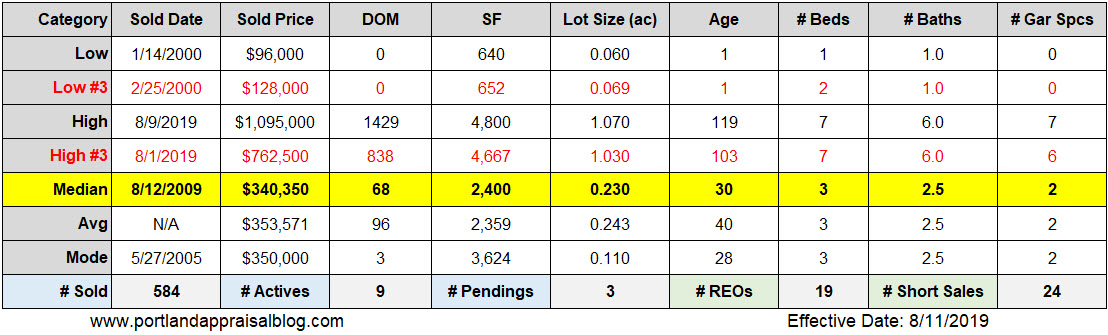
The most expensive condo that sold on the open market in 2024 in the Portland Region was a riverfront unit on the Willamette. The condo sold for $3,197,617, has three bedrooms, three and a half bathrooms, and is 4,290 sq. ft. Photos of the condo are currently available online and may be viewed here.
The least expensive condominium for 2024 was a bank repossession that was completely trashed. The condo sold for $96,000 in the Portland Powellhurst-Gilbert neighborhood. The unit has significant structural damage and closed as a cash sale.
The most expensive ZIP code for 2024 was 97028. This area is located in the Mount Hood Villages. While only 9 sales occurred in 2024, the average price was about $728,000:

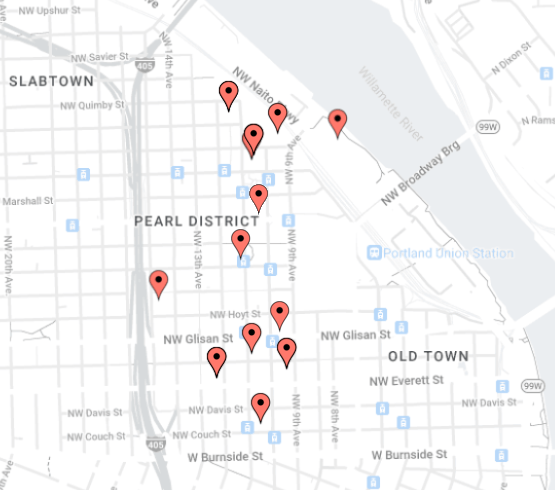
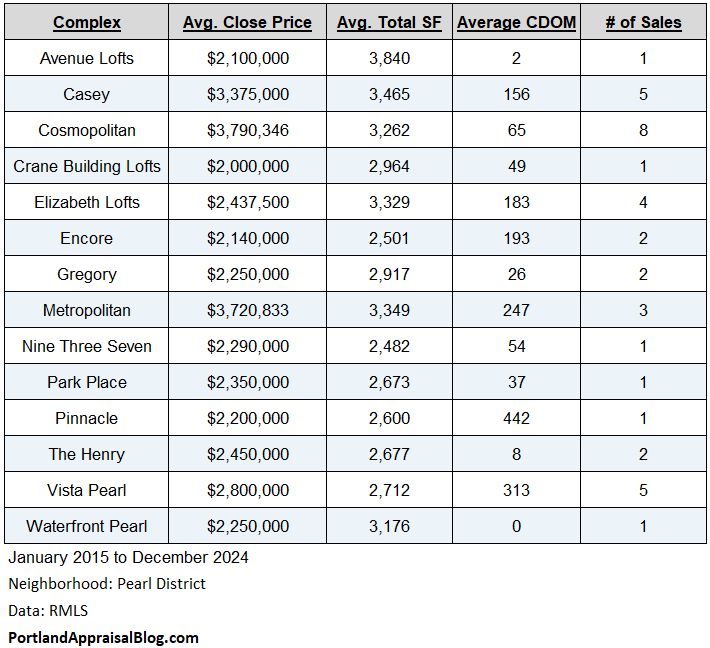
The ZIP code with the highest volume of sales was 97209:

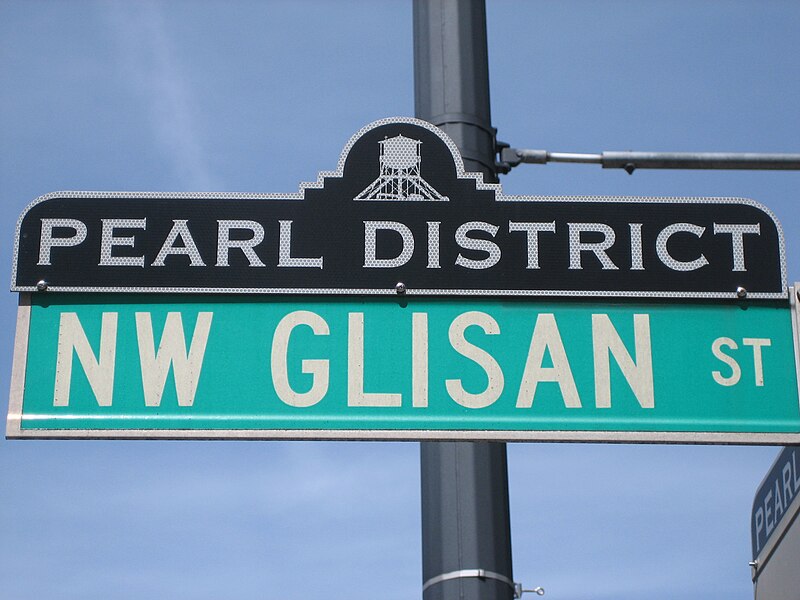
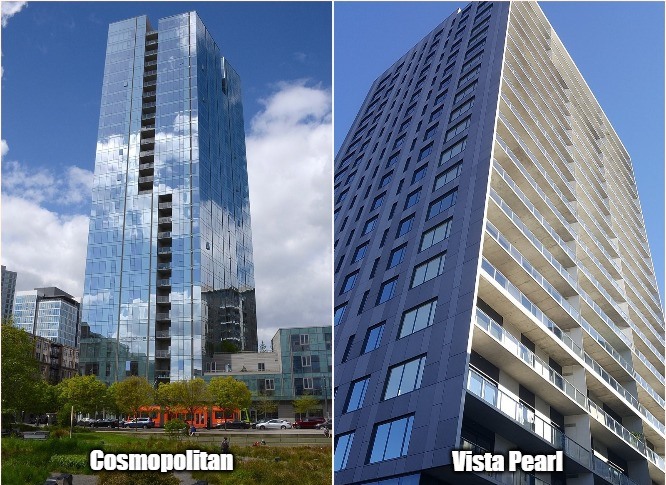
This ZIP code covers a large portion of the Portland Pearl District and is part of Portland’s urban core. A total of 239 condominium sales occurred in this ZIP code in 2024.
A condominium in the Pearl District’s Casey complex took the crown for the highest monthly HOA dues—a whopping $2,919! The penthouse unit has panoramic city views, is 3,273 sq. ft. and sold for $2.4 million. Photos of the condo are currently available online and may be viewed here.
Let’s wrap up this post with a quick look at the individual counties comprising the Portland Region. We will examine the three largest counties individually, but will group the three smallest together, as they comprise less than 2% of the overall condominium market.
Multnomah County 2024 Stats
Multnomah County contains most of the City of Portland. A sliver of the City of Portland is located in Clackamas and Washington counties. The following table summarizes important metrics for Multnomah County:

Multnomah County saw a more than 5% decline in the sales volume dollar amount. Total sales dipped 1.4%, while average prices fell by more than 4%. Marketing time spiked nearly 21%. New construction comprised almost 27% of the total market and increased 58% year over year. HOA dues modestly declined by 1.3% in 2024.
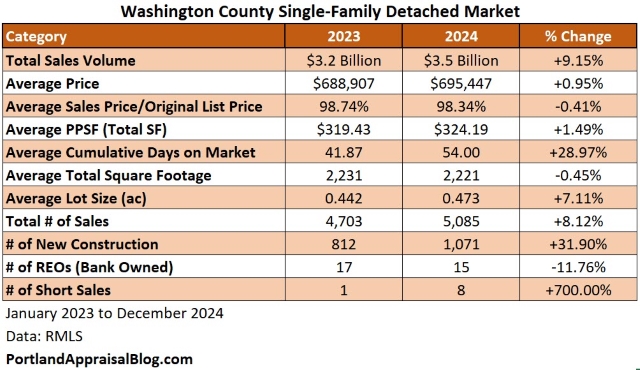
Washington County 2024 Stats
Washington County contains many properties with a Portland address that are outside official city limits and are under county control. The second biggest city in Washington County, Beaverton, saw 234 condo sales in 2024. The following table summarizes important metrics for Washington County:
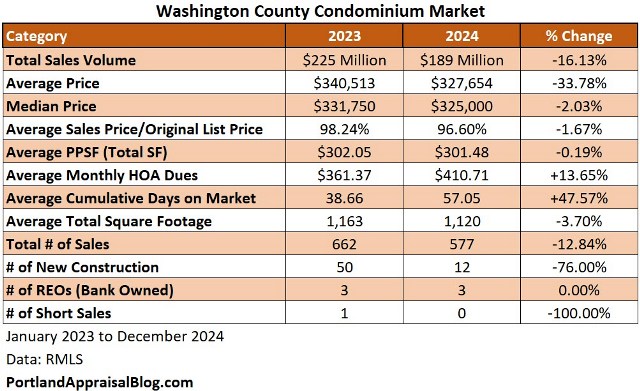
The total sales volume dollar dropped 16.1%. New construction sharply declined by 76% in 2024 compared to the previous year and was only 2% of the overall condo market. Average monthly HOA dues jumped almost $50 per month year over year, representing a nearly 14% increase. Marketing time saw a 48% jump, with condos averaging almost two months before closing.
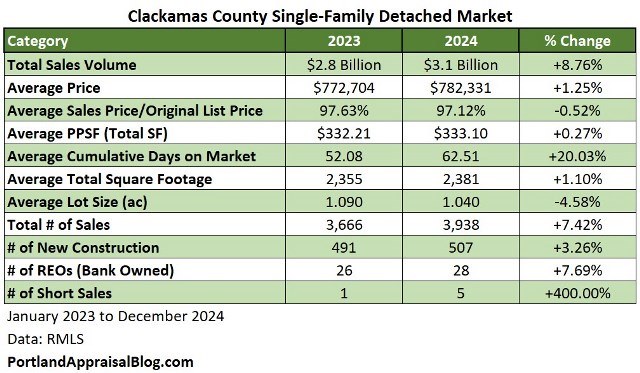
Clackamas County 2024 Stats
Clackamas County, despite having has many rural portions, has a decent amount of condo activity. The cities of Happy Valley and West Linn have the majority of the sales, with the Mount Hood area coming in third. The following table summarizes important metrics for Clackamas County:
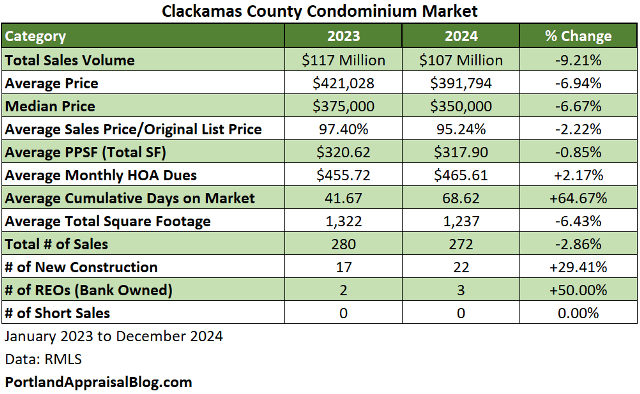
The Clackamas condo sales volume dollar amount was down 9.2% in 2024. Median and average prices were both off by almost 7% compared to 2023. Average monthly HOA dues saw a sight 2% bump (or about $10). The total number of sales was flat year over year.
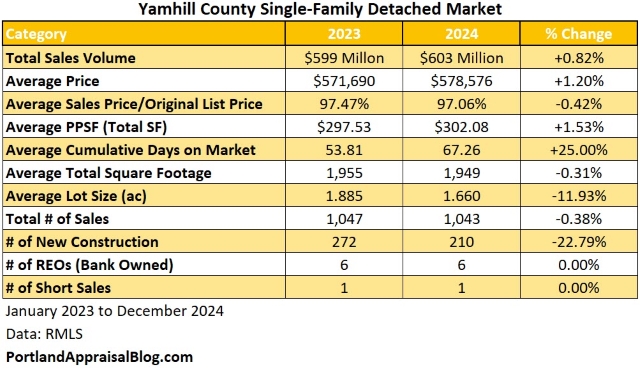
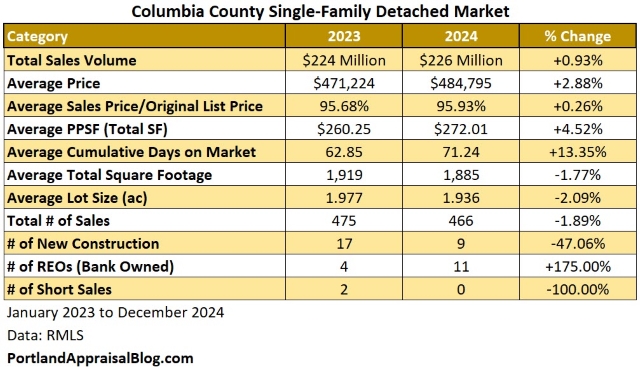
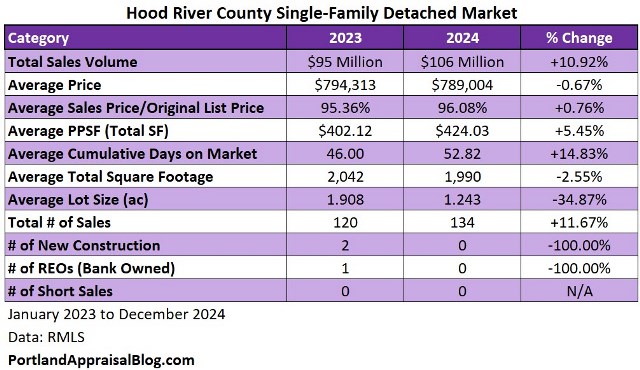
Columbia, Hood River, & Yamhill Counties 2024 Stats
Given how little of the condo market occurs in these three counties, they have been lumped together:
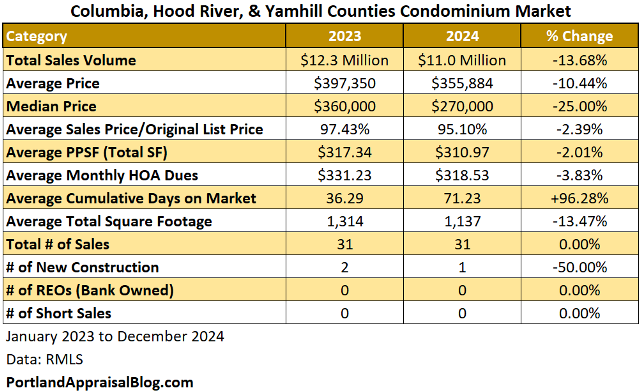
The total sales volume dollar amount dropped nearly 14%, while average and median prices were down 10% & 25% respectively. The total number of sales was flat, while average monthly HOA dues declined nearly 4%—the only bright spot in these peripheral areas.

That wraps up our look at the Portland Region 2024 condo market!
Thank you for reading the post! I hope you found some useful or interesting nugget of information. Please consider subscribing.
Question: Do you think 2025 will be see condo prices rebound for the region?
CODA
Are you an agent and wonder why appraisers always do “x”? Are you a homeowner that got a report and have a question or two about appraisal terminology or methodology? If so, please feel free to contact me. I enjoy interacting with various market participants and am always happy to help out where I can! And if you are in need of any appraisal services, feel free to reach out to us!


.jpg)