Are you an agent in Portland and wonder why appraisers always do “x”?
A homeowner with questions about appraiser methodology?
If so, feel free to reach out—I enjoy connecting with market participants across Portland and the surrounding counties, and am always happy to help where I can.
And if you’re in need of appraisal services in Portland or anywhere in the Portland Region, we’d be glad to assist.
The year 2025 is rapidly yielding to 2026. In the blink of an eye, we’ll be more than halfway through this decade and sliding toward the 2030s! With that in mind, let’s examine how the single-family detached home market performed in Q3 2025 (July through September). The data reveals a market split in two—one stable, one shifting—lending itself to a Dickensian interpretation of A Tale of Two Markets.
DATA HOUSEKEEPING
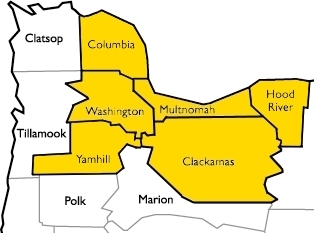
Let’s define the Portland Region as the following six counties: Columbia, Clackamas, Hood River, Multnomah, Washington, and Yamhill. These counties are either contiguous with Multnomah (Portland’s home county) or closely tied to its housing ecosystem.
All data in this post reflects open-market sales—properties listed in RMLS, the primary multiple listing service for the Portland Region. The dataset was cleaned using custom tools developed by the blog author to correct misclassifications and remove non-representative entries (e.g., land or condo sales mistakenly listed as single-family).
Importantly, SNL (“Sold Not Listed”) entries—off-market transactions later entered into RMLS—have been excluded to maintain consistency and transparency.
Before diving into the Q3 2025 market data, here’s a quick overview of the major sections covered in this post. Each county-level breakdown is linked below for easy navigation, along with the regional summary that sets the stage:
The Portland Region’s single-family detached market in Q3 2025 showed signs of quiet resilience. While headlines focused on interest rates and builder pullbacks, the overall market held steady across most metrics:
📊 Key Highlights
Total Sales Volume: Up slightly from $3.21B to $3.24B (+1.08%)—a modest gain that reflects stable demand despite macro headwinds.
Average Price: Rose 0.54% to $692,778, while median price held flat at $600,000—suggesting price discipline and a balanced mix of sales.
SP/OLP Ratio: Dropped from 97.77% to 96.94%—buyers negotiated slightly more, but sellers still held firm.
DOM (Days on Market): Increased 13.25% to nearly 52 days—buyers are taking longer to commit, especially in higher price tiers.
Average PPSF: Virtually unchanged at $322—indicating stable valuation per square foot across the region.
Lot Size & Age: Average lot size grew slightly (+1.61%), while average age of homes increased by 3.43%—a subtle shift toward older inventory.
New Construction: Fell 25%—a sharp decline that reflects builder caution and financing constraints.
Distressed Sales: REOs ticked up slightly (+3.45%), while short sales declined—still a negligible share of the market.
🧭 Appraisal Insight
Despite longer exposure times and a notable drop in new construction, the Portland Region’s single-family market in Q3 2025 continues to behave like a stabilized asset class. Pricing remains anchored to fundamentals—location, size, and condition—rather than speculation or distress.
The flat median price and steady price-per-square-foot suggest that buyers and sellers are still operating within a shared valuation framework. In other words, the market hasn’t lost its pricing logic.
While exposure time isn’t generally a selection criterion for appraisers, it’s a signal—one that reflects buyer confidence, seller patience, and the pace of negotiation. In a market like this, it’s not volatility that drives value shifts—it’s nuance.
🏘️ A Tale of Two Markets: Core vs. Luxury in Q3 2025
Beneath the surface of Portland’s stabilized housing market lies a quiet divergence, one that’s been building over the past year. The aggregate metrics may suggest balance, but when you split the market by price tier, a more nuanced story emerges.
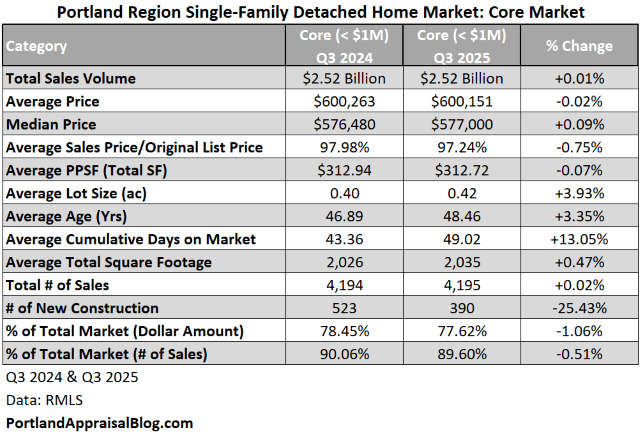
🏠 Core Market (< $1M)
The core market, which accounts for nearly 90% of all sales, remained remarkably steady in Q3 2025. Median price nudged up slightly, and average price dipped by a fraction, suggesting a high volume of mid-range transactions with tight pricing discipline. Buyers in this segment are cautious but active, and sellers are adjusting expectations without capitulating.
SP/OLP Ratio: Down just 0.75%—still strong at 97.24%
DOM: Up from ~43 to ~49 days—slower pace, but not sluggish
New Construction: Down 25%—a notable retreat, especially in Washington and Clackamas counties
The core market is behaving like a durable middle class—resilient, price-aware, and responsive to financing conditions.
🏠 Luxury Market (≥ $1M)
Before diving into the luxury segment, a quick note on definitions: For this analysis, we’re defining “luxury” as any sale at or above $1 million. It’s a useful threshold for tracking market behavior, but it’s not a perfect proxy for architectural prestige or lifestyle appeal.
Some acreage properties cross the $1 million mark based on land value alone, even if the homes themselves wouldn’t be considered luxurious in terms of design or finish. And it’s true, $1 million doesn’t hold the same purchasing power it once did. Today, it might afford a modest home in a sought-after area or a larger property with dated features in a more remote location.
This segmentation allows us to observe buyer psychology, pricing trends, and listing exposure time across different tiers. It’s a tool for analysis, not a judgment of quality or taste.
The luxury segment tells a different story. While total sales volume rose a little more than 5%, average price dipped slightly and exposure time jumped from ~69 to ~77 days. Buyers at the top end are more deliberate, and sellers are conceding more ground.
SP/OLP Ratio: Dropped 1.56% to 94.37%—a wider negotiation gap
PPSF: Down nearly 0.9%—suggesting softer valuation per square foot
New Construction: Fell 20%—from 45 to 36 units. Builders are pulling back, and luxury inventory is increasingly composed of legacy stock.
Lot Size & Age: Slightly smaller lots and older homes—less new inventory, more carryover from prior cycles
The luxury market remains active but is undergoing a period of careful assessment. Buyers are selective, and sellers are adjusting their strategies. This segment is characterized by patience, not panic.
Let’s dive into the Portland Region with some visuals before we examine each county individually.
SALES VOLUME
The following is a treemap of sales volume in the Portland Region for Q3 2025. Each block represents a county, scaled by its share of total transactions—not dollar volume:
In Q3 2025, the Portland Region’s housing activity was overwhelmingly concentrated in three counties: Multnomah, Washington, and Clackamas. Together, they accounted for over 91% of all single-family home sales, forming the backbone of the regional market.
Multnomah: Led in transaction count, driven by dense housing stock and steady turnover
Washington: Showed strong suburban demand and a mix of core and upper-tier activity
Clackamas: Balanced volume with price diversity, including notable luxury sales
The remaining counties—Yamhill, Columbia, and Hood River—played supporting roles, with smaller volumes and more rural dynamics.
This bar chart compares monthly single-family sales across Q3 2024 and Q3 2025. While July and August saw slight year-over-year declines, September posted a modest rebound, rising from 1,339 to 1,450 sales.:
Note: The y-axis starts at 1,000 to allow better examination of monthly differences.
SALES PRICE
This bar chart compares monthly average sales prices for single-family homes in the Portland Region across Q3 2024 and Q3 2025. The story it tells is one of stability with subtle movement:
Note: The y-axis starts at $660,000 to allow better examination of monthly differences.
July: $688K → $690K
August: $688K → $699K
September: $691K → $689K
While monthly average prices nudged up and down across the quarter, the net result is a tiny bump of just 0.54% year-over-year. That’s not volatility—it’s equilibrium.
NEW CONSTRUCTION
This chart shows how new construction sales fit into the broader single-family market across Q3 2025. While total monthly sales hovered between 1,450 and 1,635 units, new construction consistently made up a small fraction of that activity:
July: 145 new builds out of 1,635 total sales (~8.9%)
August: 159 out of 1,597 (~10%)
September: 122 out of 1,450 (~8.4%)
New construction represented roughly 9% of all single-family sales in Q3 2025. That’s a modest but meaningful slice—enough to influence comps and buyer expectations, but not dominant. Most buyers were engaging with resale inventory, and most appraisals will reflect that reality.
This chart compares new construction sales across the individual counties in Q3 2024 vs. Q3 2025. The trend is clear: new builds are down almost everywhere:
Washington County: Down from 280 to 245 sales—still the leader, but pulling back
Clackamas County: Dropped from 127 to 114—modest decline, but still active
Multnomah County: Fell sharply from 91 to 47—nearly a 50% reduction
Yamhill County: Down from 67 to just 18—builder activity nearly stalled
Columbia County: Slipped from 3 to 2 sales—still minimal, but not absent
Hood River County: Zero new construction sales in Q3 2025 (same as last year)
Builder retreat is widespread, but not absolute. Even Columbia managed a couple of closings. The broader trend, however, is clear: new construction is shrinking, and resale inventory is doing the heavy lifting.
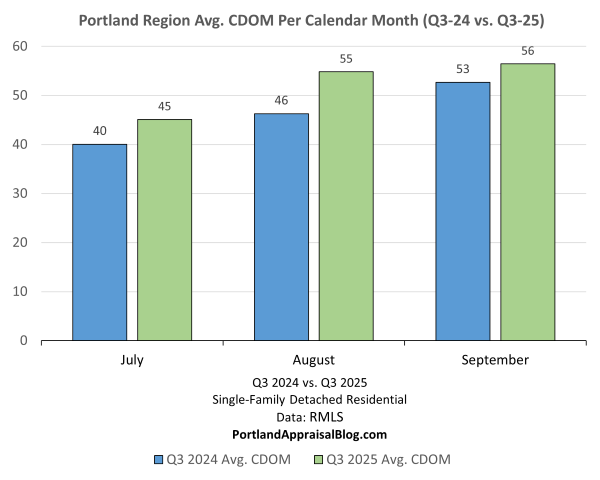
CUMULATIVE DAYS ON MARKET
This chart tracks average Cumulative Days on Market (CDOM) for single-family homes in the Portland Region across July, August, and September—comparing Q3 2024 to Q3 2025. The trend is subtle but consistent, homes are taking slightly longer to sell:
July: 40 → 45 days
August: 46 → 55 days
September: 53 → 56 days
The sales cycle is stretching, but not stalling. A 5–6 day increase per month suggests buyers are more deliberate, and sellers are adjusting expectations. This isn’t a freeze—it’s a pause. For appraisers, longer CDOM doesn’t disqualify comps, but it does signal a shift in market tempo worth noting in commentary.
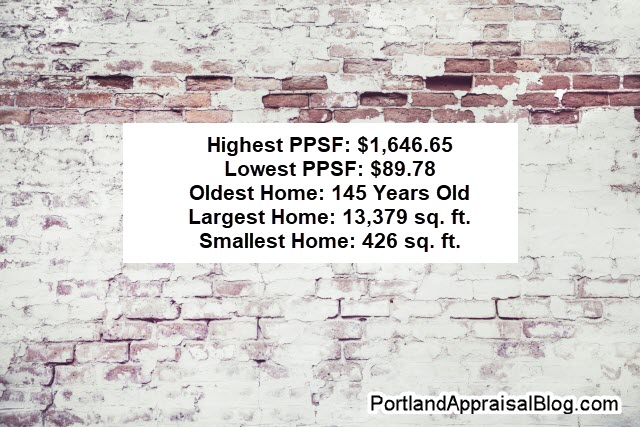
MISC STATS
Before concluding our overview of the Portland Region as a whole, let’s look at some miscellaneous stats:
The crown for highest price per square foot in the Portland Region during Q3 2025—at $1,646.65/SF—belongs to a lakefront property on Oswego Lake. The home sold for $8,500,000, spans 5,162 sq. ft., and includes four bedrooms, six full bathrooms, and one half bath on a 0.26-acre lot. Photos of the property are currently available online and may be viewed here.
The lowest price per square foot was a fixer in Willamina, Oregon (Yamhill County). This 119-year-old home measures 2,005 sq. ft. on a 0.12-acre lot. Photos of the property are currently available online and may be viewed here.
The oldest home to sell in Q3 2025 was a 145-year-old residence in Portland’s Homestead neighborhood. It features three bedrooms, one-and-a-half bathrooms, and is 1,608 sq. ft. Photos of the property are currently available online and may be viewed here.
The largest home sold during Q3 2025 was a sprawling 13,379 sq. ft. estate in West Linn, Oregon, set on 20.18 acres beside the Oregon Golf Club. The home itself was massive—but even more impressive, it came with a shop building that was larger than the house. The property sold for $6,500,000 after 299 days on market. An exterior photo of the property may be viewed here.
The smallest home to sell was a 426 sq. ft. cabin in Scappoose, Oregon, nestled on 1.4 acres. Photos of the cozy property are currently available online and may be viewed here.
Let’s wrap up this post with a quick look at the six individual counties that make up the Portland Region. We’ll examine them in order of largest to smallest number of sales.
Multnomah County Q3 2025 Stats
Multnomah County contains most of the City of Portland. (Very tiny portions of the City of Portland are located in Clackamas and Washington counties.) The following table summarizes important metrics for Multnomah County:
Multnomah County posted 1,768 single-family sales in Q3 2025, up slightly from 1,719 the year prior. Total sales volume rose to $1.13 billion, a 3.9% increase year-over-year. The average sales price nudged up to $637K, while the median price settled at $555K. Key trends:
CDOM increased from 40 to 45 days, signaling a slightly slower sales rhythm.
Average lot sizes shrank, down 7.2%, reflecting tighter urban parcels.
New construction dropped sharply, from 91 to just 47 sales—a 48% decline.
The core market (< $1M) remained dominant, accounting for 91% of sales and 81% of dollar volume. Prices were flat, with the average holding at $564K, and CDOM rising from 37 to 42 days.
The luxury market (≥ $1M) grew in volume, with 159 sales (up 14%) and $218 million in total sales (up 13%). Despite the growth, the average price dipped slightly to $1.37 million, down about $100,000 from the prior year. CDOM edged up to 79 days, roughly two days longer than in Q3 2024.
Luxury homes also came with significantly larger lots. In Q3 2025, the average lot size for luxury properties was about 0.75 acres, compared to 0.23 acres for homes in the core market segment.
Washington County Q3 2025 Stats
Washington County contains many properties with a Portland address that are outside official city limits and are under county control. The following table summarizes important metrics for Washington County:
Washington County recorded 1,349 single-family sales in Q3 2025, down slightly from 1,395 the year prior. Total sales volume fell 6.3% to $924 million, and the average price declined to $685K, down about $22K from Q3 2024.
CDOM jumped from 43 to 54 days—a notable slowdown in buyer urgency.
Average lot size shrank by over 34%, reflecting denser development patterns.
New construction dipped from 280 to 245 sales, but still represents a major share of activity.
Despite the dip in volume, Washington County remains a hub for new builds. The following map highlights active clusters:
In the core market (< $1M), Q3 2025 saw 1,254 sales, down slightly from 1,270 in Q3 2024. Total sales volume fell to $797 million, down from $819 million the year prior. The average price slipped to $636K, about $9K lower than Q3 2024. CDOM rose from 43 to 54 days, and average lot size tightened from 0.26 to 0.23 acres.
The luxury market (≥ $1M) contracted more sharply. Q3 2025 recorded 95 sales, down from 125 in Q3 2024, with total volume falling to $127 million, compared to $167 million last year—a 24% drop. The average price held steady at $1.33M, but CDOM rose significantly, from 47 to 61 days. Lot sizes also dropped, from 3.5 acres to 2.1 acres, suggesting fewer estate-style properties and more high-end infill.
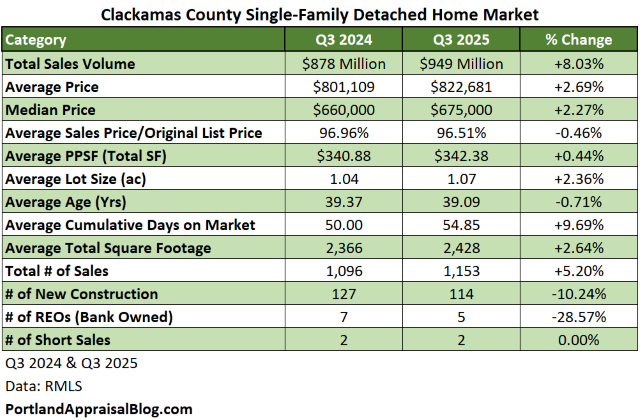
Clackamas County Q3 2025 Stats
Clackamas County, while comprised of some urban cities, has many rural portions and houses on acreage lots. Commercial and hobby farming is common throughout the county. The following table summarizes important metrics for Clackamas County:
Clackamas County posted 1,153 single-family sales in Q3 2025, up from 1,096 in Q3 2024. Total sales volume rose 8% to $949 million, and the average price increased to $823K, up about $22K year-over-year.
CDOM rose from 50 to 55 days, indicating a modest slowdown in buyer urgency.
Average total square footage increased by 2.6%, suggesting a slight shift toward larger homes.
New construction declined, with 114 sales, down about 10% from the 127 recorded in Q3 2024.
In the core market (< $1M), Q3 2025 saw 954 sales, up from 919 in Q3 2024. Total volume rose to $613 million, compared to $578 million the year prior. The average price increased 2.2% to $642K, and CDOM rose from 46 to 51 days.
The luxury market (≥ $1M) also expanded. Q3 2025 recorded 199 sales, up from 177 in Q3 2024, with total volume reaching $336 million, up from $300 million. The average price dipped slightly to $1.69M, and CDOM held steady at around 72 days.
Yamhill County Q3 2025 Stats
Yamhill County is known for its wineries and other agricultural products. The following table summarizes important metrics for Yamhill County:
Yamhill County recorded 248 single-family sales in Q3 2025, down from 298 in Q3 2024. Total sales volume fell 15% to $151 million, though the average price rose slightly to $607K, up about $10K year-over-year.
CDOM held steady, dipping slightly from 68 to 66.5 days.
Average PPSF increased by 1.7%, reaching $311/SF.
New construction dropped sharply, with just 18 sales, down from 67 last year.
In the core market (< $1M), Q3 2025 saw 226 sales, down from 279 in Q3 2024. Total volume fell to $120 million, compared to $151 million the year prior. The average price declined to $530K, a 2% dip from Q3 2024, and median price dropped from $510K to $481K.
The luxury market (≥ $1M) grew modestly in volume but softened in pricing. Q3 2025 recorded 22 sales, up from 19 in Q3 2024, with total volume rising to $30.7 million, up from $27.5 million. However, the average price fell to $1.40M, down from $1.45M the year prior—a 3.5% decline. The median price rose slightly, from $1.23M to $1.24M, but CDOM surged from 111 to 182 days, suggesting longer marketing times and slower absorption for high-end listings.
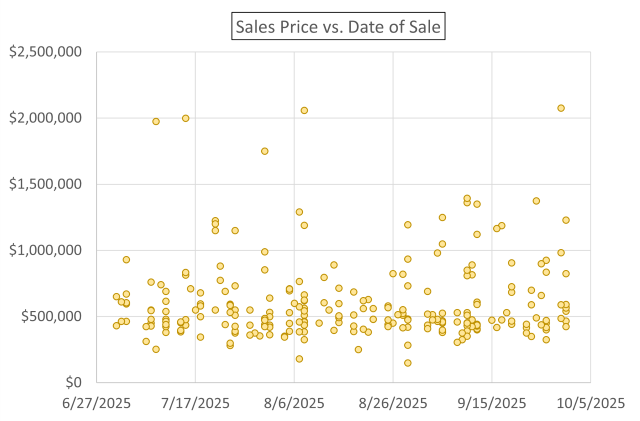
The following is a visual snapshot of the Yamhill market:
Each yellow dot represents a closed sale. While most transactions clustered below the $800K mark, a few high-end sales pushed past $2 million, underscoring the county’s growing luxury presence—even as overall volume declined.
Columbia County Q3 2025 Stats
While this county is 688 square miles it only has a population of approximately 54,000 people. The county is known for timber and wood products. The following table summarizes important metrics for Columbia County:
Columbia County recorded 128 single-family sales in Q3 2025, up from 114 in Q3 2024. Total sales volume rose 10.8% to $63 million, even as the average price dipped slightly to $492K, down about $7K year-over-year.
Average PPSF jumped 10.6%, reaching $293/SF—a notable gain for a rural market.
CDOM held steady, rising just one day to 63.
New construction remained minimal, with just 2 sales, down from 3 last year.
In the core market (< $1M), Q3 2025 saw 127 sales, up from 114 in Q3 2024. Total volume rose to $61.9 million, up from $56.9 million. The average price declined to $487K, a 2.3% dip, and median price slipped from $474K to $470K.
The luxury market (≥ $1M) made a rare appearance. Q3 2025 included one sale at $1.13 million, marking a shift from zero luxury closings in Q3 2024. The home sold at 94% of its original list price, with a lot size over 4 acres and 3,297 sq. ft. of living area.
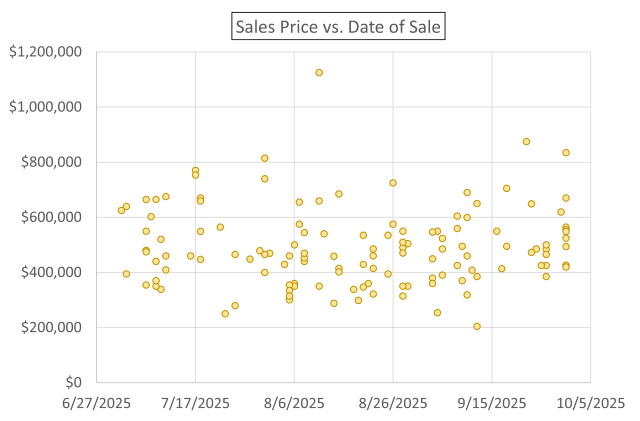
The following is a visual snapshot of the Columbia market:
Each yellow dot represents a closed sale. Most transactions clustered below the $600K mark, with a single outlier crossing the $1 million threshold—Columbia’s lone luxury sale for the quarter.
Hood River County Q3 2025 Stats
Hood River is the second smallest county in Oregon by area at 533 square miles. The population is estimated to be about 24,000 people. This county is known for its fruit products and outdoor recreational activities.
Hood River County recorded 36 single-family sales in Q3 2025, up a single sale from Q3 2024. Total sales volume rose 24% to $31.2 million, driven by a surge in high-end activity. The average price jumped to $867K, up 20.6% year-over-year.
Average PPSF rose 7.2%, reaching $426/SF.
CDOM increased from 47 to 59 days, reflecting slower absorption.
Average home size expanded by 16%, now over 2,140 sq. ft. on average.
In the core market (< $1M), Q3 2025 saw 25 sales, down from 32 in Q3 2024. Total volume fell to $17.2 million, compared to $20.9 million the year prior. The average price rose to $689K, a 5.4% increase, while median price dipped slightly from $685K to $675K.
The luxury market (≥ $1M) surged. Q3 2025 recorded 11 sales, up from just 3 in Q3 2024, with total volume tripling to $14 million, up from $4.23 million. Despite the volume spike, the average price declined to $1.27M, down from $1.42M last year. Median price also fell, from $1.36M to $1.13M, and CDOM ballooned from 20 to 74 days, suggesting slower turnover despite increased activity.
The following is a visual snapshot of the Hood River market:
Each purple dot represents a closed sale. Most transactions clustered below $1.5 million, with a single outlier near $2 million in mid-July—highlighting the county’s expanding but volatile luxury tier.
That completes our look at the Portland Region Q3 2025 single-family market!
Thanks for reading—I hope you found a useful insight or an unexpected nugget along the way. If you enjoyed the post, please consider subscribing for future updates.
Question: Do you think Q4 2025 will follow the same trajectory, or will it outperform Q4 2024?
CODA
Are you an agent and wonder why appraisers always do “x”?
A homeowner with questions about appraisal terminology or methodology?
If so, feel free to reach out—I enjoy connecting with market participants and am always happy to help where I can.
And if you’re in need of appraisal services, we’d be glad to assist.
We are about to close out Q3 2025, but let’s take a look back and see how the Portland Region single-family detached home market performed in Q2 2025 versus Q2 2024.
Let’s define the Portland Region as the following six counties: Columbia, Clackamas, Hood River, Multnomah, Washington, and Yamhill—essentially all counties contiguous with Portland’s home county of Multnomah, plus Yamhill.
DATA HOUSEKEEPING
The information in this post will be based on properties that sold on the open market, defined as listed in RMLS, the primary multiple listing service for the Portland Region. The data was parsed with tools created by the blog author to weed out/correct, among other things, listing errors and misclassifications (e.g. land or condominium sales in the single-family category). RMLS has a listing category, SNL, “Sold Not Listed,” that allows agents to put properties that were sold off market into the database. Those properties have been excluded from the following analyses.
Portland Region 2025 Q2 Overview
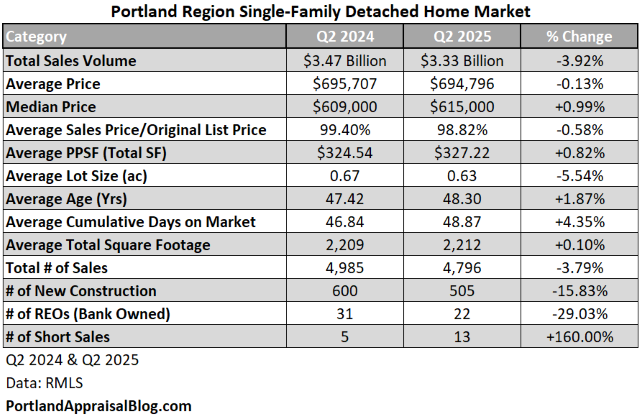
Q2 2025 was nearly the same in most important metrics. The following table compares the two quarters:
Not a lot changed from Q2 2024 to Q2 2025. The total sales volume dollar amount was slightly down in the second quarter versus the previous year. The 3.9% drop almost perfectly mirrors the drop in the number of sales.
The average home price in Q2 2025 was $694,796, which is almost identical to the average price in Q2 2024. A nearly $700,000 price tag continues to challenge median-income earners in the Portland region.
The composition of the sales remained steady; the average lot size decreased by 5.5% and the average home size barely changed at all. Homes were, on average, about 48 years old. There was a noticeable drop in the number of new construction sales (approximately 16%)—the high interest rate environment continues to weigh on the market.
Distressed sales, as a whole, were almost the same in the second quarter of 2025 compared to the second quarter of 2024, with one fewer occurrence. REOs and short sales represented just 0.73% of the market.
Let’s parse the data with some visuals.
SALES VOLUME
The following is a treemap of sales volume in the Portland Region for Q2 2025:
Multnomah County had the most sales, representing nearly 39% of the market. Clackamas, Multnomah, and Washington counties (the “Big Three” of the area) comprised the bulk of the housing market, with nearly 91% of the volume.
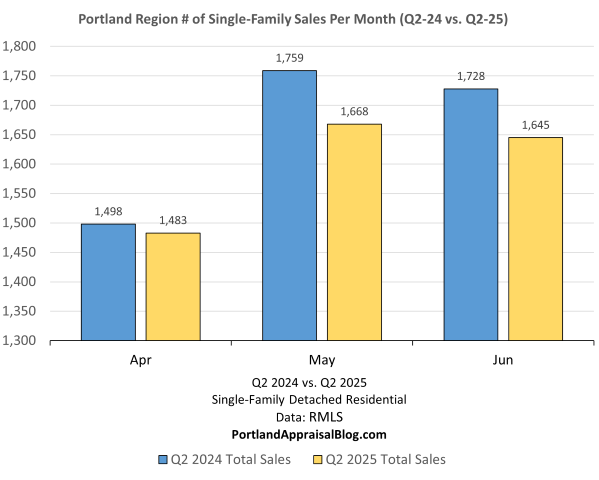
Sales volume was near parity in April, but Q2 2025 lagged behind Q2 2024 for the months of May and June:
Note: The y-axis starts at 1,300 to allow better examination of monthly differences.
SALES PRICE
Q2 2025 was just a sliver below Q2 2024 for April and May and took the crown in June. The average of the three months only placed Q2 2025 about $1,000 below Q2 2024:
Note: The y-axis starts at $600,000 to allow better examination of monthly differences.
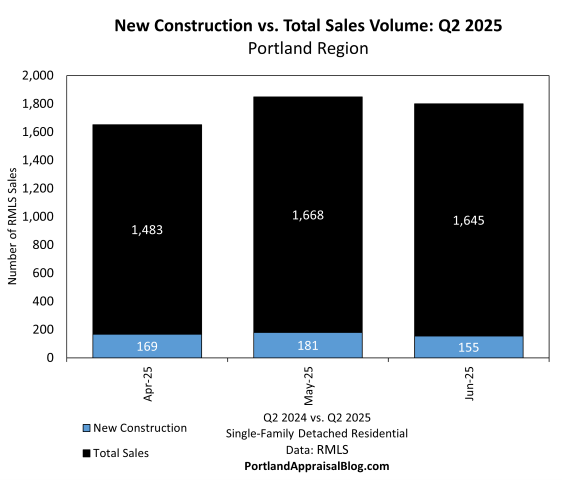
NEW CONSTRUCTION
New construction was 10.5% of the overall market in Q2 2025:
2024 beat 2025 in most counties, with only trivial exceptions coming from Columbia and Hood River:
Washington County dominated the new construction market at 54%. Clackamas County took second place with about 23% of the market and Multnomah came in third at 16%. The Big Three accounted for 93% of the new construction market.
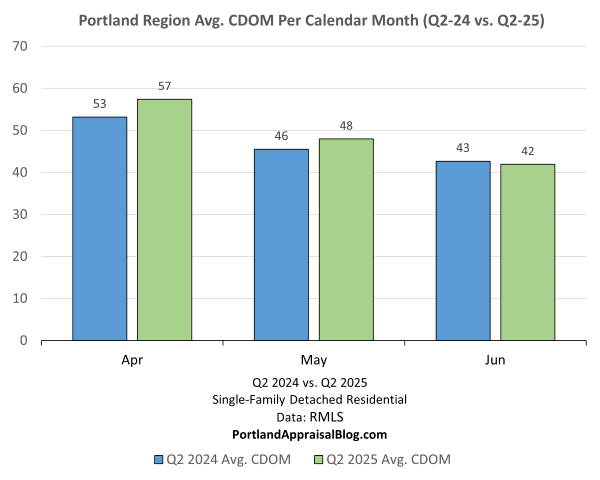
CUMULATIVE DAYS ON MARKET
The average cumulative days on market was up in Q2 2025 two months out of three compared to Q2 2024. The overall rise was modest, averaging approximately 2 additional days for the quarter compared to the previous year:
MISC STATS
Before concluding our overview of the Portland Region as a whole, let’s look at some miscellaneous stats:
The most expensive home that sold on the open market in the Portland Region was a lakefront property located on Oswego Lake. The home sold for $4,500,000, has four bedrooms, four full bathrooms and one half bathroom, is on 0.19 acres and is 6,337 sq. ft. Photos of the property are currently available online and may be viewed here.
The least expensive home was a fixer located in Amity, a city in Yamhill County. The home has rented at the time of the sale, but no interior photos were published online. The home is 1,528 sq. ft. and has a 0.21-acre lot. Exterior photos of the property are currently available online and may be viewed here.
The largest home sold in Q2 2025 was a 9,500-sq. ft. residence that is currently used as a bed and breakfast. The Franziska Haus B&B has 10 bedrooms and 10 bathrooms. The property is situated in Dundee, Oregon, providing convenient accommodations for visitors looking to do wine tasting in the area. The B&B could potentially be used as a private residence with little to no alteration of the interior. Photos of the property are currently available online and may be viewed here.
The smallest home sold in Q2 2025 was a property in Dayton, Oregon. The home is 460 sq. ft. and sits on 4.9 acres. The home is really just a functional apartment attached to one of the two large shops on the site. It is very likely the new owner will be constructing a new residence and turning the apartment into an accessory dwelling unit. Photos of the property are currently available online and may be viewed here.
The property with the largest lot that sold in Q2 2025 is located in North Plains, Oregon. The property has a 90.9-acre lot with a 4,335 sq. ft. home. Most of the lot is sloped and heavily forested. Photos of the property are currently available online and may be viewed here.
Finally, the last miscellaneous Q2 2025 stat belongs to a home that took a cumulative total of 1,047 days to sell. The home is 6,403 sq. ft. and has a 0.85-acre lot. The property is located in an unincorporated part of Multnomah County, south of the City of Portland. The home has good views of the city. The property was listed on 05/19/2022 and was on the market on and off until it sold on 06/06/2025. The initial list price was $3,750,000 and it closed for $2,938,750 as a cash sale. Photos of the property are currently available online and may be viewed here.
Let’s wrap up this post with a quick look at the six individual counties comprising the Portland Region. We will examine them in the order of largest number of sales to the smallest.
Multnomah County Q2 2025 Stats
Multnomah County contains most of the City of Portland. (Very tiny portions of the City of Portland are located in Clackamas and Washington counties.) The following table summarizes important metrics for Multnomah County:
Multnomah County had an increase in the sales volume dollar amount despite the number of home sales being about the same quarter over quarter. The average and median sales prices are up partly due to an increase in the total square footage of homes selling and an average larger lot size. However, even accounting for that influence, Q2 2025 in Multnomah County was stronger than Q2 2024.
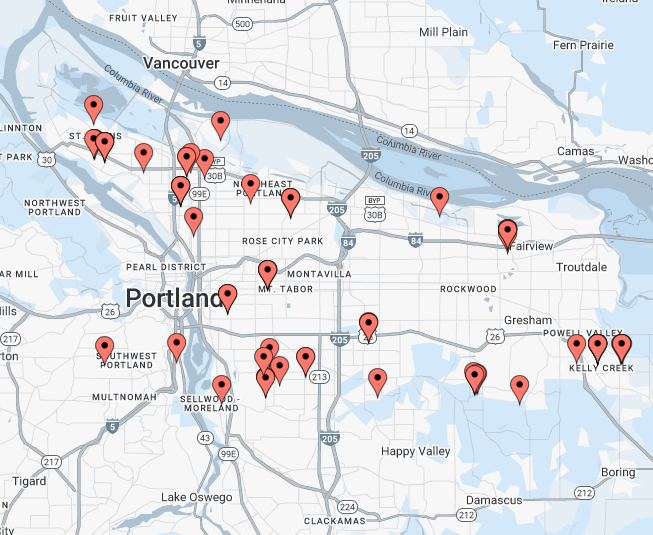
New construction was 4.4% of the Multnomah market, which is healthy given how mature the Portland market is; 59% of new construction was in the City of Portland and 30% was in the City of Gresham:
Distressed sales made up less than 1% of the Multnomah market n Q2 2025.
Washington County Q2 2025 Stats
Washington County contains many properties with a Portland address that are outside official city limits and are under county control. The following table summarizes important metrics for Washington County:
The total sales volume dollar amount slipped below $1 billion in Q2 2025, this was due to a slump in sales, with the number of homes sold dropping almost 10%. Average and median prices were essentially unchanged from Q2 2024.
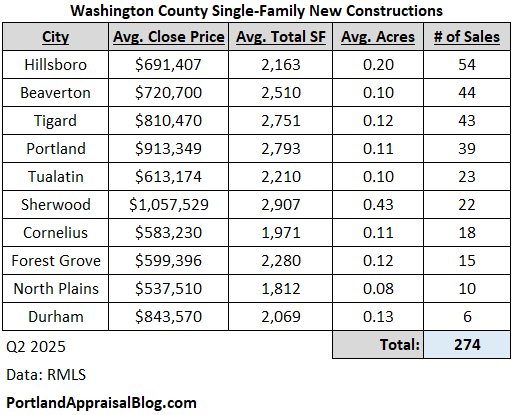
Washington County has the most new construction activity in the Portland Region. While fewer new construction homes closed in Q2 2025 compared to Q2 2024, the new homes comprised the same proportion of the market—nearly 20%.
The following table breaks down the activity by city:
Clackamas County Q2 2025 Stats
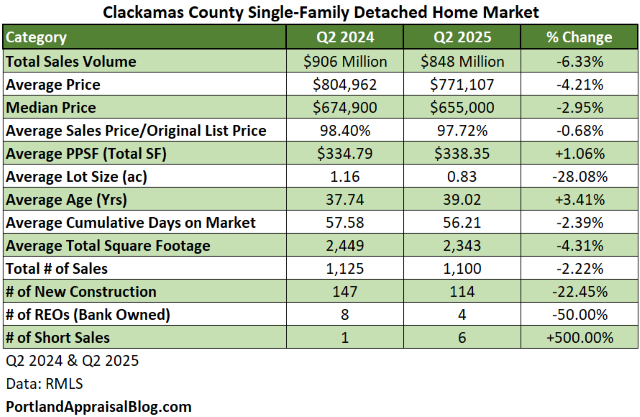
Clackamas County, while comprised of some urban cities, has many rural portions and houses on acreage lots. Commercial and hobby farming is common throughout the county. The following table summarizes important metrics for Clackamas County:
The sales volume dollar amount is down 6.3%, which is larger than the decline in the total number of sales (only 2%). Looking at the table, two stats jump out: the average lot size has declined 28% and the number of new constructions is down by over 22%. The change in the sales composition affected the aggregate stats.
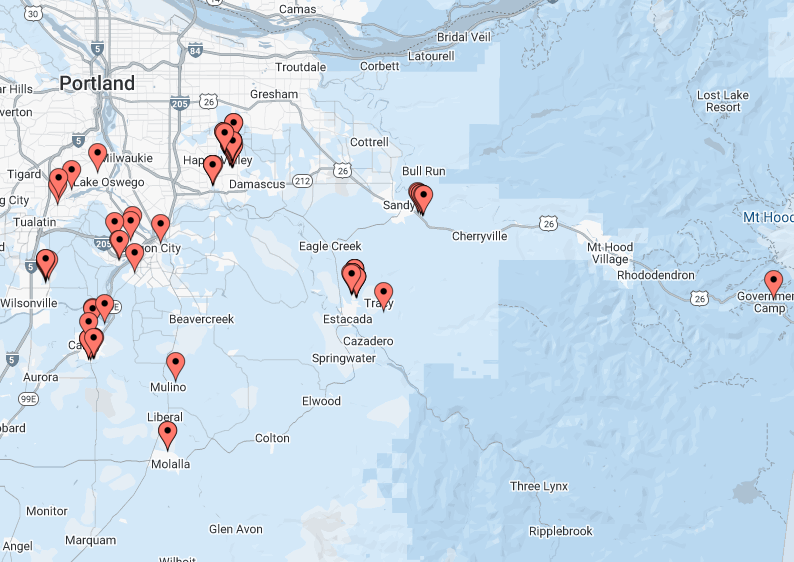
New construction activity in Clackamas County places it 2nd in the region. Most of the new sales occurred in four cities: Happy Valley, Estacada, Canby, and Sandy. The following is a map of the new construction activity in Clackamas County:
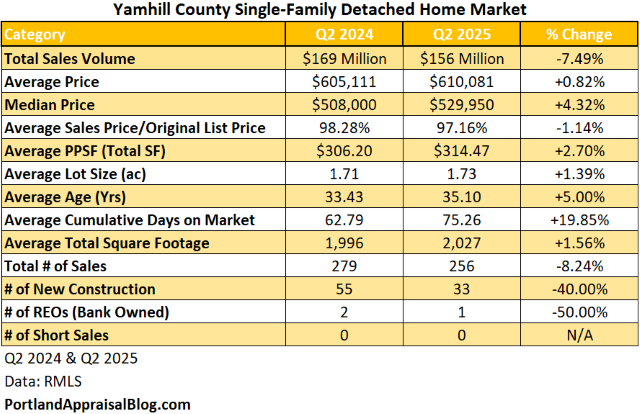
Yamhill County Q2 2025 Stats
Yamhill County is known for its wineries and other agricultural products. The following table summarizes important metrics for Yamhill County:
The total sales volume dollar amount decreased by 7.5% which parallels the drop in the total number of sales (8.2%). The county experienced a sharp drop-off in new construction (40%) and homes are spending about 13 more days on market to sell. Despite the negative statistics, the average and median prices of homes have increased, indicating that individual homes are performing a bit better than the same quarter last year.
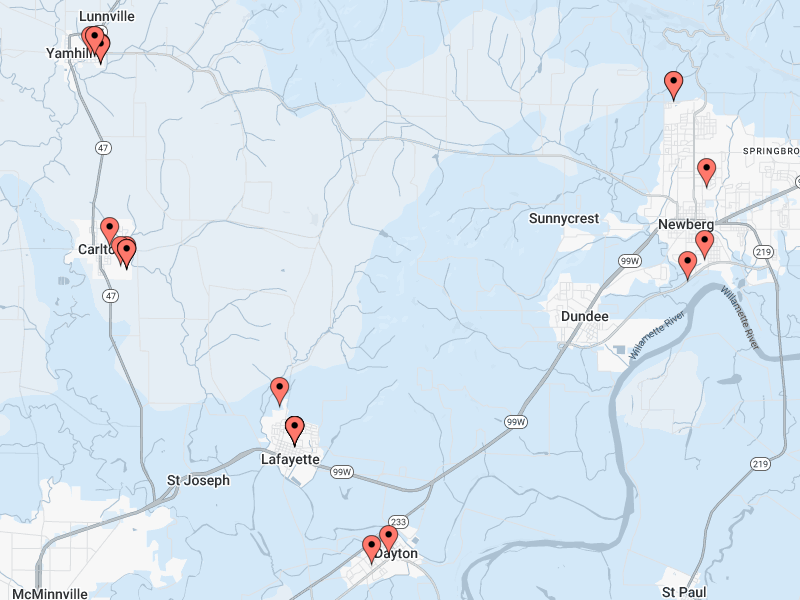
Yamhill’s new construction market is much smaller than Washington, Clackamas, or Multnomah’s in absolute size but is higher proportionally than all save Washington. New homes made up almost 13% of the market. The following is a map of the new construction activity in Yamhill County:
Most sales occurred in the city areas of Yamhill County.
Columbia County Q2 2025 Stats
While this county is 688 square miles it only has a population of approximately 54,000 people. The county is known for timber and wood products. The following table summarizes important metrics for Columbia County:
The total sales volume dollar amount was up over 13% while the total number of sales was up 5.7%. Median and average sales prices also increased, in part due to slightly larger homes on bigger lots selling in 2025 versus its counterpart quarter in 2024. Cumulative days on market climbed nearly 22%, translating to homes taking nearly 16 days longer to find a buyer. Only 2 new construction homes were sold in Q2 2025.
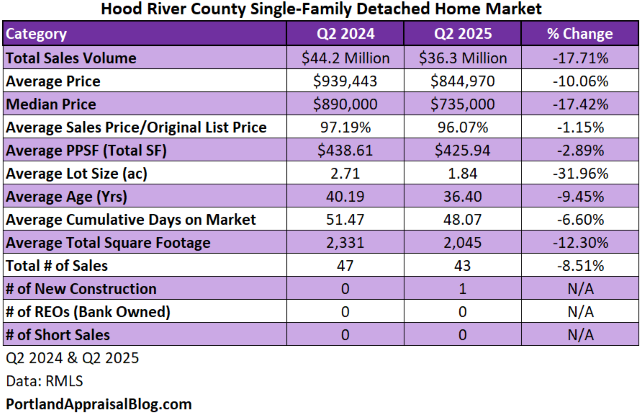
Hood River County Q2 2025 Stats
Hood River is the second smallest county in Oregon by area at 533 square miles. The population is estimated to be about 24,000 people. This county is known for its fruit products and outdoor recreational activities.
The sales volume dollar amount was down almost 18%, which is much higher than the decrease in the total number of sales (8.5%). Much of the decrease can be attributed to smaller homes on smaller lots selling in 2025 compared to Q2 2024. Due to the small market, Hood River often sees more volatility in price and property metrics quarter to quarter.
There was one new construction sale and no distressed sales.
That completes our look at the Portland Region Q2 2025 single-family market!
Thank you for reading the post! I hope you found some useful or interesting nugget of information. Please consider subscribing.
Question: Do you think Q3 2025 will be more of the same or will Q3 2025 outperform Q3 2024?
CODA
Are you an agent and wonder why appraisers always do “x”? Are you a homeowner who received a report and has one or two questions about appraisal terminology or methodology? If so, please feel free to contact me. I enjoy interacting with various market participants and am always happy to help out where I can! And if you are in need of any appraisal services, feel free to reach out to us!
The first half of the year is already over, however, let’s have a look at how the Portland Region single-family detached home market performed in Q1 2025 versus Q1 2024.
Let’s define the Portland Region as the following six counties: Columbia, Clackamas, Hood River, Multnomah, Washington, and Yamhill—essentially all counties contiguous with Portland’s home county of Multnomah, plus Yamhill.
DATA HOUSEKEEPING
The information in this post will be based on properties that sold on the open market, defined as listed in RMLS, the primary multiple listing service for the Portland Region. The data was parsed with tools created by the blog author to weed out/correct, among other things, listing errors and misclassifications (e.g. land or condominium sales in the single-family category). RMLS has a listing category, SNL, Sold Not Listed, that allows agents to put properties that were sold off market into the database. Those properties have been excluded from the following analyses.
Portland Region 2025 Q1 Overview
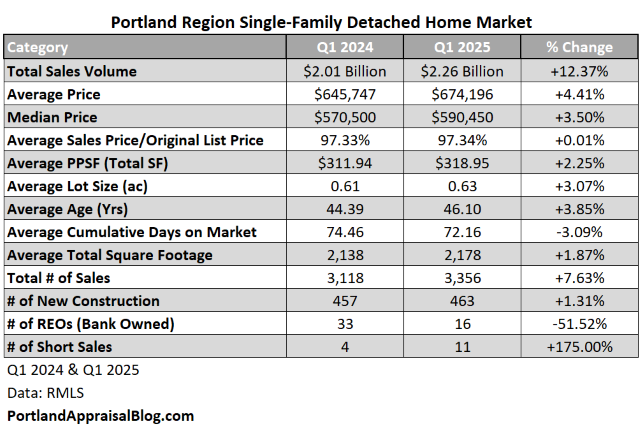
Q1 2025 beat Q1 2024 in most important metrics. The following table compares the two quarters:
The total sales volume dollar amount was about $2.26 billion in Q1 2025, representing a nearly 12.4% increase over the previous year. Much of that increase was due to the number of homes sold being up by 7.6%; however, average and median prices were up as well and the average price per square foot increased by 2.3%. The average home size and lot size were up slightly, but price per square foot generally goes down as home size goes up, so the increase in the average price per square foot in Q1 2025 indicates a stronger residential market.
Despite the increase in home prices, the typical seller had to cut their sales price by about 2.6% in order to get their home sold. This was about the same discount sellers had to give in Q1 2024.
The number of bank owned sales decreased by 51.5% and the number of short sales increased in 175% in Q1 2025. The entire distressed market only represented 0.8% of the total market—not even 1%. It should also be noted the distressed sales declined about 27% in Q1 2025 compared to Q1 2024. Despite high interest rates and persistent inflation, homeowners are meeting their mortgage obligations.
Let’s dive into the rest of the data with some visuals.
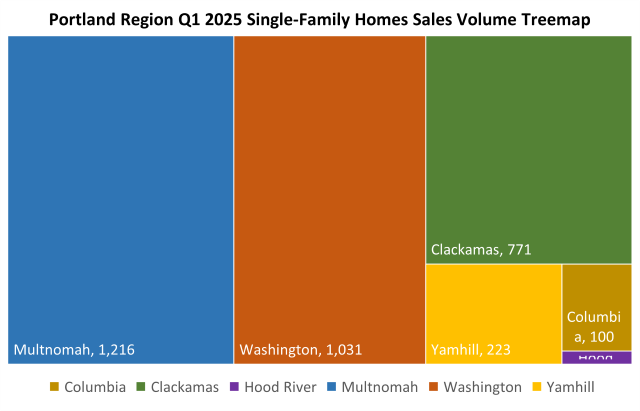
SALES VOLUME
The following is a treemap of sales volume in the Portland Region for the Q1 2025:
As usual, Multnomah County had the most sales (~36% of the entire market). Clackamas, Multnomah, and Washington counties comprised 90% of the sales volume.
Sales steadily increased the first three months of the year. Each month in Q1 2025 was above its corresponding month in Q1 2024.
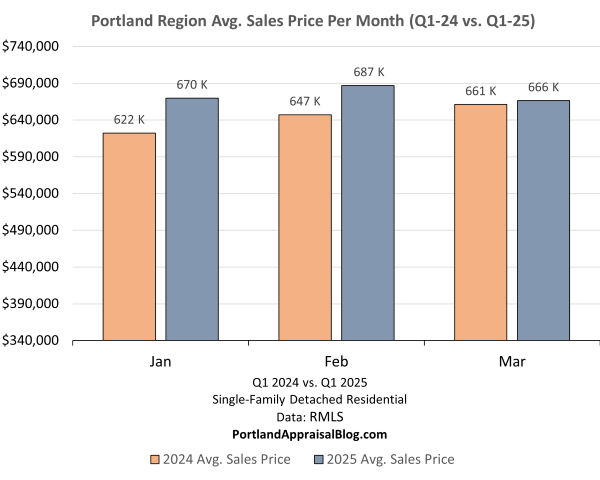
SALES PRICE
Q1 2025 was ahead of Q1 2024 every single month, although it was pretty close in March:
Note: The y-axis starts at $340,000 to allow better examination of monthly differences.
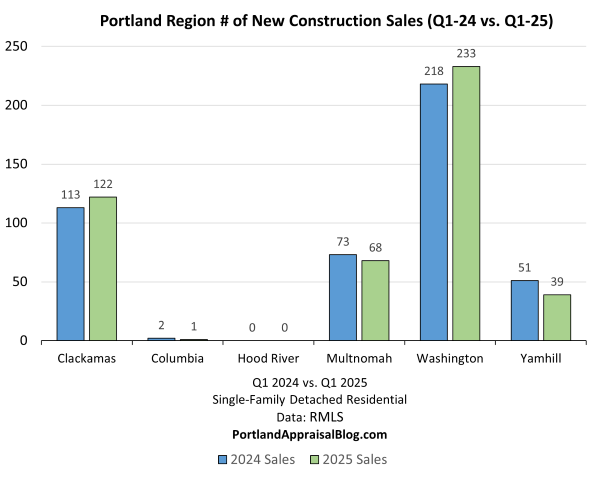
NEW CONSTRUCTION
New construction was about was about 13-15% of the Q1 2025 market:
Washington County had the biggest share of new homes while Clackamas County has the biggest quarter-over-quarter increase:
CUMULATIVE DAYS ON MARKET
The average cumulative days were down in Q1 2025 two months over three compared to Q1 2024. Faster marketing time indicates a stronger market:
MISC STATS
Before concluding our overview of the Portland Region as a whole, let’s look at some miscellaneous stats:
The most expensive home that sold on the open market in the Portland Region was a located in Lake Oswego. The home sold for $6,600,000, has five bedrooms, seven full bathrooms and four half bathrooms, is on 1.22 acres and is is 10,389 sq. ft. The property enjoys beautiful views of mountains and the Willamette River. A video tour of the house is currently available online and may be viewed here.
The least expensive home was a total fixer located in Sandy, Oregon. The home has commercial zoning and backs to a parking lot. It remains to be seen if the house will be torn down or rehabbed. The home is only 768 sq. ft. and sits on a small 2,275-sq. ft. lot.
The most expensive ZIP code (with more than one sale) for Q1 2025 was 97034. This area takes in most of the waterfront area of Oswego Lake:
The ZIP code with the highest volume of sales was 97229:
This ZIP code is large, covering 20.6 square miles and has parts of Multnomah and Washington counties. 150 single-family homes sold in this area in Q1 2025.
Let’s wrap up this post with a quick look at the six individual counties comprising the Portland Region. We will examine them in the order of largest number of sales to the smallest.
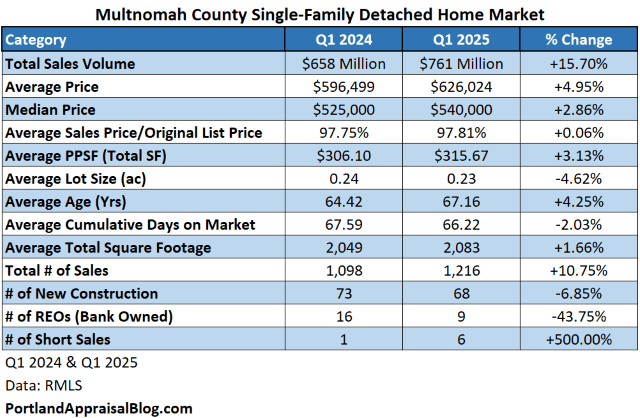
Multnomah County Q1 2025 Stats
Multnomah County contains most of the City of Portland. Very tiny portions of the City of Portland are located in Clackamas and Washington counties. The following table summarizes important metrics for Multnomah County:
Multnomah County saw a robust 15.7% increase in the sales volume dollar amount. Much of that increase was due to the total number of sales increasing by 10.8%. Average price per square foot was up 3.1% and marking time was similar compared to Q1 2024. New construction comprised 5.6% of the total market and decreased 6.9% quarter over quarter. Distressed sales were 1.2% of the market and declined 11.8% compared to Q1 2024.
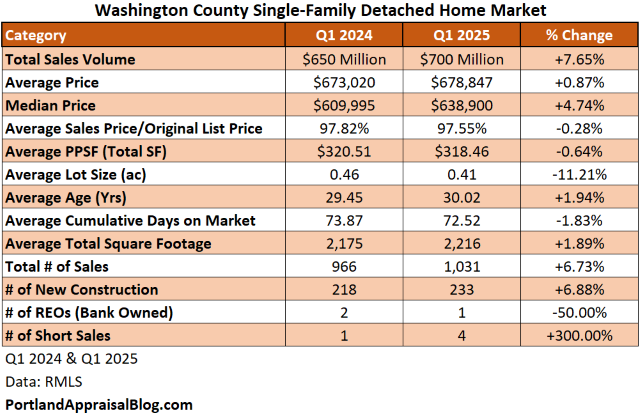
Washington County Q1 2025 Stats
Washington County contains many properties with a Portland address that are outside official city limits and are under county control. The following table summarizes important metrics for Washington County:
The total sales volume dollar amount is up 7.7%, but nearly all of that increase can be explained by the increase in the total number of sales (6.7%). The average price per square foot was flat quarter over quarter. There was a substantial amount of new construction in Washington County—about 22.6%. Most of the new construction homes are located in Beaverton, Hillsboro, county-controlled areas of Portland, and Tigard. The following is a map showing the new construction areas:
Clackamas County Q1 2025 Stats
Clackamas County, while comprised of some urban cities, has many rural portions and houses on acreage lots. Commercial and hobby farming is common throughout the county. The following table summarizes important metrics for Clackamas County:
The sales volume dollar amount is up 12.4%, but total sales volume was only up 3.4%. A large part of the increase can be explained by homes on much larger lots selling in Q1 2025 compared to Q1 2024. New construction was also up nearly 8% quarter over quarter. Market time saw a nearly 13% decrease in Q1 2025.
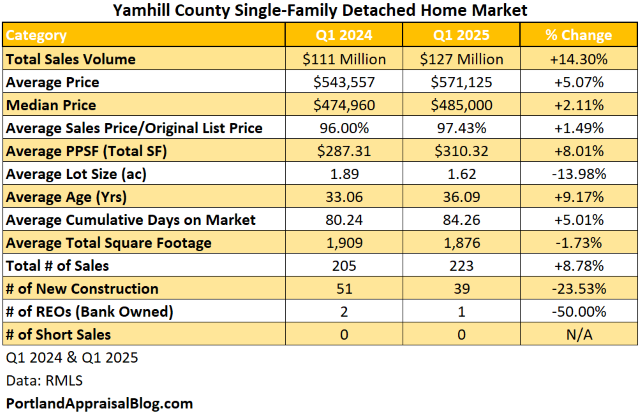
Yamhill County Q1 2025 Stats
Yamhill County is known for its wineries and other agricultural products. The following table summarizes important metrics for Yamhill County:
The total sales volume dollar amount increased by 14.3% while the total number of sales were up 8.8%. The average total lot size of homes selling in Yamhill declined 14% quarter over quarter; despite the smaller lots the average sales price was up 5.1%. New construction dropped by nearly 24% and marketing time increased by 5%.
Columbia County Q1 2025 Stats
While this county is 688 square miles it only has a population of approximately 54,000 people. The county is known for timer and wood products. The following table summarizes important metrics for Columbia County:
The total sales volume dollar amount was up over 16% while the total number of sales were up 11%. Despite the increase in median and average sales prices, the cumulative days on market jumped nearly 24%. Only 1 new construction home came online in Q1 2025. Distressed sales dropped by 60%.
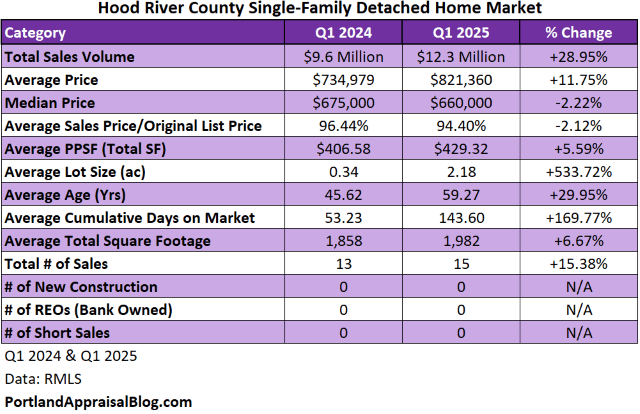
Hood River County Q1 2025 Stats
Hood River is the second smallest county in Oregon by area at 533 square miles. The population is estimated to be about 24,000 people. This county is known for its fruit products and outdoor recreational activities.
The sales volume dollar amount was up nearly 29%, which is much higher than the increase in the total number of sales (15.4%). Much of the increase can be tied to homes on much larger lots selling in Q1 2025. With so few sales, swings in average property metrics are more common. There was no new construction or distressed sale activity in this county in the first quarter of 2025.
That wraps up our look at the Portland Region Q1 2025 single-family market!
Thank you for reading the post! I hope you found some useful or interesting nugget of information. Please consider subscribing.
Question: Do you think Q2 2025 will continue the stronger performance compared to last year?
CODA
Are you an agent and wonder why appraisers always do “x”? Are you a homeowner who received a report and has one or two questions about appraisal terminology or methodology? If so, please feel free to contact me. I enjoy interacting with various market participants and am always happy to help out where I can! And if you are in need of any appraisal services, feel free to reach out to us!


