

Oswego Lake is a scenic and picturesque former channel of the Tualatin River. It is a natural feature, but has been enlarged due to a dam to its present size of ~395 acres.  Many homes rim the lake as well as the smaller bays connected to it. Some of the properties surrounding Oswego Lake are among the more expensive in the Greater Portland Area.
Appraisers endeavor to take the measure of a neighborhood with a variety of tables, charts, and graphs. It helps them to frame the value opinion and see how the subject property relates to the neighborhood as a whole. Let’s examine waterfront properties on Oswego Lake (including the bays). But before we dive in, a…
Quick Note
The following information is based on detached single-family residential homes that were sold and/or listed on the open market as reported by RMLS—the primary MLS service for the City of Lake Oswego. Data was pulled from the year 2000 to the July 2019. The data export was checked, validated, and scrubbed of obvious errors using custom tools developed by the author. With that out of the way, let’s look at some neighborhood stats.
Neighborhood Statistics Overview
The following table summarizes important metrics for the neighborhood. Each column is independent of the others and the basement square foot column reflects only properties with a basement.

There has been relatively little new construction along the lake with ~3.8% of all sales/listings over the past 20 years having been new homes.
The following scatter plot shows all closed-sale detached single-family residences (with a red trendline):

The neighborhood suffered during the housing crisis, but has recovered with prices generally higher than they were before the crash. The red trendline shows prices have leveled and have even dipped a bit. This is further borne out by a review of average and median sales prices over the last two years.

Percentile rank is a way of seeing price bands for the neighborhood. For instance, the 50th percentile, or median rank, shows that half of all sales since the year 2000 have been under $1.29 million. Prices are fairly clustered up to the 70th percentile where the upper range begins to balloon:

The following table shows important marketing information for both the last two years and since the year 2000:

The “SP/OLP” label stands for “sales price/original list price” ratio. This is an important metric, as it shows what the particular property sold for relative to the original list price that was advertised. The “SP/LP” column tracks what the sales price was relative to the final published list price. This column, while not as important as the first one, still yields important insights as to the direction of negotiations. The “DOM” column tracks the days on market for all properties sold and listed and helps frame expected marketing time. Finally, the “CtL” label stands for “contract-to-list” ratio. It is the number of pending sales divided by the total number of listings. A low ratio means many properties are sitting on the open market waiting for offers. A high ratio indicates properties are being absorbed by the market quickly, commonly referred to as a “seller’s market.”
As of this post date, there are more properties waiting for offers than are under contract.
The following table more closely examines DOM as well as CDOM (cumulative days on market). CDOM is also an important metric as homes are often taken off the market and then subsequently relisted (typically at a lower price). The CDOM metric can give you a better idea of total expected marketing time. The table breaks out DOM & CDOM by price segment:

Let’s wrap up the neighborhood statistics overview with the following table showing the sales terms in the market over the last two years:

Unsurprisingly, there is a substantial cash market among waterfront homes.
Let’s conclude our tour of waterfront properties in Lake Oswego with a histogram analysis of the market:
Histogram Analysis
Age
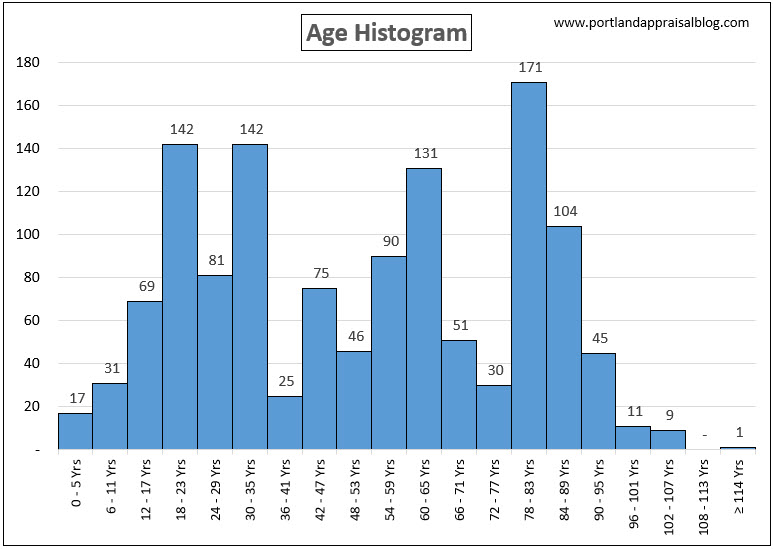
The median age for the waterfront market is 55 years; however, a substantial number of properties are 35 years old or newer.
Bathroom Count

Two to four bathroom homes are typical for the market.
Bedroom Count

The vast majority of homes have between three to five bedrooms.
Garage Stall Count

Most properties have either a two or three-car garage.
Total Square Footage

This metric includes above-grade living area and basement space for a combined figure. The median total square footage around the lake is ~3,600 sq. ft.
Gross Living Area

Gross living area only consider non-basement living space. Often the market reacts more strongly to gross living area, usually applying a discount to basement space. Median gross living area is approximately 2,900 sq. ft.
Level Count

The majority of properties are two to three levels.
Lot Size

There are some acreage properties along the lake, however, the median lot size is 0.21 acres (~9,150 sq. ft.).
# of Sales

The number of sales along the lake have been trending higher this year as compared to the previous two.
Sales Price

This histogram includes sales prices over a 20-year period. The median sales price over the last 20 years is: $1,290,000; and the median sales price over the last two years is: $1,765,000.
The highest sales price obtained among waterfront properties in Lake Oswego (on the open market) is $6,950,000 on 6/20/2000. The home is nearly 14,000 square feet; sits on 1.65 acres; has 7 bedrooms; 9 full bathrooms and 4 half bathrooms (powder rooms) and custom European-style architecture.
The highest listing was for $19,500,000. This was for the property on Jantzen Island.

It is the only private island on Oswego Lake. The home sits on 5 acres, is 13,500 square feet, and is reachable by a gated private bridge. According to an article in the The Oregonian, the property was purchased for $2.2 million in cash back in 1987. $5 million was spent improving the property and it was listed on 9/08/2008 for nearly $20 million. It stayed on the market for that price for more than a year and a half before the listing was cancelled. It was relisted again about a half year later at a reduced price of $15 million, but it stayed on the market for over three years without selling. Had, it sold for even $10 million, it would have set a record for the Lake Oswego market.
So, there you have it, a market overview of waterfront properties on Oswego Lake!
Appraisal Reports
If you are a homeowner and are looking to sell your home, you would greatly benefit from a prelisting appraisal. Our firm will bring high-level analytics to your report and give you a sound understanding of the current market.
If you are an agent and need detailed neighborhood analysis, or analysis of specific areas or specific segments of the market, please contact us and we can generate a custom report to help you frame a listing price for your client!
