

The first half of the year is already over, however, let’s have a look at how the Portland Region single-family detached home market performed in Q1 2025 versus Q1 2024.
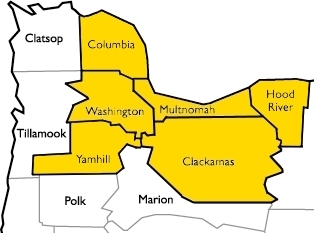
Let’s define the Portland Region as the following six counties: Columbia, Clackamas, Hood River, Multnomah, Washington, and Yamhill—essentially all counties contiguous with Portland’s home county of Multnomah, plus Yamhill.
DATA HOUSEKEEPING
The information in this post will be based on properties that sold on the open market, defined as listed in RMLS, the primary multiple listing service for the Portland Region. The data was parsed with tools created by the blog author to weed out/correct, among other things, listing errors and misclassifications (e.g. land or condominium sales in the single-family category). RMLS has a listing category, SNL, Sold Not Listed, that allows agents to put properties that were sold off market into the database. Those properties have been excluded from the following analyses.
Portland Region 2025 Q1 Overview
Q1 2025 beat Q1 2024 in most important metrics. The following table compares the two quarters:
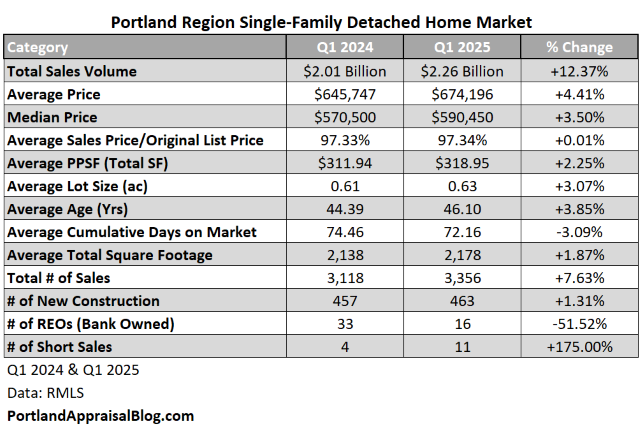
The total sales volume dollar amount was about $2.26 billion in Q1 2025, representing a nearly 12.4% increase over the previous year. Much of that increase was due to the number of homes sold being up by 7.6%; however, average and median prices were up as well and the average price per square foot increased by 2.3%. The average home size and lot size were up slightly, but price per square foot generally goes down as home size goes up, so the increase in the average price per square foot in Q1 2025 indicates a stronger residential market.
Despite the increase in home prices, the typical seller had to cut their sales price by about 2.6% in order to get their home sold. This was about the same discount sellers had to give in Q1 2024.
The number of bank owned sales decreased by 51.5% and the number of short sales increased in 175% in Q1 2025. The entire distressed market only represented 0.8% of the total market—not even 1%. It should also be noted the distressed sales declined about 27% in Q1 2025 compared to Q1 2024. Despite high interest rates and persistent inflation, homeowners are meeting their mortgage obligations.
Let’s dive into the rest of the data with some visuals.
SALES VOLUME
The following is a treemap of sales volume in the Portland Region for the Q1 2025:
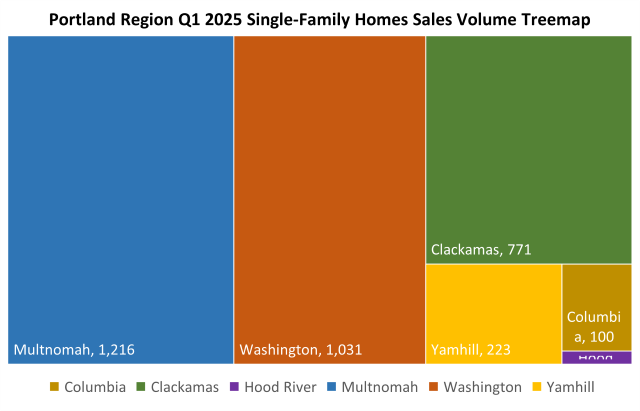
As usual, Multnomah County had the most sales (~36% of the entire market). Clackamas, Multnomah, and Washington counties comprised 90% of the sales volume.
Sales steadily increased the first three months of the year. Each month in Q1 2025 was above its corresponding month in Q1 2024.

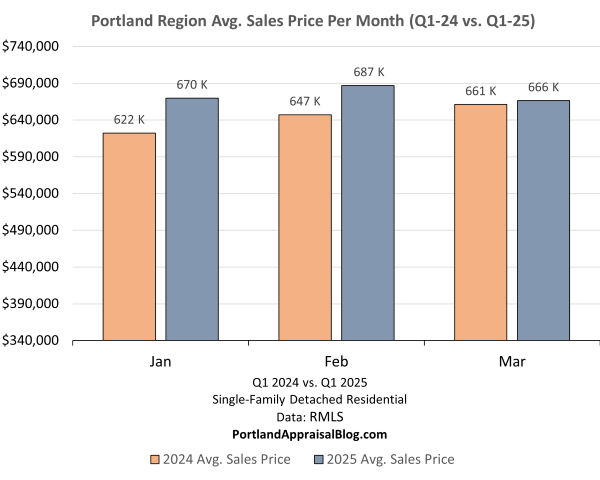
SALES PRICE
Q1 2025 was ahead of Q1 2024 every single month, although it was pretty close in March:
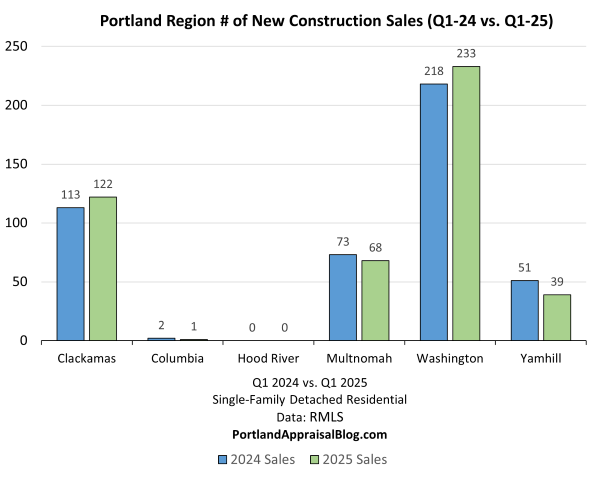
NEW CONSTRUCTION
New construction was about was about 13-15% of the Q1 2025 market:

Washington County had the biggest share of new homes while Clackamas County has the biggest quarter-over-quarter increase:
CUMULATIVE DAYS ON MARKET
The average cumulative days were down in Q1 2025 two months over three compared to Q1 2024. Faster marketing time indicates a stronger market:

MISC STATS
Before concluding our overview of the Portland Region as a whole, let’s look at some miscellaneous stats:
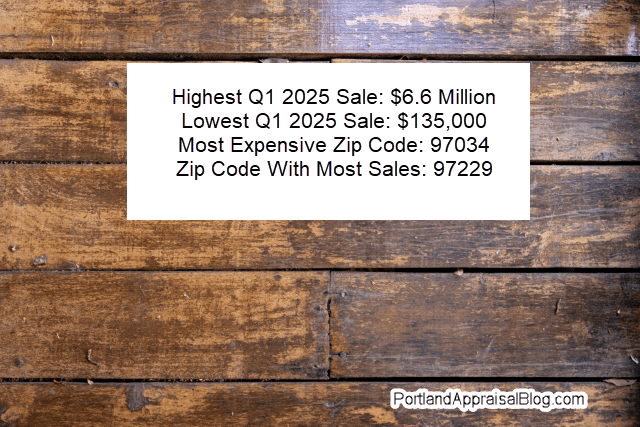
The most expensive home that sold on the open market in the Portland Region was a located in Lake Oswego. The home sold for $6,600,000, has five bedrooms, seven full bathrooms and four half bathrooms, is on 1.22 acres and is is 10,389 sq. ft. The property enjoys beautiful views of mountains and the Willamette River. A video tour of the house is currently available online and may be viewed here.
The least expensive home was a total fixer located in Sandy, Oregon. The home has commercial zoning and backs to a parking lot. It remains to be seen if the house will be torn down or rehabbed. The home is only 768 sq. ft. and sits on a small 2,275-sq. ft. lot.
The most expensive ZIP code (with more than one sale) for Q1 2025 was 97034. This area takes in most of the waterfront area of Oswego Lake:

The ZIP code with the highest volume of sales was 97229:

This ZIP code is large, covering 20.6 square miles and has parts of Multnomah and Washington counties. 150 single-family homes sold in this area in Q1 2025.
Let’s wrap up this post with a quick look at the six individual counties comprising the Portland Region. We will examine them in the order of largest number of sales to the smallest.
Multnomah County Q1 2025 Stats
Multnomah County contains most of the City of Portland. Very tiny portions of the City of Portland are located in Clackamas and Washington counties. The following table summarizes important metrics for Multnomah County:
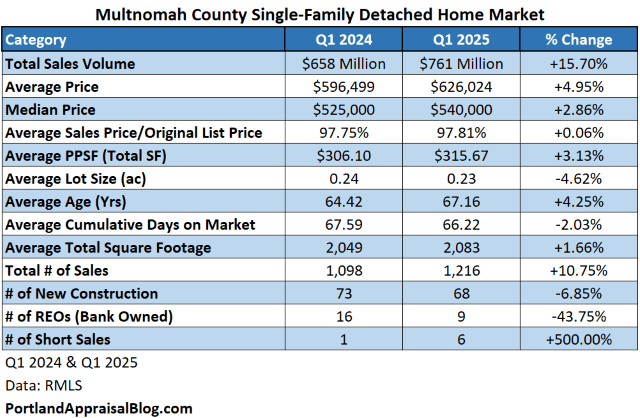
Multnomah County saw a robust 15.7% increase in the sales volume dollar amount. Much of that increase was due to the total number of sales increasing by 10.8%. Average price per square foot was up 3.1% and marking time was similar compared to Q1 2024. New construction comprised 5.6% of the total market and decreased 6.9% quarter over quarter. Distressed sales were 1.2% of the market and declined 11.8% compared to Q1 2024.
Washington County Q1 2025 Stats
Washington County contains many properties with a Portland address that are outside official city limits and are under county control. The following table summarizes important metrics for Washington County:
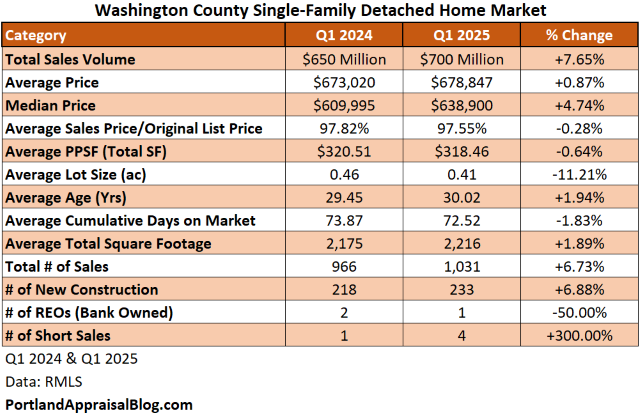
The total sales volume dollar amount is up 7.7%, but nearly all of that increase can be explained by the increase in the total number of sales (6.7%). The average price per square foot was flat quarter over quarter. There was a substantial amount of new construction in Washington County—about 22.6%. Most of the new construction homes are located in Beaverton, Hillsboro, county-controlled areas of Portland, and Tigard. The following is a map showing the new construction areas:

Clackamas County Q1 2025 Stats
Clackamas County, while comprised of some urban cities, has many rural portions and houses on acreage lots. Commercial and hobby farming is common throughout the county. The following table summarizes important metrics for Clackamas County:

The sales volume dollar amount is up 12.4%, but total sales volume was only up 3.4%. A large part of the increase can be explained by homes on much larger lots selling in Q1 2025 compared to Q1 2024. New construction was also up nearly 8% quarter over quarter. Market time saw a nearly 13% decrease in Q1 2025.
Yamhill County Q1 2025 Stats
Yamhill County is known for its wineries and other agricultural products. The following table summarizes important metrics for Yamhill County:
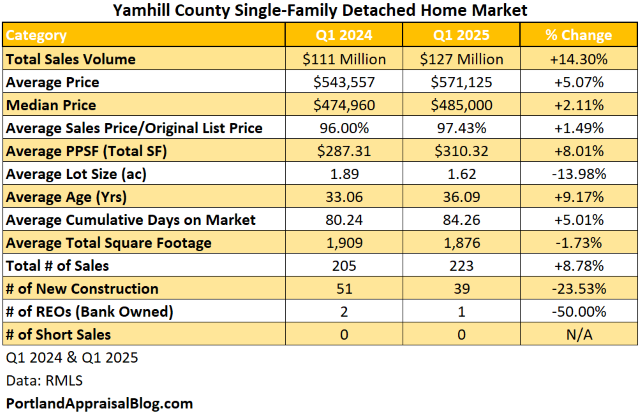
The total sales volume dollar amount increased by 14.3% while the total number of sales were up 8.8%. The average total lot size of homes selling in Yamhill declined 14% quarter over quarter; despite the smaller lots the average sales price was up 5.1%. New construction dropped by nearly 24% and marketing time increased by 5%.
Columbia County Q1 2025 Stats
While this county is 688 square miles it only has a population of approximately 54,000 people. The county is known for timer and wood products. The following table summarizes important metrics for Columbia County:

The total sales volume dollar amount was up over 16% while the total number of sales were up 11%. Despite the increase in median and average sales prices, the cumulative days on market jumped nearly 24%. Only 1 new construction home came online in Q1 2025. Distressed sales dropped by 60%.
Hood River County Q1 2025 Stats
Hood River is the second smallest county in Oregon by area at 533 square miles. The population is estimated to be about 24,000 people. This county is known for its fruit products and outdoor recreational activities.
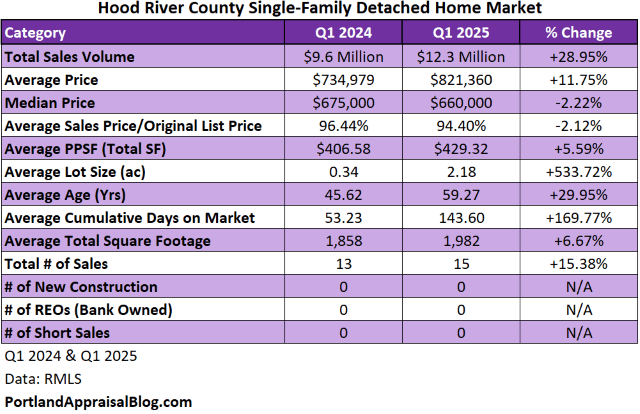
The sales volume dollar amount was up nearly 29%, which is much higher than the increase in the total number of sales (15.4%). Much of the increase can be tied to homes on much larger lots selling in Q1 2025. With so few sales, swings in average property metrics are more common. There was no new construction or distressed sale activity in this county in the first quarter of 2025.

That wraps up our look at the Portland Region Q1 2025 single-family market!
Thank you for reading the post! I hope you found some useful or interesting nugget of information. Please consider subscribing.
Question: Do you think Q2 2025 will continue the stronger performance compared to last year?
CODA
Are you an agent and wonder why appraisers always do “x”? Are you a homeowner who received a report and has one or two questions about appraisal terminology or methodology? If so, please feel free to contact me. I enjoy interacting with various market participants and am always happy to help out where I can! And if you are in need of any appraisal services, feel free to reach out to us!
