

Photo: Abdur Abdul-Malik, Portland Appraisal Blog
Table of Contents
- Introduction
- The Infrastructure Story – How Sandy Reached the Breaking Point
- The Moratorium – Timeline and Mechanics
- The Market Impact – An Appraiser’s Original Analysis (1998–2025)
- Looking Ahead – The Next Decade of Constraints
- Takeaway
- Sources & Further Reading
Introduction
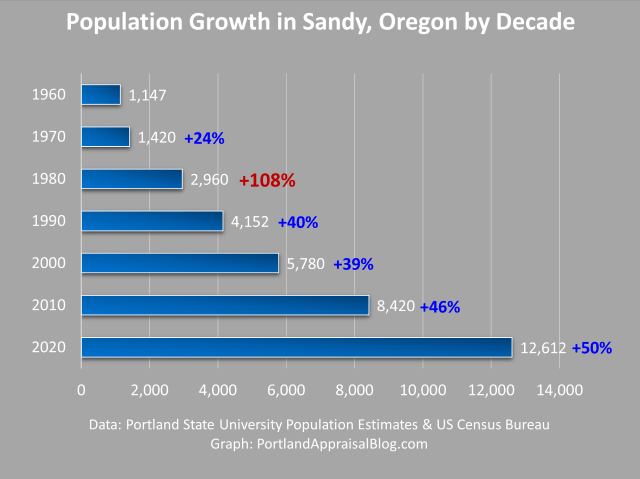
After decades of explosive growth—one of Oregon’s highest rates of new home construction—the City of Sandy faced a severe infrastructure crisis. A federal settlement with the EPA forced the city to impose a moratorium on new sewer connections, halting most new development.
Sandy’s wastewater treatment plant, built in 1965 and last significantly upgraded in 1998, could not keep pace with expansion. Population grew from ~5,000 to over 13,000, adding thousands of homes and overwhelming the system with inflow and infiltration during wet weather. This led to hundreds of violations of Clean Water Act permits, including exceedances of effluent limits and prohibited bypasses that released untreated or partially treated wastewater into Tickle Creek—a tributary of the Clackamas River.
The violations exposed the city to potential civil penalties exceeding $100 million under the Clean Water Act. A fine which, if imposed, could have bankrupted the city. Sandy reached an agreement with the EPA, U.S. Department of Justice, and Oregon DEQ, committing to major upgrades to remediate the pollution.
Key requirements also included limiting new sewer connections—resulting in the moratorium, initiated in October 2022 and extended most recently to June 2, 2026 (Resolution 2025-39). The long-term fix favors piping effluent to Gresham’s plant (target late 2020s–early 2030s).
While vested pre-moratorium projects continue to build and sell in 2026, the backlog will soon run out—likely in the coming years—bringing new construction to a near-total halt. The most significant constraints on supply may therefore emerge 2027–2030, until regional wastewater capacity is fully online.
This post details the timeline, infrastructure roots, and—through original RMLS analysis (1998–2025)—the moratorium’s emerging and future impacts on Sandy’s housing market.
Teaser Stat: New detached single-family homes represented ~27% of all SFR sales from 1998–2025—nearly three times the typical regional average (~10%).

Photo: Abdur Abdul-Malik, Portland Appraisal Blog
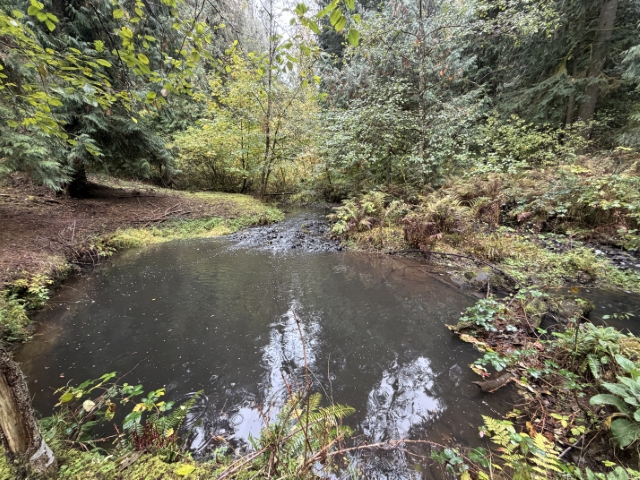
Photo: Abdur Abdul-Malik, Portland Appraisal Blog
The situation underscores the long-term consequences when growth outpaces infrastructure.
The Infrastructure Story – How Sandy Reached the Breaking Point
Sandy’s sewer moratorium didn’t appear out of nowhere. It was the culmination of decades of rapid growth colliding with infrastructure built for a much smaller town.
The city’s wastewater treatment plant was constructed in 1965, designed to serve a population of roughly 2,000–2,500 residents. A significant upgrade in 1998 increased capacity to 1.2 million gallons per day (MGD), but no further major expansions followed.
Meanwhile, Sandy transformed. Between 1998 and 2025, 1,413 new single-family homes were sold (RMLS data)—representing ~27% of all SFR sales over that period, nearly three times the typical regional average.
Population growth accelerated sharply after 1970, leaving the city more than twice as large as it was when the Sandy plant last underwent a major upgrade (1998):
The result placed extraordinary demand on the aging system. During wet weather, inflow and infiltration (I&I)—stormwater entering through direct connections and groundwater seeping into pipes—routinely overwhelmed the system. Rain alone might have caused flooding or diluted overflows, but when combined with effluent from homes (wastewater containing nutrients, bacteria, and solids), it resulted in treatment capacity being exceeded, leading to permit violations including the release of untreated or partially treated wastewater into Tickle Creek.

Photo: Abdur Abdul-Malik, Portland Appraisal Blog
The violations triggered federal enforcement. Under the Clean Water Act, potential civil penalties could have exceeded $100 million—a sum larger than the city’s annual budget. The latest biennial budget is $188 million (2025–2027 adopted). In 2023, Sandy reached a Consent Decree with the EPA, U.S. Department of Justice, and Oregon DEQ. The city settled for a reduced penalty of $324,300 (after completing a $200,000 supplemental environmental project for riparian restoration along Tickle Creek) and committed to comprehensive upgrades.
Central to the agreement was the “Sandy Clean Waters” program—a multi-phase overhaul of collection systems, treatment processes, and long-term planning. A key compliance requirement: limit new sewer connections that increase flows until capacity is proven.
This led directly to the moratorium on new land-use applications requiring sewer hookups, first adopted in October 2022 and extended multiple times—most recently to June 2, 2026 via Resolution 2025-39.
The city’s preferred long-term solution is a regional partnership: constructing an approximately 10-mile pipeline to send effluent to Gresham’s larger treatment facility. Engineering studies and intergovernmental agreements are underway, with completion targeted for the late 2020s or early 2030s.

Image: Google Maps

Image: Google Maps
In the interim, the city has made progress on immediate fixes—infiltration repairs, basin upgrades, and stress testing—but growth remains capped to protect water quality and avoid further penalties.
The result is a community that grew faster than its infrastructure could support, now navigating the consequences of that mismatch.
The Moratorium – Timeline and Mechanics
With the infrastructure crisis established, the City of Sandy turned to a rarely used tool under Oregon law: a moratorium on development tied to public facilities.
Authorized by ORS 197.520–197.530, such moratoria allow cities to pause land-use applications when a “shortage of public facilities” exists, provided they demonstrate reasonable progress toward resolution. Sandy has relied on this framework since 2022, extending the moratorium multiple times through public hearings and written findings.
Key Timeline
| Date | Resolution / Action | Key Details |
|---|---|---|
| 10/3/2022 | Resolution 2022-24 | Initial moratorium adopted; no new applications requiring sewer connections accepted |
| 3/20/2023 | Resolution 2023-07 | First extension; stress testing begins |
| 6/20/2023 | Resolution 2023-27 | Consent Decree-aligned moratorium; capacity capped at 300 connections |
| 11/20/2023 | Resolution 2023-34 | Extension to June 2024 |
| 5/20/2024 | Ordinance 2024-09 | Extensions for pre-moratorium approvals to prevent expiration |
| 6/3/2024 | Resolution 2024-11 | Capacity unlocked to ~451 available (conditional EPA approval) |
| 12/2/2024 | Resolution 2024-24 | Extension to June 2025 |
| 6/2/2025 | Resolution 2025-14 | Mass allocation closed; focus on extensions/reassignments |
| 11/17/2025 | Resolution 2025-39 | Current extension to June 2, 2026 |
The moratorium is not a blanket building ban. Remodels, additions that do not increase wastewater flows (e.g., no new bathrooms), and certain replacements are generally permitted. Property line adjustments, variances, and developments using on-site septic systems are also exempt.
What is restricted: new land-use applications that propose additional sewer connections or modifications increasing flows. This includes most new subdivisions, partitions creating additional lots, multifamily projects, and commercial developments requiring hookups.
How Capacity Is Managed
The city uses Equivalent Residential Units (ERUs) as a measure—one ERU roughly equals the wastewater load of a single-family home.
- Initial cap (2022–2023): 120–300 ERUs
- Conditional EPA approval (April 2024): Potential total of 570 ERUs (with pathway to more pending upgrades)
- As of late 2025: Approximately 374 ERUs remain available, primarily reserved for vested pre-moratorium projects, public health needs (failed septics), and limited reassignments—meaning the actual number of new detached single-family homes that can connect is far lower than the ERU figure suggests.
Pre-October 2022 applications (“vested”) retain priority, allowing some construction to continue. However, the backlog is finite, and new non-vested projects face significant hurdles.
The extensions follow state law requirements: six-month terms, public hearings, and findings of ongoing shortage plus progress (e.g., infiltration repairs, engineering for the Gresham pipeline).
This mechanism has bought time for compliance but will eventually constrain supply of new homes—effects explored through market data in the next section.
The Market Impact – An Appraiser’s Original Analysis (1998–2025)
The moratorium’s effects on Sandy’s real estate market are already measurable—and point to a future of tighter supply and shifting values.
Original RMLS analysis of single-family residential (SFR) sales in Sandy ZIP 97055 from January 1998 through December 2025 reveals a market long defined by exceptional new-construction activity, now facing a sharp pivot.
Over 28 years, 5,264 SFR detached home sales closed in Sandy. Of these, 1,413 were new-construction homes—representing ~27% of the total. This is nearly three times the typical share seen in comparable Portland-metro and Clackamas County markets, where new homes rarely exceed 10–12% of annual sales.
Sandy’s reliance on new construction was extraordinary—and, frankly, almost unheard of in mature real estate markets. In peak years like 2001, more than 60% of all single-family sales were brand-new homes—meaning over one in two transactions involved a house that didn’t exist the year before. Even the long-term average of ~27% is roughly three times the norm for established markets. Outside true boom-town anomalies (think early-2000s Las Vegas or parts of Florida), you rarely see new development dominate to this degree. For decades, Sandy operated less like a typical suburb and more like an active greenfield expansion zone.
The pattern was not uniform:
- Early 2000s peak: New construction frequently exceeded 50–60% of sales.
- Mid-2010s dip: Share fell to single digits during post-recovery caution.
- 2018–2023 resurgence: New homes consistently 20–32% of sales, reflecting migration, low rates, and Sandy’s appeal as a Mt. Hood gateway.
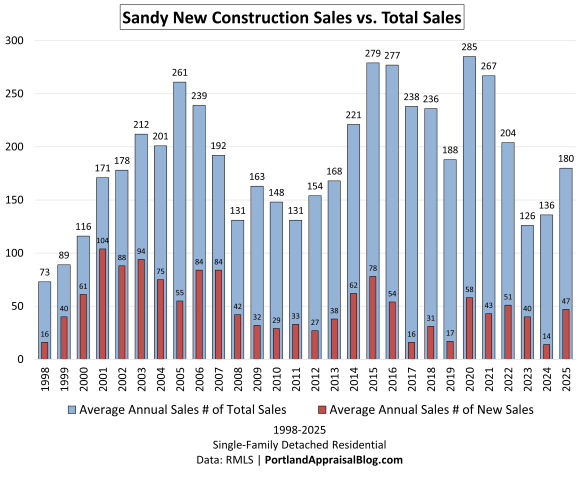
Focusing on new construction as a percentage of total sales shows Sandy peaking over 60% and beginning a downward trajectory, bottoming in 2017. A new trend began in 2018, interrupted by the moratorium:

The 2024–2025 period marks the clearest shift:
- 2024: New share fell to 10.3% (lowest since the Great Recession era).
- 2025: Partial rebound to 26.1%, reflecting the final closings from vested pre-moratorium projects.
This rebound masks the underlying trend: the pipeline of vested developments is thinning. As it exhausts, new supply faces a near-total halt.
Price Per Square Foot Trends
Average price per square foot (PPSF) rose across both segments, but patterns differ due to size variation.
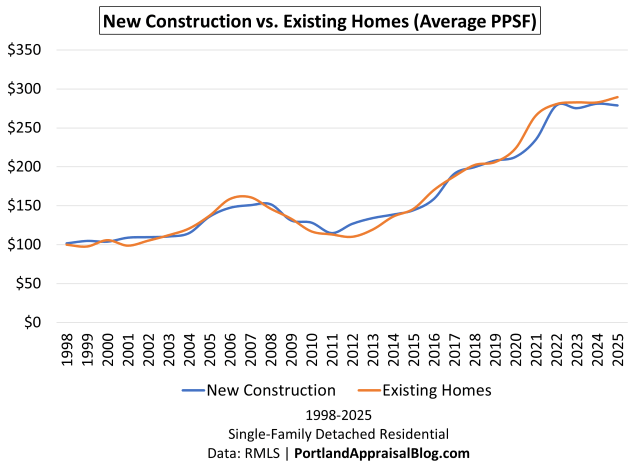
- Existing homes: Steady increase from ~$100 in 1998 to $290 in 2025.
- New construction: Slightly more volatile, often tracking below existing PPSF in many years—largely because new homes averaged significantly larger square footage and PPSF generally declines the larger a home gets.
The 2014–2015 period provides the clearest evidence that PPSF differences are primarily size-driven. During those years, new and existing homes had nearly identical average square footage (~1,780 SF), and PPSF tracked very closely (~$138–$146), with no consistent advantage for new construction. Other crossing points (e.g., 2004–2005, where existing edged higher, and 2010) further illustrate that per-square-foot pricing reflects size and market timing more than construction age.
Size and Age: New Homes Drove Greater Demand
New construction trended larger and more fixture-intensive—amplifying strain on the system.
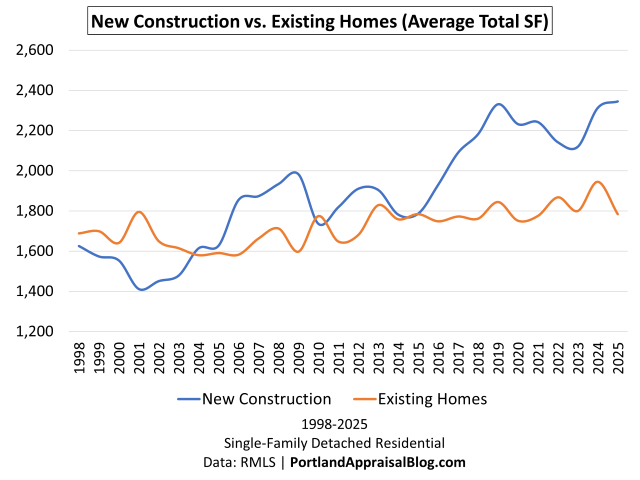
- Average total SF (new): Progressed from ~1,600 in early years to 2,300–2,345 in 2024–2025.
- Average bedrooms/baths (new): 3.7–3.8 beds / 2.5–2.6 baths in recent years (vs. existing ~3.3 beds / 2.0 baths).
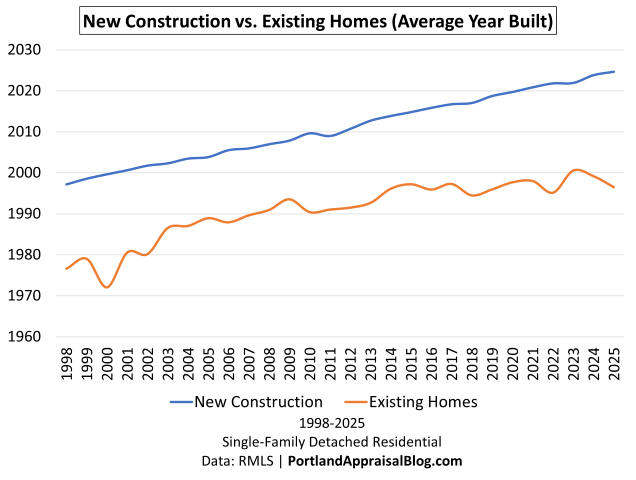
Sandy’s overall housing stock is notably younger than the broader Portland region. Average year built for all homes sold in the period was ~2003, compared to a regional average age of ~48 years (Q3 2025 data). The narrower gap in the late 1990s reflects an earlier growth surge in the 1980s, which temporarily refreshed the existing stock. The widening gap from 2000 onward illustrates the intensity of subsequent development.
Field Observations: Vested Projects in Transition
On-site visits to pre-moratorium subdivisions reveal ongoing construction in vested phases, contrasting with the broader supply constraint as the backlog thins.
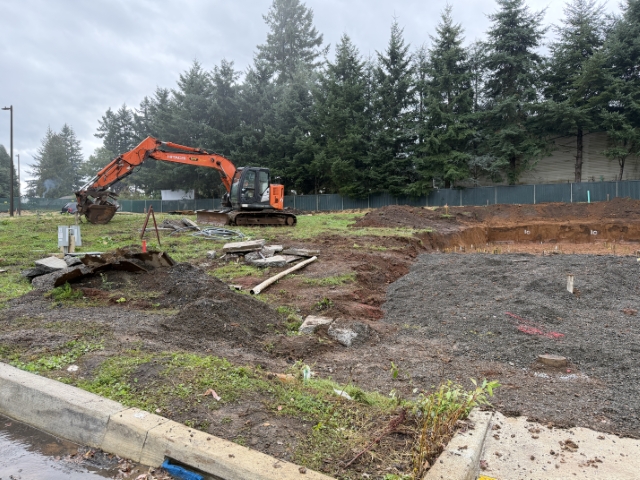
Photo: Abdur Abdul-Malik, Portland Appraisal Blog
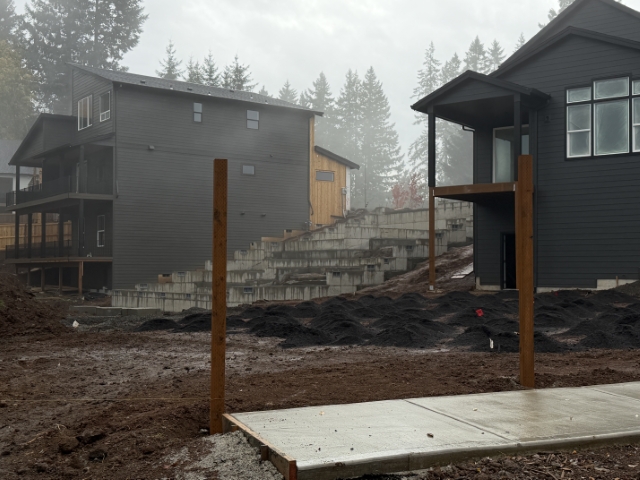
Photo: Abdur Abdul-Malik, Portland Appraisal Blog
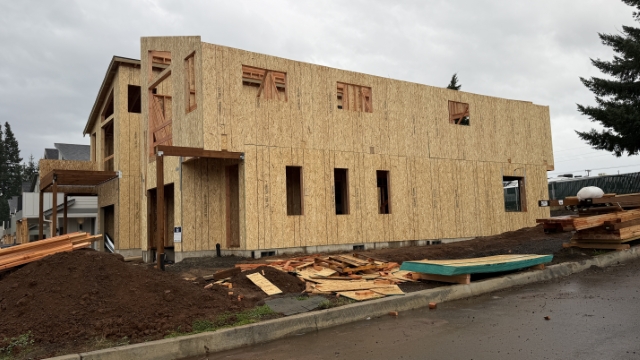
Photo: Abdur Abdul-Malik, Portland Appraisal Blog
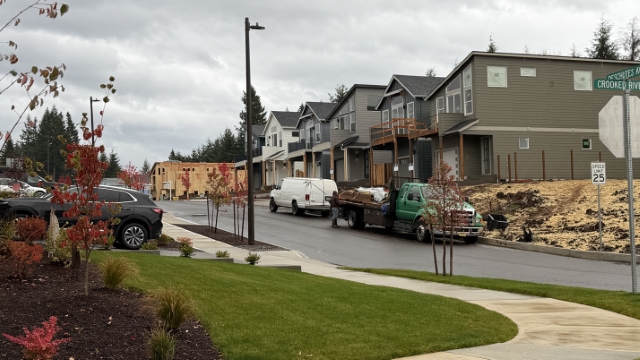
Photo: Abdur Abdul-Malik, Portland Appraisal Blog
Summary of Impacts
- Supply: New construction share has fallen from a long-term ~27% average to volatile single-digit territory in 2024, with 2025’s rebound likely the final surge.
- Pricing: Overall PPSF has risen steadily across both segments, influenced by size differences rather than consistent age-based premiums.
- Future: As vested projects complete, non-vested development faces severe constraints until regional capacity arrives.
The data confirms a market transitioning from abundance of new inventory to reliance on existing stock—with corresponding pressure on redevelopment and constrained large-scale growth.
Looking Ahead – The Next Decade of Constraints
The moratorium on new sewer connections is currently extended through June 2, 2026 (Resolution 2025-39, adopted November 2025). City staff and council findings indicate continued six-month renewals are likely until permanent capacity is secured.
While some pre-moratorium (“vested”) projects continue construction and sales in 2026, the remaining backlog of allocated connections is finite—approximately 374 ERUs as of late 2025, mostly reserved for committed developments and limited exceptions.
As this pipeline exhausts—likely in the coming years—new non-vested development will face a near-total halt. The most significant supply constraints may therefore emerge 2027–2030, a period when demand from Portland-metro spillover could remain strong but new inventory options are severely limited.
The city’s preferred long-term solution is a regional partnership: constructing an approximately 10-mile pipeline to route effluent to Gresham’s larger treatment facility. Engineering studies and an intergovernmental agreement were targeted for completion by late 2025, with construction and transition spanning several years thereafter (city estimates point to the late 2020s or early 2030s for full operation).
Until then, the Consent Decree and state law require ongoing limits on connections that increase wastewater flows.
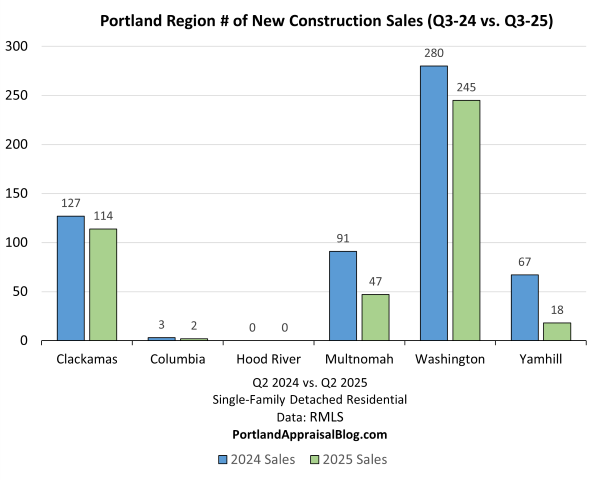
Regional Ripple Effects
Sandy’s constraints will soon begin to influence broader county trends. New single-family detached sales in the Portland region show Washington County maintaining strong dominance in volume, with Clackamas County (home to Sandy) less than half the volume. As Sandy’s vested backlog thins, Washington County’s lead in regional new construction is likely to grow.
The Rising Cost of Connection
The Clean Waters program and eventual Gresham partnership come with substantial financial implications for ratepayers and future development.
To fund the estimated $211–$245 million total program cost, Sandy has implemented significant rate increases. Residential sewer bills now include a base fee of $35.08 per month plus a usage charge of $9.00 per CCF (Centum Cubic Feet; one CCF equals 100 cubic feet of water, or approximately 748 gallons—a common billing unit for utilities).
For a typical household using 7–10 CCF per month, the extra $40–$50 per month over comparable Gresham rates is equivalent to the cost of two streaming services or a budget gym membership. With projected annual increases of 10–15% to service the program’s debt, this gap is expected to widen in coming years—potentially adding $6,000 or more in additional costs per household over a decade.

Photo: Abdur Abdul-Malik, Portland Appraisal Blog (CC BY-SA 4.0)
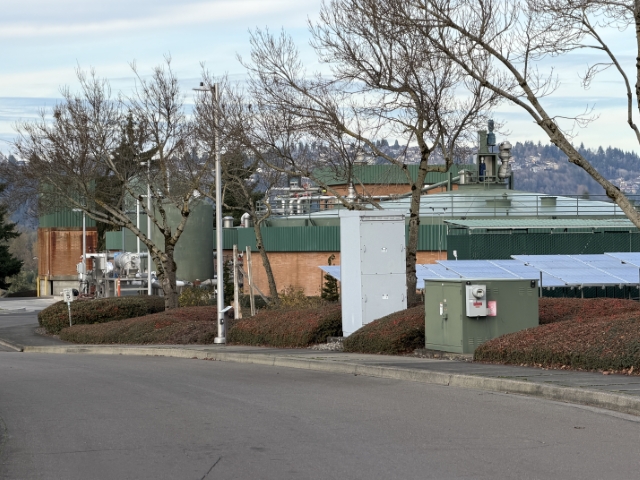
Photo: Abdur Abdul-Malik, Portland Appraisal Blog (CC BY-SA 4.0)
| Cost Category | Historical Baseline (Sandy) | Current/Projected (2025–2026+) | Gresham Benchmark |
| Total Program Cost | N/A | $211–$245 million | N/A |
| Monthly Base Rate | ~$30 | $35.08 | $27.18 |
| Usage Rate (per CCF*) | ~$7.76 | $9.00 | $2.41 |
| Est. Monthly Bill (Avg User) | ~$55–$65 | ~$75–$85+ (with increases) | ~$44–$51 |
| SDC (Detached SFR) | ~$3,000–$5,000 | Under review (likely higher) | $7,915 |
These higher ongoing expenses represent a notable shift. Once the moratorium lifts and regional capacity is online, the elevated barrier to entry—through both system development charges and monthly utility costs—may alter the economics of large-scale new construction compared to the 1998–2023 boom period. The full impact on development feasibility remains to be seen.
Vacant Land and Interim Use
For vacant lots without vested rights, the moratorium creates a prolonged holding period. Highest and best use as immediate residential development is no longer supportable; instead, these parcels function as speculative holds for future development—potentially until the Gresham pipeline is operational around 2030.
This interim use introduces time-value considerations in appraisals: discounted cash flow adjustments for the delay in realizing development potential, alongside uncertainty over final SDC levels and rate structures.
Alternative Development Paths
The moratorium explicitly exempts developments using on-site septic systems, provided they meet Clackamas County health standards for soil percolation, setbacks, and reserve areas (typically requiring ~1 acre minimum for public water, or 2 acres with a well, plus ~10,000 square feet for drainfield and reserve).
This carve-out may encourage a shift in strategy for owners of larger parcels (0.5–2+ acres), particularly on the city’s fringes or within the Urban Growth Boundary. Subdividing such lots into multiple sewer-ready parcels is blocked, as it requires new connections. However, keeping the lot intact and building a single home on septic remains permitted. In fact, owners of adjacent parcels may explore assemblage to create lots large enough to support a single septic system, potentially keeping otherwise vacant land financially viable during the holding period.
Builders—especially spec or custom operators rather than high-volume tract developers—may pivot to this model: larger, high-end homes on assembled junior-acreage or full-acreage sites. This path preserves lot size (necessary for septic viability), limits density, and carries higher upfront costs (~$20,000–$40,000 for the system) plus ongoing maintenance. It is likely most viable for luxury or custom builds, where buyers prioritize space, privacy, and views over urban density.
Over time, this could slow the historical trend toward smaller lots and denser subdivisions (evident in the -15% to -17% correlation between year built and lot size for 1998–2025 sales). Parcels with proven septic suitability may command a premium as one of the few remaining routes to truly new construction.
Market Implications
With new greenfield or large-scale subdivisions effectively paused, buyers will continue relying on existing inventory, including new construction homes already vested. Older properties with existing sewer connections—particularly marginal or teardown candidates—may see increased redevelopment interest, though additions or replacements that increase flows remain prohibited, capping rebuild scale on many lots.
Sandy’s housing market is beginning to adapt to reduced new supply. The next several years will test how it performs under prolonged constraints—until regional capacity finally arrives.
Takeaway
Sandy’s story is a microcosm of a larger challenge facing many growing communities in Oregon and beyond: infrastructure rarely keeps pace with demand. For nearly three decades, new homes made up ~27% of all single-family sales—nearly three times the regional norm—with peaks above 60% in the early 2000s. That pace was extraordinary, but it came at a cost: an aging 1965 treatment plant overwhelmed, permit violations, federal penalties, and now a multi-year moratorium on new sewer connections.
The data reveals a market in transition. The 2024 drop to 10.3% new construction share was an early warning of the supply squeeze, even as 2025 rebounded to 26.1% (likely the final surge from vested projects). While 2026 may still see decent new home closings from the remaining backlog, the real constraints are likely still ahead—potentially dipping to low single-digit percentages (or even near 1%) in the 2027–2030+ period as non-vested development faces a near-total halt.
The long-term fix—a 10-mile pipeline to Gresham—is underway, with engineering studies and intergovernmental agreements targeted for late 2025. However, as of early 2026, it appears the formal IGA between Sandy and Gresham has not yet been signed, illustrating how even well-planned large-scale infrastructure projects frequently encounter delays due to permitting, coordination, terrain challenges, or cost overruns. Such delays could push pipeline completion well into the 2030s and prolong constraints on new supply.
As a result, builders will likely shift their focus to jurisdictions or areas with existing capacity (e.g., neighboring counties or sewered infill sites), further concentrating regional new construction outside Sandy. The next several years will test how the market adapts to prolonged limits—rewarding existing inventory, redevelopment on sewered lots, and alternative paths on larger parcels—until regional capacity finally arrives.
Sources & Further Reading
This post is based on official public records, direct city documents, EPA filings, and original RMLS data analysis (1998–2025). All links were verified as active on January 08, 2026. For the most current moratorium status, always check the City of Sandy’s development moratorium page.
City of Sandy Official Pages
- Development Moratorium Information (main hub – current status, extensions to June 2, 2026, ERU allocation): Link
- Equivalent Residential Units (ERUs) Currently Available: Link
- Sandy Clean Waters Program (project overview, Gresham pipeline, upgrades, $211–$245 million cost range): Link
- Wastewater Consent Decree Settlement (city summary and supporting documents): Link
- EPA Approves New Sewer Capacity for Sandy (2024 ERU increase details): Link
- Adopted Budget 2025–2027 ($188 million biennial budget reference): Link
- Information on New Utility Rates: Link
Key Resolutions (Direct PDFs where available)
- Resolution 2025-39 (extends moratorium to June 2, 2026): Link
- Resolution 2025-14: Link
- Resolution 2024-24: Link
- Resolution 2024-11: Link
- Ordinance 2024-09 (extensions for pre-moratorium approvals): Link
EPA & Federal Documents
- City of Sandy Clean Water Settlement (EPA overview, $100M+ potential penalty context): Link
- Final Consent Decree (PDF – entered September 11, 2023): Link
- EPA News Release on Settlement (July 2023): Link
Regional & Population Context
- U.S. Census Bureau QuickFacts – Sandy, Oregon (2020 census 12,612; historical data): Link
- Portland State University Population Estimate Reports: Link
- PDXScholar Oregon Population Estimates & Reports: Link
City of Gresham Official Pages
- Gresham Wastewater Treatment Plant: Link
- Gresham Wastewater Treatment Plant (20MGD Capacity): Link
- Gresham Wastewater Utility Rates: Link
Oregon Revised Statues
Data & Methodology
- All photos by Abdur Abdul-Malik / Portland Appraisal Blog unless otherwise noted (aerials from Google Maps).
- RMLS single-family residential sales data, Sandy ZIP 97055 (1998–2025). New Construction carefully parsed and classified.
- The Portland Region Q3 2025 Market Update: Portland Appraisal Blog

Thanks for reading—I hope you found a useful insight or an unexpected nugget along the way. If you enjoyed the post, please consider subscribing for future updates.
CODA
Are you an agent in Portland who wonders why appraisers always do “x”?
A homeowner with questions about appraiser methodology?
If so, feel free to reach out—I enjoy connecting with market participants across Portland and the surrounding counties, and am always happy to help where I can.
And if you’re in need of appraisal services in Portland or anywhere in the Portland Region, we’d be glad to assist.
