Real Estate Appraisal Blog Covering the Residential Market in Portland, Oregon & Surrounding Areas
Author: Abdur Abdul-Malik, SRA, ASA
Certified residential appraiser licensed in Oregon and Washington, serving the Portland and Vancouver areas. I extensively serve—and blog about—Clackamas, Columbia, Hood River, Multnomah, Washington, and Yamhill counties in Oregon, as well as Clark, Cowlitz, Klickitat, and Skamania counties in Washington.
Portland’s Home‑Sharing Pilot pays homeowners $200/week to rent spare bedrooms, but appraisers see a valuation blind spot: the income is real to owners yet largely invisible to lenders, GSEs, FHA, and most VA underwriting.
A classic pre-1940 home in the Portland region—the type of property often structurally suited for multi-room sharing arrangements. Photo: Abdur Abdul-Malik, Portland Appraisal Blog
Portland’s Quiet Experiment: Turning Spare Rooms into Distributed SROs
Portland is running a quiet housing experiment in 2026, and it requires no new construction, no zoning fights, and no multimillion‑dollar bond measures. The city is simply trying to activate something already sitting inside thousands of local homes: the spare bedrooms.
Launched in February 2026, the Portland Home‑Sharing Pilot Program offers owner‑occupants a one‑time grant—$1,000 for the first room and $500 for each additional room—to make at least one bedroom available for rent at a capped rate of $200 per week, utilities included. Homeowners must live on site, commit to keeping the room(s) available for 12 months, and work through approved providers (currently PadSplit and Ecumenical Ministries of Oregon). Rooms must meet basic habitability standards under ORS 90.320 and be registered under Portland’s Rental Registration Program. Because the tenant must live inside the same dwelling unit as the homeowner, renters share the home’s kitchen and bathroom facilities in virtually all cases.
This is not short‑term rental housing like Airbnb, nor is it a traditional apartment or ADU. It is something different: an informal, distributed form of single‑room occupancy (SRO) housing.
Oregon’s 2023 statewide SRO legalization (ORS 197A.430) laid the legal groundwork. The pilot operationalizes the same concept—private rooms with shared facilities—without requiring new buildings. A purpose‑built SRO like the Alder House in the Pearl District features small private rooms, shared kitchens and baths, and centralized management. The pilot recreates that basic form, but scatters it across hundreds of existing single‑family homes.
The Sam Galbreath Alder House in Portland’s Pearl District—a purpose-built single-room occupancy (SRO) building featuring centralized management and shared facilities. Photo: Abdur Abdul-Malik, Portland Appraisal Blog
Portland’s housing stock is unusually well‑suited for this model. Many early‑1900s homes contain four, five, or six bedrooms spread across three levels, often with basements that provide natural separation between owner and boarder. Few West Coast cities of similar size have this volume of large, compartmentalized older homes, and that architectural quirk gives the pilot room to function.
Portland is joining a growing list of cities experimenting with room‑rental models as a tool for housing availability. The logic is pragmatic: constructing new deeply affordable units is slow and expensive, while spare bedrooms represent low‑cost “latent capacity.” By requiring owner occupancy, rent caps, and habitability checks, the city hopes to expand housing options without fostering unsafe or absentee‑landlord situations.
It is a creative policy experiment. Yet turning spare rooms into housing supply is not the same as convincing homeowners to participate. The economics, risks, and valuation implications are substantial—and that is where the story becomes especially relevant for appraisers.
Why Homeowners Might Hesitate: Practical, Financial, and Interpersonal Friction
If unlocking spare bedrooms were simply a matter of latent capacity, participation would be straightforward. In reality, those bedrooms sit inside someone’s primary residence. Converting them into rental space introduces proximity, financial, and lifestyle trade‑offs that most homeowners have never faced.
Unlike renting a self‑contained ADU or a fully independent basement apartment, this arrangement means sharing circulation paths, noise, kitchen, and bathroom facilities with a stranger. Even in large early‑1900s Portland homes with three levels and partial separation, daily life overlaps—cooking smells, laundry schedules, late‑night activity, and visitors. For many households, the loss of privacy and control is a significant deterrent.
Financially, the upside is modest. The program caps rent at $200 per week—about $867 per month or $10,400 per year. After increased wear‑and‑tear, higher utility costs, management time, and potential vacancy between tenants, net income for a single room often falls to $500–$650 per month. The one‑time grant ($1,000 for the first room, $500 thereafter) helps with setup but does little for the long‑term picture. Only when homeowners rent multiple rooms does the supplemental income become more meaningful—and at that point, the arrangement begins to resemble a small, owner‑occupied micro‑SRO with all the operational complexity that implies.
A commenter in Willamette Week’s coverage of the pilot captured the prevailing sentiment:
“The potential economic liabilities of participating in this program far outweigh the economic benefits.”
Many Portland homes already use their bedrooms intensively—for children, multigenerational living, home offices, or simply as flexible guest space. A “spare” bedroom is not always functionally spare. Adding a tenant can disrupt household dynamics in ways that are difficult to quantify.
These frictions matter beyond participation rates. They directly influence how appraisers evaluate highest and best use, potential functional obsolescence from increased wear or altered circulation, and long‑term marketability. A home that operates comfortably with one or two boarders may appeal to a narrower pool of future buyers, even if the rental income itself is largely ignored in the appraisal.
The pilot’s success will ultimately hinge on whether enough homeowners decide the trade‑offs are worth it. For appraisers and market participants, that uncertainty is precisely what makes the program worth watching.
Structural Capacity vs. Market Reality
While the previous section outlined why many homeowners may hesitate, the pilot’s very existence rests on a simple fact: Portland’s detached housing stock contains an unusually high number of homes that are structurally well‑suited for room‑rental arrangements. The city’s early‑1900s building patterns, three‑level layouts, and prevalence of basements create a natural foundation for shared‑housing models—at least on paper.
Bedroom Distribution: Portland Has More Large Homes Than People Assume
Detached home sales in 2025 skewed larger than many expect. Nearly 36% of sales had four or more bedrooms, and almost 10% had five or more—precisely the segment most compatible with renting multiple rooms. Since the pilot’s economics only begin to feel meaningful when a homeowner rents two or more bedrooms, this upper tier of the housing stock is where most of the structural feasibility lives.
Bedrooms
No. Sales
% of Total
2 BR
957
17.2%
3 BR
2,580
46.3%
4 BR
1,466
26.3%
5 BR
430
7.7%
6+ BR
87
1.6%
Note: Figures are based on all Multnomah County sales with a Portland city address that sold on the open market in 2025. There were a total of 5,570 sales in 2025. Single-Family Detached Residential | 2025 Data: RMLS | PortlandAppraisalBlog.com
These larger homes are the natural candidates for the pilot’s model. A homeowner with four, five, or six bedrooms has the physical inventory to rent multiple rooms without displacing household needs—a key distinction from smaller homes where “spare” bedrooms are often functionally occupied.
Basements and Separation: Where Feasibility Improves
Basements are not required for participation, but they meaningfully reduce friction. They create partial separation, allow quieter circulation, and soften the proximity concerns described earlier. Portland’s older housing stock delivers here as well: basement prevalence rises sharply with bedroom count.
For appraisers, this matters because basements influence functional utility. A compartmentalized three‑level home with a basement offers natural circulation paths that can reduce (but not eliminate) the friction of shared living. At the same time, these same layouts can signal potential functional obsolescence if the home is modified for multiple tenants—keyed bedroom doors, partitioned spaces, mini‑fridges, or heavier wear patterns that diverge from typical single‑family use.
Structural Capacity Does Not Equal Market Acceptance
Portland’s early‑1900s Craftsman, Foursquare, and bungalow stock—with its compartmentalized floor plans rather than open‑concept designs—creates more “latent capacity” for distributed SRO‑style use than is typical in newer, ranch‑heavy suburbs. But structural suitability is only half the equation. A home that functions well for an owner with two or three boarders may appeal to a narrower pool of future buyers, affecting marketability, comparable selection, and the interpretation of contributory value.
This is where the appraisal lens becomes essential. The housing stock provides the physical opportunity, but the market ultimately determines whether that opportunity translates into value, neutrality, or even a discount.
In short, Portland has the physical inventory. The real question—and the one that matters most for appraisers—is how the market treats homes that participate in the pilot. That requires looking beyond structural feasibility and into the valuation mechanics: GRMs, Fannie Mae’s treatment of boarder income, highest and best use, and the limits of value‑in‑use.
That’s where the next section picks up.
The Valuation Blind Spot: Why Room‑Rental Income Rarely Translates Into Market Value
At first glance, the valuation question appears straightforward: if a homeowner rents out one or more bedrooms in their primary residence under the pilot, does the property become an income‑producing asset? Under conventional GSE guidelines and most VA loans, the answer is generally no. FHA is more flexible, but even there the income must be well‑documented and capped. For the overwhelming majority of transactions, the income generated is treated as value‑in‑use for the current owner rather than market value recognizable by buyers and lenders. That distinction is fundamental.
Why the Income Approach Does Not Apply
The pilot’s temporary 12‑month structure alone prevents capitalization. GRM or income‑approach analysis requires a revenue stream that is durable, predictable, and market‑supported. A pilot program—by definition experimental—does not meet that test. Even if the income were otherwise eligible, appraisers cannot assume it will continue beyond the pilot window.
Fannie Mae’s Selling Guide (B3‑3.8‑01) is clear: “generally, rental income from the borrower’s principal residence…cannot be used to qualify the borrower,” and any qualifying rental income must come from a unit that is separate from the primary residence. A bedroom does not meet that standard—it lacks independent living facilities, so the income it produces is not considered rental income for qualifying or valuation purposes. Limited exceptions exist, such as boarder income with a documented 12‑month history or rental income from a true ADU, but neither applies to a bedroom within the primary dwelling.
Freddie Mac’s guidance (Section 5306.1) follows the same logic. Room‑rental income inside the primary residence is treated as boarder income and is ineligible for qualification except under narrow Home Possible exceptions, which cap boarder income at 30% of qualifying income with a 12‑month history.
FHA is more flexible. Mortgagee Letter 2025‑04 allows boarder income with a 12‑month history (at least 9 of the most recent 12 months documented), capped at 30% of effective income, and supported by bank statements, canceled checks, tax returns, shared‑address documentation, and a written agreement. Even so, the income must be stable, well‑documented, and clearly likely to continue.
VA’s treatment is similarly restrictive, though for different reasons. VA does allow temporary boarder income, but only with two years of signed tax returns showing the income, and only when the rental does not impair the residential character of the property or exceed 25% of the total floor area. The underwriter must also determine that the income has a reasonable likelihood of continued success and justify its inclusion on VA Form 26‑6393. In practice, residual‑income requirements and lender overlays mean many VA lenders exclude boarder income entirely unless it has a long, well‑documented history.
Across all major lending frameworks, the conclusion is consistent: room‑rental income under this pilot is not considered stable rental income. It cannot be capitalized, and it carries no weight in the income approach.
Highest and Best Use Implications
For the vast majority of participating homes, highest and best use remains single‑family residential. Renting bedrooms may provide supplemental cash flow for the current owner, but it does not create a new, financially feasible use that changes the legally permissible or maximally productive use of the property.
There are limited exceptions at the margins. In transitional RM1–RM2 zones—where older single‑family homes sit on land with redevelopment potential—stable boarder income could theoretically support an interim highest and best use if the program persists beyond the pilot window. For aging owners, modest supplemental income may extend the economic life of a marginal property. These situations remain rare and highly property‑specific.
Functional Utility and Marketability
Shared‑living arrangements can also affect functional utility. Homes with multiple boarders frequently show keyed bedroom doors, partitioned spaces, additional refrigerators or mini‑kitchens, heavier wear on shared bathrooms, and circulation patterns that feel more communal than private. While most modifications are reversible, they introduce functional obsolescence relative to typical single‑family buyers and often require additional expense or concessions to restore the home to standard configuration.
Marketability can suffer in subtler ways: more vehicles, increased activity, reduced privacy, and access issues during showings. Sellers may also need to vacate the home before listing, and because these occupants are tenants—not ADU tenants, but tenants under Portland’s relocation‑assistance rules—relocation payments may be required. We covered these rules in detail in our November 2025 post on Portland’s tenant protections.
True SRO vs. Distributed Room Rental
Some homeowners may perceive their property as operating like a micro‑SRO, especially when renting two or three rooms. The comparison does not hold for valuation purposes. Legitimate SROs feature separate leases, independent facilities, and regulatory treatment as income properties. A single‑family home with rented bedrooms may have partial separation—some SFRs do have ADU‑like lower levels with their own kitchens, bathrooms, and entrances—but unless the space meets the definition of a separate dwelling unit, the market continues to value it as a standard single‑family residence.
Bottom Line for Appraisers
The income is real to the participating owner, and in isolated cases a niche buyer may pay a modest premium to continue the arrangement. Unpermitted SRO‑style use already exists quietly in some Portland neighborhoods. If the pilot persists and scales, subtle patterns may eventually emerge in comp selection or marketability adjustments.
Under current rules and market evidence, however, room‑rental income from this program does not contribute meaningfully to market value in typical single‑family transactions. For appraisers, the real blind spot is not ambiguity in the guidelines—it is the gap between public perception and how the lending and valuation system actually treats these arrangements.
Portland’s “Noodles on the Wall” Housing Strategy
The Home‑Sharing Pilot is not an isolated policy experiment. It is one piece of Portland’s broader pattern of trying every available tool to address a persistent housing shortage—from large‑scale capital projects to low‑cost, homeowner‑driven solutions.
The city’s current approach runs on two distinct tracks. The first is the traditional capital‑intensive path: supportive housing, regulated affordable multifamily developments, and publicly funded projects that require years of entitlement, bonding, and construction. These are essential but slow and expensive. The second track is distributed and incremental—ADUs, accessory conversions, and programs like home‑sharing that seek to activate capacity already embedded in the existing housing stock. These approaches rely heavily on voluntary homeowner participation and can scale more quickly when incentives align.
The pilot clearly belongs to the second track. It is inexpensive to launch, fast to implement, and attractive because it demonstrates action without massive upfront capital. Yet its success hinges on the same variable that has challenged similar distributed efforts in Portland: homeowner willingness. ADUs took years of code changes, fee reductions, and cultural normalization before meaningful uptake occurred. Inviting a vetted tenant into one’s primary residence through a city program may require an even larger shift in comfort and risk tolerance.
From an appraisal perspective, this dual‑track reality intersects with a deeper structural issue. Portland’s affordability constraints remain severe. The latest Portland Appraisal Blog Affordability Index (PABAI) reading for detached homes stands at 79.2—firmly in the “severely constrained” range. Median‑income households cannot qualify for the typical detached home under standard lending assumptions, so they remain renters longer. That downstream pressure tightens the rental market for the very individuals the home‑sharing pilot hopes to serve as tenants.
Even if participation grows, the valuation and lending system largely ignores the resulting room‑rental income. As detailed earlier, GSE guidelines, FHA flexibilities, and VA restrictions treat most boarder income as non‑qualifying or incidental. This disconnect means the pilot may expand functional housing supply without meaningfully affecting how properties are financed or valued in the marketplace.
Whether the pilot becomes a meaningful contributor to supply or remains a modest experiment will ultimately depend on participation rates, program durability, and homeowner comfort with shared‑living arrangements. For appraisers, the real takeaway is not the program’s potential scale, but what it reveals about the limits of distributed solutions in a market where income from spare bedrooms still does not reliably translate into recognized market value.
Readers interested in how this fits into Portland’s larger affordability efforts can explore our ongoing series on affordable housing and related policy shifts.
Conclusion
Portland deserves credit for experimentation. The Home‑Sharing Pilot represents a low‑cost, low‑friction attempt to activate latent capacity already embedded in the city’s existing housing stock. At the individual level, it may create workable arrangements for both homeowners and renters while revealing how people actually use their homes under sustained affordability pressure.
Yet the pilot also underscores a structural reality that appraisers see every day: the valuation and lending system ultimately sets the practical ceiling for distributed housing solutions. Room‑rental income inside a primary residence is not treated as qualifying rental income by Fannie Mae, Freddie Mac, FHA, or most VA lenders. The result is a meaningful disconnect—the program can improve lived experience for participants without materially changing how properties are financed, underwritten, or valued in the marketplace.
Whether home‑sharing evolves into a meaningful contributor to supply or remains a modest, low‑uptake experiment will depend on participation rates, program durability, and broader cultural comfort with shared‑living arrangements. For appraisers and market participants, the key takeaway is straightforward: watch closely how—and if—these arrangements begin appearing in listings, seller disclosures, and comparable sales. The policy may change over time, but the valuation framework will continue to define its real‑world impact.
Sources & Further Reading
City of Portland Launches Home Sharing Pilot Program: Announcement
Portland Affordability Index – PABAI: A Realistic Housing Qualification Metric for the Portland Region: Portland Appraisal Blog
Thanks for reading—I hope you found a useful insight or an unexpected nugget along the way. If you enjoyed the post, please consider subscribing for future updates.
CODA
Are you an agent in Portland who wonders why appraisers always do “x”?
A homeowner with questions about appraiser methodology?
If so, feel free to reach out—I enjoy connecting with market participants across Portland and the surrounding counties, and am always happy to help where I can.
And if you’re in need of appraisal services in Portland or anywhere in the Portland Region, we’d be glad to assist.
The Strong Family Apartments transform an underutilized 0.96‑acre site into 75 long‑term affordable family units in Humboldt. With plottage‑enabled density, CM2 zoning, and a 99‑year covenant, the project fills a critical gap in a corridor where only 1%–3% of recent sales were affordable to 60% AMI households.
The Strong Family Apartments at N Alberta St & N Williams Ave in Humboldt, viewed from the intersection. The 4-story building maximizes the assembled 0.96-acre site for 75 restricted affordable family units. Photo: Abdur Abdul-Malik (March 2026), Portland Appraisal Blog
The Strong Family Apartments rise at the corner of N Alberta Street and N Williams Avenue in North Portland’s Humboldt neighborhood—a site long held by the Strong family, whose roots reflect the deep history of Black homeownership and community life in N/NE Portland. For decades, the property remained a modest home surrounded by open grassy land across multiple tax lots. In 2019, the Portland Housing Bureau acquired the site for land banking, and in 2024 transferred title to Strong AA Limited Partnership—a partnership led by Community Development Partners and Self Enhancement, Inc.—to deliver a 75‑unit affordable multifamily community.
True to the project’s name, the development is intentionally family‑oriented and contains no studios. The unit mix includes 21 one‑bedrooms, 32 two‑bedrooms, and 22 three‑bedrooms, with rents restricted at 30% and 60% of area median income. Eleven units are deeply affordable at ≤30% AMI, and the project prioritizes the City’s N/NE Preference Policy for households displaced by past urban renewal and gentrification in North and Northeast Portland. With 54 family‑sized units, the building fills a gap in a neighborhood where market‑rate options have become increasingly out of reach for moderate‑income families.
From an appraisal perspective, the site tells a clear story. Assemblage of multiple parcels into a unified 0.96‑acre lot unlocked plottage value and enabled a highest‑and‑best‑use shift to family‑oriented multifamily housing in the CM2 zone—a designation with no parking minimums and incentives for dense, transit‑supported development along key corridors. The redevelopment transforms a historically underutilized corner into a long‑term community asset governed by a 99‑year affordability agreement.
This post examines the project through that lens: how zoning, public‑private tools, and assemblage shaped feasibility; how restricted‑use valuation differs from market‑rate ownership in Humboldt; and what the Strong Family Apartments reveal about affordability, displacement, and redevelopment in Portland’s evolving N/NE housing landscape.
Site History, Project Details & Zoning
The Strong Family Apartments occupy a prominent corner at N Alberta Street and N Williams Avenue in North Portland’s Humboldt neighborhood. For decades, the property remained under long‑term ownership by the Strong family, whose generational roots reflect the deep history of Black families in N/NE Portland. Prior to redevelopment, the site consisted of multiple smaller tax lots totaling nearly one acre, largely underutilized as open grassy land surrounding a modest single‑family home—clearly visible in 2019 archival Street View and aerial imagery. In CM2 zoning, a medium‑scale commercial mixed‑use designation intended for transit‑served corridors, a single‑family home on such a large combined parcel represented significant underutilization. The zone supports mid‑rise multifamily buildings rather than detached homes, with no parking minimums and height allowances of 45 feet (up to 75 feet with bonuses).
Archival Google Street View from July 2019 showing the site prior to redevelopment: a modest home surrounded by open grassy land across multiple tax lots. Source: Google Street ViewAerial view of the Strong Family Apartments site pre-redevelopment, with the yellow outline highlighting the approximate assembled 0.96-acre footprint across multiple tax lots. The modest home and open grassy areas were underutilized prior to unification, enabling the shift to highest and best use as 75 family affordable units. Source: Google Maps
In 2019, the Strong family privately sold the property to the Portland Housing Bureau (PHB) for land banking, bypassing any open‑market listing. This acquisition aligned with PHB’s strategy to preserve sites for community‑benefit affordable housing in historically impacted N/NE neighborhoods. The property remained in land bank status until 2024, when City Council Ordinance 191817 authorized transfer of the site to Strong AA Limited Partnership, a private ownership entity formed by Community Development Partners (CDP), the project’s developer, and Self Enhancement, Inc. (SEI), the nonprofit service partner. In this structure, an SEI affiliate serves as the Managing General Partner, a CDP affiliate serves as the Administrative General Partner, and a private tax‑credit investor holds the Limited Partner interest (approximately 99.99%). This arrangement is typical for Low‑Income Housing Tax Credit (LIHTC) developments, the federal program that finances most affordable rental housing in the United States. Under LIHTC, private investors receive a dollar‑for‑dollar reduction in federal tax liability in exchange for investing equity into qualified affordable housing projects, which allows units to rent below market rates. In this structure, the investor provides equity, Community Development Partners oversees development and compliance, and Self Enhancement, Inc. leads resident services and long‑term community engagement.
The project’s financing layers reflect the complexity typical of affordable multifamily development. Approximately $14.2 million came from PHB (including a $11.4 million cash-flow share loan from the 2023 Metro Housing Bond allocation and Interstate Corridor Urban Renewal Area tax-increment financing), supplemented by Portland Clean Energy Fund grants, Oregon Housing and Community Services low-income housing tax credits, and additional contributions. The development remains privately owned and operated, with Guardian Management overseeing leasing and SEI providing resident services. A 99‑year regulatory agreement with PHB mandates long‑term affordability, adherence to the N/NE Preference Policy, and other public‑benefit requirements.
The development delivers 75 rental units across one‑, two‑, and three‑bedroom floor plans, with all rents restricted for households earning 30% or 60% of area median income (AMI). Eleven units are deeply affordable at ≤30% AMI, prioritizing families with the highest need. The table below summarizes the mix and representative rent levels.
Bedrooms
Number of Units
AMI Level
Estimated Rent Range
1 Bedroom
21
≤30% and ≤60% AMI
~$656 (30% AMI 1BR example)
2 Bedroom
32
≤30% and ≤60% AMI
~$1,195–$1,215 (45% AMI 2BR example)
3 Bedroom
22
≤30% and ≤60% AMI
~$905 (30% AMI 3BR example)
Rents are not subsidized (no project‑based vouchers); residents pay the full restricted amount plus electricity, while the landlord covers water and trash. The mix emphasizes family households, with the N/NE Preference Policy prioritizing those displaced from the area.
Amenities include a large central courtyard with a private playground and nature‑inspired play features, indoor bike parking and storage, on‑site laundry, a community room and kitchen, and resident services focused on youth education, employment support, and family stability. The building targets Earth Advantage Platinum certification for energy efficiency, solar readiness, and a tight building envelope.
Central courtyard during final construction, prepped for family playground and nature play features. Photo: Abdur Abdul-Malik (March 2026), Portland Appraisal Blog
Construction began in late 2024 after financing closed in August 2024. Completion is expected in Spring 2026, with leasing to follow. The timeline—from 2019 acquisition through multiple funding layers, permitting, and construction—reflects the typical duration and complexity of affordable multifamily development in Portland.
The CM2 zoning directly supported the site’s highest and best use. Multifamily residential is a primary permitted use on transit‑served corridors, with no parking requirement and incentives for density. Assemblage of the multiple lots into a single 0.96‑acre parcel enabled the scale, layout, and family‑oriented amenities that a single‑family home on fragmented parcels could never achieve.
Portland Maps tax lot overlay showing the multiple original parcels assembled into a single 0.96‑acre unified lot. The combined footprint that enabled density and family amenities. Source: Portland Maps
Humboldt is a compact, vibrant inner North/Northeast Portland neighborhood centered around the Alberta–Williams corridor. With a Walk Score of 89 (“Very Walkable”) and a Bike Score of 100 (“Biker’s Paradise”), most daily needs can be met on foot or by bike, supported by a Transit Score of 53 and frequent bus service along N Williams, N Vancouver, and N Killingsworth, plus proximity to the MAX Yellow Line. The area blends long‑standing community roots with ongoing revitalization, anchored by the Alberta Arts District’s murals, galleries, indie shops, cafés, restaurants, and the long‑running Last Thursday street events.
Education and youth resources form a strong neighborhood backbone. Jefferson High School—with its full‑size football field, track, and community programming—sits within Humboldt boundaries and is walkable or bikeable from the Strong site. Nearby KairosPDX, a public charter school focused on culturally responsive education, and Portland Community College Cascade, just north of the neighborhood, add depth through early‑learning programs, K–8 support, and college‑level career and transfer pathways. Together, these institutions reinforce the project’s family‑oriented design and align with the N/NE Preference Policy’s emphasis on retaining generational ties for households with a historical connection to the area.
Jefferson High School in the Humboldt neighborhood, shown with its athletic fields and campus layout as seen in Google Earth. The school sits within walking and biking distance of the Strong Family Apartments. Source: Google MapsKairosPDX, a public charter school in Humboldt, serves as a key family and education resource. Its proximity to the Strong Family Apartments supports the project’s family‑oriented design and 54 two‑ and three‑bedroom units, providing walkable access for residents with children. Photo: Abdur Abdul-Malik (March 2026), Portland Appraisal Blog
Employment access is unusually strong for a neighborhood‑scale project. The WorkSource Oregon center (State of Oregon Employment Department Portland Metro office) sits directly across N Williams Avenue from the Strong site. The facility provides job search assistance, training referrals, career counseling, unemployment support, and connections to workforce programs—resources that complement SEI’s on‑site youth and employment services and enhance the project’s location externalities for income‑restricted families.
WorkSource Oregon center (State of Oregon Employment Department facility) directly across N Williams Avenue from the Strong Family Apartments site. This proximity to state‑supported job search, training, and employment resources enhances location externalities for residents, particularly families prioritized under the N/NE Preference Policy. Photo: Abdur Abdul-Malik (March 2026), Portland Appraisal Blog
Grocery access is a modest tradeoff. Unlike some recent Portland affordable developments with immediate adjacency to major grocers (e.g., Trader Joe’s at HollywoodHUB or Safeway at Barbur Apartments), Humboldt lacks a full‑service chain supermarket within its boundaries or within a short walk of the Strong site. The nearest practical options are New Seasons Market on N Williams Avenue (~0.8 miles south, 15–20 minute walk or 5-minute bike ride along protected lanes) and Safeway (~0.8 miles northeast). Delivery services (Instacart, New Seasons own platform, etc.) are widely available, and insulated bags, cargo bikes, or e-assist options mitigate summer heat or load-carrying challenges. The Safeway route involves crossing the major arterial NE Martin Luther King Jr Blvd, making it less preferable for walking. This pattern aligns with the corridor’s multimodal design and the project’s minimal parking program (15 EV-ready shared spaces).
The neighborhood reflects a long history of community change, with significant gentrification pressures, a high renter share (49% per the City of Portland’s 2023 neighborhood demographic profile), and rising ownership costs. These dynamics underscore the importance of restricted affordable family housing in a corridor where market‑rate ownership has become increasingly out of reach for moderate‑income households.
Labeled aerial map (Google Maps) of the Strong Family Apartments site (red pin) and surrounding Humboldt neighborhood amenities. Key resources include WorkSource Oregon, Jefferson High School, KairosPDX, and Portland Community College Cascade—all within a short walk or bike ride. This cluster strengthens the project’s location advantages for income‑restricted families. Source: Google Maps
Data & Analysis — Humboldt’s Owned Market in Contrast
Understanding the context for the Strong Family Apartments requires examining Humboldt’s recent open‑market ownership landscape. This analysis uses RMLS data for 1–3 bedroom SFR‑class transactions (detached, condo, and attached) from 2024 through year‑to‑date 2026—the period that best reflects current market conditions. All figures represent descriptive statistics from the full set of qualifying sales; no sampling or modeling is involved.
The Portland Appraisal Blog Affordability Index (PABAI) measures how the average home close price compares to what a household at a given income level can qualify for under standard lending assumptions (HUD median MSA income, 20% down payment, and a 28% debt‑to‑income ratio for principal, interest, taxes, and insurance). A PABAI of 100 means the market is exactly affordable at that income level (current HUD median MSA income is $124,100 for a family of four in the Portland metro area) . Values above 100 indicate excess qualifying capacity (more affordable), while values below 100 indicate a shortfall (strained affordability). Full methodology and the interpretation scale are available on the PABAI explainer page.
PABAI Range
Interpretation
120+
Strongly Affordable
100–119
Moderately Affordable
80–99
Strained
Below 80
Severely Constrained
The PABAI is recalibrated here to a 60% AMI benchmark ($74,460 maximum income for a four‑person household), aligning with the majority of Strong’s units.
Humboldt 1–3 Bedroom Sales by Property Type (60% AMI Benchmark)
Property Type
Avg Beds
Avg Close Price
Avg PABAI (60% AMI)
Affordable Sales (out of total)
Detached
2.74
$533,738
55.20
0 / 38
Condo
1.98
$387,939
70.28
1 / 49*
Attached
2.57
$488,357
56.97
0 / 7
*Note: Including 0‑bedroom studio condos (outside the 1–3 bedroom focus) adds two additional qualifying sales, bringing the total to three affordable transactions across the full condo dataset. All three were small 0–1 bedroom units (381–510 SF, no garages, prices $165,000–$237,999). No qualifying sales occurred in any 2–3 bedroom units across any property type.
Detached Homes: The Traditional Family Segment
Detached homes—typically older (average build year 1940), larger (1,933 SF average), and more likely to include garages (0.61 average spaces)—represent the traditional family‑oriented housing stock most comparable to Strong’s 2–3 bedroom units. In this segment, the PABAI falls to a severely constrained 55.20, with zero of the 38 transactions qualifying as affordable for a 60% AMI household. This reflects the substantial income gap required to purchase family‑sized homes in Humboldt under standard qualification criteria.
Condos: Relatively Less Constrained, but Not for Families
Newer condos (average build year 2010, 1,006 SF average, minimal garage access) show a higher average PABAI of 70.28, indicating somewhat less affordability pressure relative to detached homes. However, the coverage is extremely limited: only one qualifying sale in the 1–3 bedroom range, plus two additional qualifying studio units when the dataset is expanded. All three affordable transactions were 0–1 bedroom units—none were family‑sized.
Attached Homes: Low Volume, Same Constraints
The attached segment contains only seven transactions, which reflects the full universe of attached 1–3 bedroom sales in Humboldt during this period. While the volume is low, these are all open‑market transactions, and the affordability pattern mirrors the broader constraints seen in the detached and condo segments. The average PABAI of 56.97 and zero qualifying sales reinforce the limited feasibility of ownership for 60% AMI households in this format.
Affordability Coverage and Market Implications
Across the full set of 94 open‑market 1–3 bedroom transactions in Humboldt, only one sale qualified as affordable at the 60% AMI benchmark—a coverage rate of 1.06%. Expanding the dataset to include studio condos increases the total to 96 transactions and three qualifying sales, raising the coverage rate to roughly 3%. All three affordable units were 0–1 bedroom condos; none were in the 2–3 bedroom range that aligns with Strong’s 54 family‑sized units. This pattern highlights a structural mismatch between Humboldt’s ownership inventory and the needs of 60% AMI households. Family‑sized homes—whether detached, attached, or larger condos—are effectively absent from the affordable ownership landscape, and even the most attainable options are limited to small, entry‑level condos. In this context, the Strong Family Apartments fill a critical gap by providing long‑term, income‑restricted, family‑oriented housing in a corridor where market‑rate ownership has become unattainable for moderate‑income households.
Plottage, Highest and Best Use, and Long‑Term Stability
Plottage and Assemblage Value
The site’s primary value driver is plottage—the incremental value created by combining multiple smaller tax lots into a single unified 0.96‑acre parcel. Prior to redevelopment, the Strong family’s holdings consisted of several fragmented lots occupied by a modest single‑family home and large areas of open grass, a clear underutilization in CM2 zoning, which is intended for medium‑scale mixed‑use and multifamily development along transit corridors.
Assemblage into one unified tax lot unlocked the development potential that individual parcels could not support. The combined footprint enabled a 75‑unit building with a central courtyard, family‑oriented amenities, on‑site services, and efficient circulation—elements that would have been infeasible or uneconomic on scattered lots. This is a textbook example of how public‑private coordination (PHB land banking and subsequent transfer) and zoning incentives (no parking minimums, height and floor-area ratio allowances) convert fragmented, low‑intensity land into a higher and better use.
Highest and Best Use Shift
Before redevelopment, the site’s highest and best use was not continued single‑family residential. While CM2 permits residential uses, the zone’s intent and incentives clearly favor denser multifamily or mixed‑use development on corridors like N Williams Avenue. Maintaining a single‑family home on nearly one acre represented a substantial underutilization of land value in an area with strong multimodal access and ongoing reinvestment.
The realized use—75 income‑restricted family units with courtyard amenities, bike parking, and resident services—aligns directly with CM2’s purpose. The project maximizes allowable density while securing long‑term affordability through a 99‑year regulatory agreement with PHB. The shift from low‑intensity residential to medium‑scale multifamily was made possible by assemblage, zoning compliance, and layered public financing.
Location Externalities
The Alberta/Williams corridor provides unusually strong positive externalities for income‑restricted households. WorkSource Oregon sits directly across N Williams Avenue, offering employment services, training referrals, and career support. Jefferson High School, KairosPDX, and PCC Cascade are all within a short walk or bike ride, creating a cluster of educational and youth‑focused resources. The corridor’s multimodal strengths—protected bike lanes, frequent transit, and walkable amenities—reinforce the project’s feasibility and support absorption for the target demographic.
Income Growth Retention and Long‑Term Stability
A defining feature of the project is tenant stability. Under federal LIHTC rules (the Next Available Unit Rule), households are not required to move out if their income rises after initial qualification. The 99‑year PHB regulatory agreement further ensures long‑term affordability, compliance, and adherence to the N/NE Preference Policy.
This structure supports upward mobility without displacement, stabilizes families over time, and aligns with anti‑displacement goals in N/NE Portland. By allowing residents to remain as their incomes grow, the project promotes continuity rather than churn—an important distinction in a corridor where market‑rate rents and ownership costs have escalated beyond reach for many moderate‑income households.
Takeaways
The Strong Family Apartments illustrate how targeted redevelopment can convert long‑term underutilization into meaningful community benefit. Through assemblage of multiple tax lots into a unified 0.96‑acre parcel, the site shifted from a modest single‑family home with expansive open space to a 75‑unit, family‑oriented affordable multifamily community. The project prioritizes the N/NE Preference Policy and incorporates a central courtyard, playground space, and SEI‑led youth, employment, and family‑stability services.
From an appraisal perspective, the development underscores the role of plottage in unlocking highest and best use. Combining fragmented parcels enabled the scale, density, and site planning required for medium‑scale multifamily in CM2 zoning, where incentives favor transit‑supported housing over low‑intensity residential. The result is a long‑term community asset serving moderate‑income families in a corridor where market‑rate ownership remains unattainable for many.
Long‑term stability is reinforced through the 99‑year affordability covenant and LIHTC’s income‑growth retention rules, which allow households to remain in place as earnings rise. This structure supports upward mobility without displacement and aligns with anti‑displacement goals in N/NE Portland.
In a neighborhood shaped by historical and ongoing pressures on housing access, the Strong Family Apartments demonstrate how zoning, public‑private coordination, and intentional design can preserve community ties while delivering durable affordability.
The Portland Appraisal Blog Affordability Index: PABAI
Thanks for reading—I hope you found a useful insight or an unexpected nugget along the way. If you enjoyed the post, please consider subscribing for future updates.
CODA
Are you an agent in Portland who wonders why appraisers always do “x”?
A homeowner with questions about appraiser methodology?
If so, feel free to reach out—I enjoy connecting with market participants across Portland and the surrounding counties, and am always happy to help where I can.
And if you’re in need of appraisal services in Portland or anywhere in the Portland Region, we’d be glad to assist.
In 2025, Portland Region manufactured homes on owned land rebounded with 315 sales (+14.13%), $148.4M volume (+16.25%), average price $471,014 (+1.86%), and median $435,000 (+3.82%). Rural counties dominated, land value drove stability, and PABAI ranked it the second-most affordable housing segment (111.67).
The Portland White Stag sign. Photo: Abdur Abdul-Malik, Portland Appraisal Blog
The manufactured‑home market in 2025 moved through a year defined by steadier demand, uneven inventory, and a noticeable shift in how long homes took to find the right buyer in some counties. Manufactured homes remain the second most affordable ownership segment in the Portland Region, right after condominiums. Yet the contrast between the two couldn’t be more stark: a condominium typically offers an apartment in an urban core with monthly dues and shared maintenance, while a manufactured home often delivers acreage in rural or pastoral settings—sometimes in remote locales.
Across the Portland Region, roughly 21,400 homes sold in 2025 across the four major residential segments. Manufactured homes accounted for less than 1.5% of that activity, but they continued to play a meaningful role in the market—often representing one of the few affordable paths to owning acreage.
The Portland Region in this update comprises the six Oregon counties of Columbia, Clackamas, Hood River, Multnomah, Washington, and Yamhill. These counties form a contiguous housing ecosystem centered on Portland—Multnomah as the core home county, with the others tightly integrated through commuting patterns, economic ties, and shared market dynamics (e.g., Yamhill’s strong connection via Highway 99W and wine-country adjacency). Beyond Yamhill, the MLS system changes, further distinguishing this six-county area from broader geographic aggregations. For a detailed overview—including county profiles, population data, key value influencers, and why this definition differs from the official seven-county Portland–Vancouver–Hillsboro MSA—see our dedicated page: The Portland Region – Six-County Market Area Overview.
All data is sourced from RMLS and reflects open-market manufactured residential sales (excluding condominiums, attached homes, and site-built detached homes). SNL (“Sold Not Listed”) entries—off-market transactions entered retroactively—have been excluded to preserve consistency with true market activity.
All figures have undergone our standard cleaning process to address common RMLS accuracy challenges, including misclassifications (e.g. manufactured homes hiding in other categories, such as the detached category), square footage/price typos, incomplete fields, status/date mismatches, and non-representative entries. For a detailed overview of these issues, their impact on market analysis, and how we mitigate them through automated flagging, cross-verification, and manual review, see the dedicated page: RMLS Data Accuracy Challenges.
It is important to note that this review focuses on manufactured homes permanently affixed to land that is also owned by the same party. This means we are excluding classic mobile home parks where the owner of the mobile home must pay a lease/lot rental fee.
Portland Region 2025 Overview
Overall Regional Trends
The table below summarizes key metrics for attached single-family manufactured residential sales in the Portland Region (Columbia, Clackamas, Hood River, Multnomah, Washington, and Yamhill counties) for 2025 compared with 2024.
Category
2024
2025
% Change
Total $ Volume
$127.6 Million
$148.4 Million
+16.25%
Average Price
$462,411
$471,014
+1.86%
Median Price
$419,000
$435,000
+3.82%
Avg SP/OLP
96.69%
96.14%
-0.57%
Avg PPSF (TSF)
$295.71
$299.03
+1.12%
Avg HOA Dues
$74.61
$72.60
-2.69%
Avg Lot Size (ac)
3.48
3.44
-1.15%
Avg Age (Yrs)
28.20
30.50
+8.14%
Avg CDOM
60.55
61.03
+0.79%
Avg Total SF
1,609
1,629
+1.24%
Total # of Sales
276
315
+14.13%
# of New Constr.
3
4
+33.33%
Avg Supply (Mos.)
4.34
4.09
-5.75%
# of REOs
7
4
-42.86%
# of Short Sales
0
0
—
Note: The calculated average HOA dues is for units reporting HOA dues (27 sales for 2025). All other metrics use the full dataset (315 sales for 2025). Single-Family Manufactured Residential | 2024 & 2025 Data: RMLS | PortlandAppraisalBlog.com
Key Observations From the Aggregate Data
Manufactured homes posted the strongest price gains of the four major housing segments, with both the average and median rising more than any other category in 2025. What makes this notable is that the segment didn’t rely on a shift toward larger homes or larger parcels; the underlying composition stayed remarkably stable, which means the appreciation reflects genuine demand strength rather than mix effects.
Sales activity expanded sharply, marking one of the largest year‑over‑year increases in the region. The rise in closed sales outpaced the modest changes in size, acreage, and days on market, signaling that more buyers were willing to engage with the segment even as inventory remained thin and the stock continued to age. This represented a return to form as 2023 had 310 sales and 2025 closed 5 additional sales.
County‑level performance was uneven but ultimately supportive of regional growth. Washington, Multnomah, and Hood River delivered clear price strength, each contributing meaningful upward pressure to the regional averages. Clackamas—by far the largest county by sales count—did not appreciate, but it held close to parity with 2024, providing the stability needed for the stronger counties to carry the region forward.
The segment’s physical profile barely changed, with total square footage and acreage holding near 2024 levels and the average home age increasing. In most years, an older stock profile would exert downward pressure on pricing; the fact that prices rose anyway reinforces that the appreciation was demand‑driven rather than structural.
Negotiation patterns and market pace remained steady, with only slight softening in sale‑to‑list ratios and days on market. Buyers were selective, but not disengaged; well‑prepared homes in desirable settings continued to attract firm pricing, while more remote or older properties required patience without signaling a broader slowdown.
Distressed activity stayed low, continuing a multi‑year trend of stability in the manufactured‑home segment. Even with an aging stock and a wide range of property conditions, bank‑owned and short‑sale activity remained minimal, underscoring the segment’s resilience.
Portland Region Scatter Plots
To visualize the distribution of individual manufactured homes sales prices across 2025, the following scatter plots show sales price against date of sale:
The 2025 sales‑price‑versus‑date scatter shows a remarkably steady rhythm for a segment as small and diverse as manufactured homes. Instead of the sharp seasonal swings that often appear in niche markets, the year unfolds as a consistent band of activity, with sales distributed evenly across all twelve months and no visible collapse in the early winter or late fall. The mid‑range of the market remains especially stable, forming a dense horizontal band that anchors the chart and reflects a year in which buyers and sellers were able to find agreement without dramatic shifts in pricing.
A subtle compression appears from late summer through the end of the year, with fewer low‑end outliers and a tighter clustering around the middle of the price distribution. This narrowing is not a sign of weakening; rather, it reflects a firmer pricing floor and a more consistent mix of properties entering the market in the second half of the year. The upper end of the market continues to register throughout this period, with several higher‑priced sales in the fall and early winter preventing the trendline from flattening and reinforcing the sense of a market that remained confident even as the year wound down.
Taken together, the scatter presents a picture of a segment that moved with calm, steady momentum. The absence of volatility, the persistence of a stable mid‑band, the tightening of the lower range, and the presence of late‑year upper‑band sales all point to a market supported by genuine demand rather than mix‑driven noise. The regional pattern is coherent and balanced, and the underlying county‑level dynamics that shaped this composite view become even clearer when examined individually in the latter sections.
To visualize three important variables at one, the following scatter plot shows sales price versus total square footage with each dot sized by acreage (lot size):
The 2025 size‑based scatter shows a manufactured‑home market that organized itself with unusual clarity. Across the full range of square footage, the points form a coherent upward pattern: larger homes generally commanded higher prices, and the relationship holds consistently enough that the trendline is visible even without drawing it. This is not always the case in the MFH segment, where condition, setting, and acreage can create wide vertical dispersion. In 2025, the market behaved with a steadiness that mirrors the tempo seen in the sales‑price‑vs‑date-of-sale scatter.
Acreage adds a second layer of structure. Larger parcels appear as noticeably larger bubbles, and they tend to sit above the main body of the scatter. This is the classic manufactured‑home dynamic: land can elevate a property well beyond what its square footage alone would suggest. But the acreage premium shows up in a controlled, predictable way. The largest bubbles cluster in the upper half of the chart, but they do not distort the overall shape. Instead, they reinforce the idea that land remains a meaningful value driver without overwhelming the distribution.
The middle of the market—roughly 1,200 to 1,800 square feet and $300K to $600K—forms a dense, stable band that anchors the entire chart. This is where most of the region’s manufactured‑home stock lives, and the consistency of this band supports the conclusion that 2025 was a balanced, demand‑supported year. There is no hollowing out, no thinning, and no sign of a collapsing floor. The lower band remains present across the full range of square footage, but it does not expand downward or show distress. Older homes, modest parcels, and properties needing work appear where expected, but they do not dominate the distribution.
One of the more interesting features of the scatter is the presence of larger parcels at lower price points. Several sizable bubbles sit below the main trendline, showing that an eagle‑eyed and patient buyer can still acquire meaningful acreage at a reasonable price—especially when the home is older, dated, or in need of repair. This is a uniquely manufactured‑home phenomenon and one of the few remaining pathways to acreage ownership at accessible price levels.
A closer look at the three largest‑SF outliers: Three points sit well to the right of the main cluster. Yes, there are three, one is on a small lot and is nearly invisible! These three sales are the largest homes in the dataset and each has a clear, logical explanation once examined:
A 42.62‑acre North Plains fixer (cash) sits far below the trendline because the home contributed little value and the buyer was effectively purchasing the land. Its position reflects a classic land‑first MFH transaction.
A 0.64‑acre Multnomah sale (FHA) is nearly invisible on the scatter plot. The home is 4,495 SF and was designed for high‑occupancy use, with seven bedrooms, three bathrooms, dual entrances, and a layout suitable for care‑facility, sober‑living, or multigenerational configurations. Despite its size, the home sits on just over half an acre and sold with FHA financing. Its position on the scatter reflects the market’s tendency to discount institutional or cash‑flow‑oriented layouts, which offer utility but do not command the same price premium as conventional single‑family square footage.
A 2.5‑acre cash sale falls between the other two. This home is 4,385‑SF and combines a 2004 manufactured home with a 2006 stick‑built addition, creating a dual‑living layout. The home sold for cash and includes a barn, shop, multiple utility rooms, and extensive outdoor improvements. Its position on the scatter reflects the market’s tendency to discount unconventional or hybrid layouts, even when the overall utility and acreage are significant.
Bottom-line Summary
Taken together, the aggregate tables and the two regional scatter plots point to a manufactured‑home market that moved with steady, internally consistent momentum throughout 2025. Sales volume was up and prices held firm across the full range of the segment, with a stable mid‑band anchoring the year and no evidence of a collapsing floor or late‑year volatility. The sales‑price‑versus‑date scatter shows a smooth seasonal rhythm with a mild tightening in the second half of the year, while the size‑and‑acreage scatter reveals a market that valued square footage and land in predictable ways, even as it produced the occasional outlier that is characteristic of this segment.
The overall picture is one of broad‑based stability: genuine demand, a coherent price structure, and a distribution shaped more by steady buyer behavior than by mix shifts or one‑off anomalies. The county‑level sections that follow show how each sub‑market contributed to this regional pattern, and why the composite view looks as orderly as it does. But before we examine the individual counties let’s consider a variety of graphs to illuminate the regional data.
Sales Volume
A treemap visualizing the distribution of manufactured homes sales by county in 2025 clearly illustrates the market’s geographic dispersion in this housing segment.
Manufactured‑home activity in 2025 followed a geographic pattern that is completely different from every other housing segment in the Portland region. In detached, attached, and condominium housing, the Big Three counties—Clackamas, Washington, and Multnomah—account for 90% to 99% of all sales. Manufactured homes break that rule entirely. The outlying counties carry a disproportionate share of the activity, and the market’s center of gravity shifts decisively away from the urban core.
Clackamas led the region with 128 sales, forming the largest block of activity and anchoring the year’s volume. But the next‑largest contributor was not Washington or Multnomah—it was Yamhill, with 69 sales. Columbia followed with 44, and only then do Washington (37) and Multnomah (22) appear. Hood River, with 15 sales, rounded out the region. This distribution is not an anomaly; it reflects the structural reality of the segment. Manufactured homes are more common in rural and semi‑rural settings, where larger parcels, lower land costs, and flexible siting options support a broader range of housing stock.
Year‑over‑year changes reinforce the same pattern:
Clackamas and Yamhill both posted meaningful increases in 2025, Hood River grew from a small base, Columbia softened slightly, and Washington and Multnomah held steady. The uneven movement across counties is another way this segment diverges from the rest of the housing market, where the Big Three typically move in near‑unison and dominate the regional totals.
Despite the differences in scale, no county experienced a collapse in activity, and the overall regional volume increased from the prior year. This stability in the volume distribution is one of the reasons the 2025 scatter plots appear so orderly: the market was active, balanced, and supported by steady buyer participation across all twelve months.
This volume structure sets the stage for the analyses that follow. The counties with the largest footprints shape the regional trendlines, while the smaller counties introduce the nuances, acreage dynamics, and outliers that give the manufactured‑home segment its distinctive character.
The following bar chart shows monthly sales volume for 2025:
The 2025 manufactured‑home market followed a classic seasonal pattern, with a slow winter start, a strong spring buildup, and a broad summer plateau that carried through early fall. January, February, and March posted modest activity, each in the mid‑teens to high‑teens, which is typical for this segment and reflects both weather constraints and the slower pace of rural and semi‑rural transactions. Activity accelerated sharply in April and peaked in May at 39 sales—the high point of the year and the moment when all counties were contributing meaningful volume.
The summer months held that momentum. June, July, August, September, and October all posted between 27 and 37 sales, forming a stable mid‑year band that kept the regional scatter plots well‑populated and prevented the kind of thin‑data volatility that can appear in smaller segments. This broad plateau is one of the reasons the 2025 price‑versus‑date scatter reads as smooth and orderly: the market had consistent participation across the warm months.
Volume tapered in November and December, returning to the high‑teens and low‑twenties. This decline mirrors the seasonal slowdown seen in detached and attached housing, but the manufactured‑home segment tends to soften a bit earlier and more noticeably because rural and acreage‑oriented transactions are more sensitive to weather, daylight, and site‑access conditions.
The line graph below compares monthly sales volume across the twelve months for 2024 and 2025.
The month‑by‑month comparison shows that 2025 was not just a stronger year in total volume—it was a more consistent and better‑balanced year across the calendar. Both years start in the mid‑teens, but the paths diverge quickly. In 2024, activity rose unevenly, with a strong March and June, a soft late summer, and a pronounced spike in October. By contrast, 2025 followed a smoother seasonal arc: a slow winter, a clear spring buildup, and a broad summer plateau that carried through early fall.
Several months illustrate this shift clearly. April and May 2025 were substantially stronger than the prior year, with May reaching 39 sales—nearly double the 2024 figure. August and September also outperformed their 2024 counterparts, reinforcing the sense of steady mid‑year demand. Even the late‑year slowdown behaved differently. While both years tapered in November and December, 2025 maintained higher activity, avoiding the sharp drop seen in December 2024.
Sales Price
The following bar chart shows average monthly sales price for 2025:
Note: The y-axis starts at $300,000 to allow better examination of monthly differences.
Average prices in 2025 followed a smooth, well‑behaved seasonal arc that reflects a stable, demand‑supported manufactured‑home market. The year opened softly at $396K in January, which is typical for this segment given winter weather, rural access constraints, and limited buyer activity. Prices rose sharply in February to $496K and settled into the mid‑$400Ks through March, establishing the early‑spring lift that carried into the main selling season.
From April through August, the market held a steady mid‑year plateau. Monthly averages ranged from the high‑$460Ks to just over $500K, with June and July tied for the year’s peak at $505K. This consistency mirrors the strong mid‑year sales volume and is one of the reasons the price‑versus‑date scatter appears so orderly. The market had enough activity—and enough diversity of properties—to produce a stable pricing band without the volatility that can appear in smaller or more rural datasets.
Prices eased gently in September and October, returning to the mid‑$400Ks, but the decline was modest and short‑lived. November held firm at $446K, and December closed the year strongly at $483K, reversing the fall softness and signaling that buyer willingness remained intact even as the seasonal slowdown set in.
The line graph below compares average monthly sales prices across the twelve months for 2024 and 2025.
The year‑over‑year comparison shows two very different pricing rhythms. 2024 moved with sharper swings, including a pronounced April spike and a steep December drop, while 2025 followed a smoother, more stable seasonal arc with a firm close to the year. The contrast between the two lines reinforces the broader theme of 2025 as a steadier, more demand‑supported market.
Several months illustrate the divergence clearly. January and February opened with a reversal of roles: 2024 began higher in January, but 2025 surged ahead in February with a jump to $496K. Through spring, the two years traded places—2024 peaked at $522K in April, while 2025 held a more moderate but consistent mid‑$400K to mid‑$500K range. By early summer, 2025 had clearly taken the lead, with June and July both landing just above $500K, compared to mid‑$400Ks in 2024.
The late‑summer and early‑fall months show the same pattern. August and September were tighter between the two years, but 2025 maintained a slight edge. October and November flipped again, with 2024 briefly rising above 2025, but the difference was modest and short‑lived. The most striking contrast appears in December: 2025 closed at $482,952, while 2024 fell to $394,887, its lowest point of the year. That strong finish in 2025 reinforces the stability seen in the scatter plots and confirms that the market ended the year with pricing confidence rather than seasonal weakness.
Across the full calendar, 2025 shows a smoother, more coherent price structure, with fewer abrupt shifts and a stronger mid‑year plateau. The 2024 line, by comparison, reflects a more volatile pattern shaped by mix, timing, and thinner winter volume.
Cumulative Days on Market
The bar chart below compares average cumulative days on market (CDOM) throughout 2025.
Cumulative Days on Market in 2025 followed a seasonal pattern that is typical for the manufactured‑home segment, but with enough mid‑year stability to reinforce the broader theme of a steady, demand‑supported market. January opened at 74 days—elevated but not unusual for winter, when rural access, weather, and buyer activity all slow. February spiked to 123 days, the highest point of the year, driven by a small number of older listings finally clearing. This kind of early‑year cleanup is common in this segment and does not indicate weakening demand.
From March through October, the market settled into a remarkably consistent mid‑year band. CDOM ranged from the mid‑40s to mid‑60s, with March at 45 days, April at 50, and May at 46. Even as volume increased in the spring and summer, marketing times remained stable, suggesting that buyers were active and well‑matched to available inventory. The summer months—June through August—held between 55 and 63 days, and September and October stayed in the mid‑50s to mid‑60s. This eight‑month stretch of steady CDOM is one of the clearest indicators that the 2025 market was functioning smoothly.
The bar chart below compares cumulative days on market for 2024 and 2025.
The year‑over‑year comparison shows that while the shape of CDOM changed noticeably between 2024 and 2025, the overall level barely moved. The annual averages were 60.55 days in 2024 and 61.03 days in 2025—a difference of less than half a day. In a small segment like manufactured homes, this is exactly what you expect: the monthly pattern can shift dramatically depending on which slow listings clear when, but the underlying market tempo remains stable.
The month‑to‑month behavior is where the two years diverge. Early 2025 opened with elevated winter CDOM—74 days in January and 123 in February—driven by a handful of older listings finally closing out. In contrast, 2024 began unusually low before rising into the 80–90‑day range. Spring flipped the pattern again: 2025 settled quickly into the mid‑40s to mid‑50s, while 2024 spiked to 97 days in April. Summer showed the same contrast, with 2025 holding steady in the mid‑50s to low‑60s and 2024 swinging from the low‑30s in June and July to 104 days in August.
Despite these very different seasonal shapes, both years ultimately lived in the same CDOM neighborhood. Neither year shows evidence of systemic softening, prolonged marketing times, or inventory backing up. Even the late‑year divergence—2024 ending at 100 days versus 84 in 2025—reflects timing and mix rather than a structural shift in demand. Manufactured‑home markets often show sharper winter variability due to rural access, weather, and financing logistics, and both years behaved within that normal envelope.
The key takeaway is that 2025 wasn’t meaningfully “faster” or “slower” than 2024. It was simply smoother. The mid‑year band in 2025 was more stable, the volatility was lower, and the seasonal rhythm was more predictable. The nearly identical annual averages underscore that the manufactured‑home market maintained a consistent, balanced tempo across both years.
Housing Supply
Months of supply (MOS) represents the number of months it would take to absorb current active inventory at the prevailing sales pace, assuming no new listings enter the market. The following bar chart shows MOS by calendar month for 2025:
Months of Housing Supply in 2025 moved through a clean, seasonal arc that mirrors the stability seen in pricing, volume, and CDOM. The year opened with elevated winter supply—4.88 months in January and 6.00 months in February—a normal pattern for manufactured homes, where rural access, weather, and slower buyer activity tend to stretch inventory relative to sales. From there, supply tightened quickly as spring demand arrived. March dropped to 5.39 months, and April fell sharply to 3.34 months, setting up the strongest stretch of the year.
The core of the market—May through October—held a remarkably stable band between roughly 2.8 and 4.1 months. May posted the year’s low at 2.82 months, reflecting strong absorption and a well‑matched buyer pool. June and July rose modestly into the 3.9–4.1 range, and August through October settled into a tight cluster between 3.09 and 3.27 months. This six‑month plateau is one of the clearest indicators that the 2025 manufactured‑home market was balanced and functioning smoothly. Supply was neither constrained nor excessive; it simply tracked demand in a predictable, orderly way.
The late‑year rise—4.38 months in November and 4.67 months in December—is exactly what you expect in this segment. Manufactured homes often see sharper winter slowdowns due to siting logistics, inspections, and financing timelines, and 2025 behaved squarely within that normal envelope. Importantly, even the year‑end levels remained moderate. There was no sign of inventory backing up or buyers stepping away.
The line graph below compares months of supply for 2024 (blue line) and 2025 (red line), with a full y-axis scale to show true proportional differences:
The year‑over‑year comparison shows that while the month‑to‑month pattern of housing supply shifted noticeably between 2024 and 2025, the overall level of inventory remained almost identical. The annual averages were 4.34 months in 2024 and 4.09 months in 2025, a difference of just a quarter of a month. In a small segment like manufactured homes—where a handful of listings can swing a single month—this near‑match in annual supply is expected. What changed was the seasonal shape, not the underlying balance between listings and sales.
The two years diverged early. January and February 2025 opened with 4.88 and 6.00 months of supply, while 2024 began slightly lower at 5.06 and 4.94. By March, the pattern flipped: 2025 eased to 5.39 months, while 2024 tightened sharply to 3.35. Spring continued the alternating rhythm. April and May 2025 dropped to 3.34 and 2.82 months, reflecting strong absorption, while 2024 rose to 4.33 and 4.62. Summer followed the same back‑and‑forth dynamic. June and July 2025 held at 3.90 and 4.11 months, compared to 2.85 and 3.20 in 2024, before August reversed the relationship again with 3.22 months in 2025 versus 4.61 in 2024. Through early fall, 2025 held a tight, stable band between 3.09 and 3.27 months, while 2024 ranged from 3.62 down to 2.45.
The most dramatic difference appears in December. Supply spiked to 8.30 months in 2024, the highest point across both years, while December 2025 closed at 4.67 months, elevated but still within a normal seasonal range. This single month accounts for much of the visual gap between the two lines and reflects timing and mix rather than a structural imbalance.
Despite the month‑to‑month volatility, both years lived in the same overall supply environment. Neither shows evidence of inventory backing up or buyers stepping away. The mid‑year plateau in 2025—roughly three to four months of supply from May through October—reinforces the broader theme of a balanced, well‑functioning market. The 2024 line, by contrast, is more jagged, shaped by thinner volume and a few months where slower listings accumulated. The nearly identical annual averages—4.34 vs. 4.09 months—underscore that the manufactured‑home market maintained a consistent, stable supply profile across both years, even as the monthly curves took different paths.
Histograms
Histograms offer a unique and powerful perspective on the manufactured homes market that traditional summary statistics and bar charts cannot fully capture: they reveal the underlying shape, spread, and clustering of the data, exposing patterns, skewness, tails, and bifurcations that averages and medians alone obscure.
The following histogram shows the distribution of sales price as a percentage of original list price in 2025:
The distribution of sale‑to‑list ratios in 2025 shows a market that centered tightly around full price, with most transactions occurring in a narrow band and only light activity at the extremes. The single largest bin—97.5% to 99.9%—contains 82 sales (26.03%), and the surrounding bins at 95.0%–97.4%, 100.0%–102.4%, and 102.5%–104.9% add another substantial block of activity. Once aggregated, the full 95% to <105% band contains 192 sales, representing 60.95% of all transactions. This is the clearest signal in the dataset: the manufactured‑home market in 2025 rewarded accurate pricing with highly predictable outcomes, and most homes sold within just a few percentage points of their original list price.
Below‑list activity was present but modest. All bins under 90% of list total 60 sales (19.05%), spread thinly across many small ranges. No single low‑ratio bin dominates, and the counts taper quickly as ratios fall. These cases likely reflect idiosyncratic situations—condition issues, location constraints, or listings that began overpriced and required significant repositioning—rather than a structural pattern of deep discounting.
The upper tail behaves similarly. At 105% or above, the combined bins total 23 sales (7.3%), with each individual range containing only a handful of transactions. These are the occasional competitive situations where buyers stretched above list—clean acreage, desirable settings, or well‑prepared homes—but they remain the exception rather than the rule.
Taken together, the histogram shows a market with a very stable pricing center and only light activity at the extremes. The dominant pattern is straightforward: nearly two‑thirds of all manufactured‑home sales closed within 5% of the original list price, and the remaining third is split between modest under‑list adjustments and a small number of above‑list outcomes. The distribution reinforces the broader theme of the 2025 manufactured‑home market—steady demand, accurate pricing, and predictable negotiation dynamics.
The following histogram shows the distribution of sales prices of manufactured homes in 2025:
The 2025 sales‑price histogram shows a market with a clear middle, a long but orderly tail, and no distortive spikes—exactly what you want to see in a manufactured‑home dataset of this size. The distribution builds gradually from the low end, peaks cleanly in the mid‑price ranges, and then tapers in a predictable pattern as prices rise.
The lower bins are thin, with 5 sales (1.59%) in the $100K–$149K range and 6 sales (1.90%) in the $150K–$199K range. Activity begins to take shape in the $200K–$249K and $250K–$299K bins, which together account for 29 sales (9.21%). But the market doesn’t truly concentrate until the $300Ks and $400Ks, where the core of the distribution sits. The $300K–$349K bin contains 29 sales (9.21%), and the $350K–$399K and $400K–$449K bins contain 49 (15.56%) and 48 (15.24%) sales respectively. These two adjacent bins form the single largest block in the histogram, representing more than 30% of all 2025 manufactured‑home sales. This is the pricing center of gravity for the year.
Above that, the distribution steps down gradually. The $450K–$499K bin holds 29 sales (9.21%), and the $500K–$549K and $550K–$599K bins add another 24 (7.62%) and 20 (6.35%) sales. The $600K–$649K bin rises again to 29 sales (9.21%), reflecting the presence of higher‑quality acreage properties that routinely trade in this range. Beyond $650K, the counts taper as expected: 16 sales (5.08%) in the $650K–$699K range, 10 (3.17%) each in the $700K–$749K and $750K–$799K bins, and then small, isolated counts in the $800Ks and $900Ks. The upper tail ends with 3 sales (0.95%) at or above $950K.
The overall shape is exactly what a healthy manufactured‑home market should look like: a strong, well‑defined middle; a gradual taper on both sides; and no evidence of clustering at distressed price points or runaway concentration at the high end.
The following histogram shows the distribution of age for manufactured homes in 2025:
The age distribution for 2025 manufactured‑home sales forms a broad mid‑life plateau centered on homes built roughly 27–32 years ago. The 27–29 year bin accounts for 17.14% of all sales, and the 30–32 year bin adds another 18.73%, placing more than a third of the year’s activity in this single five‑year span. The average age of 30.50 years sits directly within this peak, reflecting the era when a large share of the region’s manufactured stock was built.
Surrounding this core, the bins from 24–47 years make up 73.02% of all 2025 sales, underscoring how strongly the market is anchored in this construction era. Even when the 27–32 year peak is removed, the remaining bins in that same 24–47 year window still represent 37.14% of the dataset, showing that the “shoulders” of the distribution are almost as large as the rest of the histogram combined. This structure reflects the region’s development history: a substantial wave of manufactured‑home construction in the late 1980s and early 1990s, followed by steadier, thinner additions in later decades.
The younger end of the distribution is modest, with only small counts in the 0–2, 3–5, and 6–8 year bins. This reflects the limited pipeline of new or recent construction manufactured homes entering the resale market each year. The older tail behaves similarly, tapering gradually through the 36–53 year bins and ending with just four sales each in the 54–56 and 57+ year ranges. Both tails are present but light, reinforcing that the market is driven primarily by mid‑life homes with predictable turnover and stable buyer demand.
The following histogram shows the distribution of total square footage for manufactured homes in 2025:
The 2025 square‑footage distribution is anchored firmly in the mid‑size ranges, and the average of 1,629 square feet for 2025 sits directly within the broad plateau that defines the market. The single largest bin is1,500–1,649 SF, representing 16.51% of all sales, and it is surrounded by similarly strong activity in the 1,200–1,349 SF (13.65%), 1,350–1,499 SF (12.70%), and 1,650–1,799 SF (13.97%) ranges. When combined with the 1,800–1,949 SF bin (9.84%), this mid‑range cluster forms a dominant block: the 1,050–1,949 SF span accounts for 242 sales, or 76.83% of the entire market. This is the structural center of the manufactured‑home segment in 2025.
Below this core, smaller homes taper in gradually. Units under 1,050 SF total 21sales (6.67%), with modest representation in the 750–899 SF and 900–1,049 SFbins and only isolated activity below 750 square feet. Very small units under 600 square feet are nearly absent, reflecting the limited presence of tiny or cottage‑style manufactured homes in the resale market.
Above the mid‑range plateau, the distribution steps down in a predictable pattern. The 1,950–2,399 SF bins show steady but modest activity, and the upper tail continues through the 2,400–2,699 SF ranges before tapering to the 2,700–2,849 SF and 2,850+ SF bins. Larger homes remain a small share of the market, but they appear consistently enough to form a recognizable tail rather than isolated outliers.
The following histogram shows the distribution of lot size for manufactured homes in 2025:
The 2025 lot‑size distribution shows a market split between small parcels and acreage properties, with a long upper tail that reflects the rural and semi‑rural settings common in this segment. The average lot size of 3.44 acres for 2025 sits well above the median bins, pulled upward by a relatively small number of large‑acreage properties.
The most common range by far is 0.000–0.499 acres, representing 41.90% of all sales. These are smaller‑scale parcels where the home itself drives most of the value. The next several bins—0.500–0.999 acres (9.52%), 1.000–1.499 acres (6.35%), and 1.500–1.999 acres (3.49%)—add another block of modest‑sized lots, placing the majority of 2025 sales on parcels under two acres.
Beyond that point, the distribution transitions into a broad acreage band. The 2.000–2.499 and 2.500–2.999 acre bins account for 5.40% and 6.03% of sales, and the 3.000–3.999 acre ranges add smaller but steady counts. These mid‑acreage parcels reflect the region’s rural inventory—properties with more land utility, outbuildings, or agricultural potential.
The upper tail is long and structurally important. Individual bins from 4.000–4.499 acres through 9.000–9.499 acres each contain only a handful of sales, but the final bin—≥ 9.500 acres, with 31 sales (9.84%)—is large for a specific reason. It is not a natural cluster at 9.5 acres; it is the catch‑all category for the entire long tail of acreage parcels, including properties extending far beyond the histogram’s visible range. Because the chart is limited to 20 bins, all parcels larger than 9.5 acres are compressed into this single bucket, which explains its size and why the average lot size reaches 3.44 acres even though most homes sell on small lots.
The overall shape is a classic manufactured‑home pattern: a dense small‑lot core, a broad mid‑acreage band, and a long, open‑ended tail where large rural parcels trade in small but meaningful numbers. This structure aligns with the pricing, age, and square‑footage distributions already documented, reinforcing the diversity of settings in which manufactured homes operate across the region.
The following histogram shows the distribution of cumulative days on market for manufactured homes in 2026:
The CDOM distribution for 2025 shows a market with a strong, fast‑moving core and a structurally long tail, and the average of 61.03 days for 2025 sits right at the hinge point between those two regimes. The first two bins—0–4 days (14.92%) and 5–9 days (18.73%)—together account for one‑third of all sales, reflecting listings that were priced correctly and absorbed quickly. The next several bins through roughly 30 days add another steady block of activity, with 10–14 days (6.03%), 15–19 days (5.08%), 20–24 days (3.81%), and 25–29 days (2.22%) forming a smooth taper. This early portion of the histogram captures the bulk of the market’s normal turnover (50.79%).
From 30 to about 60 days, the distribution remains relatively stable and evenly populated. Bins such as 35–39 days (4.13%), 40–44 days (2.86%), 45–49 days (4.44%), and 50–54 days (4.44%) show that mid‑range marketing times were common and not indicative of distress. These ranges represent listings that required modest repositioning or simply needed more exposure time, but still behaved predictably within the broader flow of the market.
The upper tail begins around 60 days and extends outward in small but persistent increments. Individual bins from 60–64 days (1.59%) through 90–94 days (1.59%) each contain only a handful of sales, but they form a continuous sequence of slower‑moving listings. The final bin—≥ 95 days, with 59 sales (18.73%)—is large for a structural reason. It is not a natural cluster at 95–100 days; it is the catch‑all category for the entire long tail, which in 2025 extended all the way to a maximum of 712 cumulative days on market. Because the histogram is limited to 20 bins, every listing beyond 95 days is compressed into this single bucket, which explains its size and why the average CDOM reaches 61.03 days even though most sales occur well below that threshold (the median is 27 days).
The overall shape is consistent with a healthy manufactured‑home market: a fast‑moving core, a stable mid‑range, and a long but thin tail of slower‑moving listings that reflect unique property characteristics, pricing adjustments, or atypical circumstances.
Miscellaneous Statistics & Standout Transactions
Here are some of the most notable outliers and extremes from the 2025 Portland Region attached homes market—numbers that illustrate the full range of the data and the extremes buyers and appraisers encounter.
Lowest Sales Price: $115,000—1-bedroom, 1.0-bathroom unit. This manufactured home in Vernonia (Columbia County) predates the current HUD codes and is a compact unit offering a distinct bedroom and living space on a 0.10-acre lot. This unit offers home and land ownership at an affordable price point. Photos of this property are currently available online.
Highest Sales Price: $1,100,000—Two manufactured homes in Canby, Oregon (Clackamas County). This sale involved two homes on one 10.03-acre lot. One home is 1,497 sq. ft. and the other is 1,671 sq. ft. The property has a number of outbuildings and the site offers a lot of flexibility for the owner. Photos of this property are currently available online.
Longest CDOM: 712 days—3-bedroom, 2.0-bathroom home in Mulino, Oregon (Clackamas County). This 1,820-sq. ft. property sold as a heavy fixer, which accounts for why it took so long to close. The unit is situated on 8.27 acres. The land likely represented a significant portion of the value. Photos of this property are currently available online.
Smallest Manufactured Home: 500 SF—1-bedroom, 1.0-bathroom unit. This is the same home as the lowest-priced sale. This property took the crown in two categories!
Largest Manufactured Home: 4,800 SF—3-bedroom, 2.0-bathroom unit in North Plains, Oregon (Washington County). This property is a triple-wide behemoth with solar panels! It is located on a 42.62-acre site and most of the lot is used for merchantable timber. Exterior photos of this property are currently available online.
Largest Lot: 53.39 acres—3-bedroom, 2.0-bathroom unit in Clatskanie, Oregon (Columbia County). This 2,209-sq. ft. home sold as a fixer. The site has several outbuildings and 40 acres of timber. The site is mostly gentle slope, making for a very usable plat. Photos of this property are currently available online.
With the regional aggregate trends, graphs, monthly patterns, histogram analysis, and notable outliers covered, the remainder of this update turns to a county-level breakdown. The following sections present year-over-year comparisons for each of the six counties in the Portland Region—Multnomah, Washington, Clackamas, Yamhill, Columbia, and Hood River. Each county snapshot includes key metrics, commentary on local drivers, and any segment-specific observations that help explain broader regional patterns.
Multnomah County 2025 Stats
Multnomah County represented 6.98% of the total 2025 manufactured home market.
The table below summarizes key metrics for Multnomah County manufactured single-family residential sales in 2025 compared with 2024.
Category
2024
2025
% Change
Total $ Volume
$9.07 Million
$10.27 Million
+13.23%
Average Price
$412,132
$466,676
+13.23%
Median Price
$390,500
$404,000
+3.46%
Avg SP/OLP
98.09%
95.09%
-3.05%
Avg PPSF (TSF)
$256.83
$332.86
+29.60%
Avg Lot Size (ac)
1.58
2.94
+85.53%
Avg Age (Yrs)
28.50
31.41
+10.21%
Avg CDOM
66.05
70.50
+6.74%
Avg Total SF
1,635
1,540
-5.84%
Total # of Sales
22
22
0.00%
# of New Constr.
0
0
—
# of REOs
1
0
-100.00%
# of Short Sales
0
0
—
Multnomah County continues to play a marginal role in the Portland Region’s manufactured housing market on owned land, with exactly 22 sales in 2025—unchanged from 2024. This persistent low volume reflects the county’s urban character: scarce acreage parcels, zoning restrictions, and competition from higher-density or site-built uses limit opportunities for affixed manufactured homes.
Despite flat transaction count, dollar volume increased 13.23% to $10.27 million, driven by a corresponding 13.23% rise in average price to $466,676 (median up 3.46% to $404,000). Notably, average home size declined slightly, while average lot size nearly doubled (+85.53% to 2.94 acres). The shift toward larger parcels—concentrated in outer rural pockets—lifted total values and contributed to a sharp 29.60% increase in average PPSF, even as the improvements themselves remained modest. Market time lengthened modestly (average CDOM +6.74%), and sales-to-list ratios fell to 95.09% (-3.05%), consistent with the negotiation dynamics typical of acreage properties.
No new construction or distressed sales occurred in 2025, keeping the segment clean and conventional. In this county dominated by the Portland urban core, manufactured homes on owned land most often function as an interim or affordability solution on remaining larger parcels.
The following is a scatter plot of all Multnomah County sales in 2025 (sales price vs. date of sale):
The Sales Price vs. Date of Sale scatter for Multnomah County reveals a noticeable downward pattern across 2025. This is likely due to a compositional shift in lot size as the year progressed. The larger lots supported elevated prices early on, followed by a general shift toward smaller parcels later in the year—contributing to overall price stability with a downward tilt despite the modest YoY gains in averages.
Washington County 2025 Stats
Washington County represented 11.75% of the total 2025 manufactured home market.
The table below summarizes key metrics for Washington County manufactured single-family residential sales in 2025 compared with 2024.
Category
2024
2025
% Change
Total $ Volume
$18.05 Million
$19.59 Million
+8.54%
Average Price
$474,884
$529,362
+11.47%
Median Price
$422,500
$485,000
+14.79%
Avg SP/OLP
97.11%
96.69%
-0.43%
Avg PPSF (TSF)
$329.95
$317.46
-3.79%
Avg Lot Size (ac)
2.52
4.38
+73.55%
Avg Age (Yrs)
26.92
33.22
+23.38%
Avg CDOM
56.03
54.11
-3.42%
Avg Total SF
1,496
1,778
+18.87%
Total # of Sales
38
37
-2.63%
# of New Constr.
0
0
—
# of REOs
0
0
—
# of Short Sales
0
0
—
Washington County ranks as a solid mid-tier contributor to the Portland Region manufactured housing market on owned land, with 37 sales in 2025—down slightly from 38 in 2024 (see the county summary table above). This modest decline in volume still places Washington among the more active counties for affixed manufactured homes, reflecting its mix of suburban and rural pockets where acreage remains somewhat available compared to urban Multnomah.
Dollar volume increased 8.54% to $19.59 million, supported by stronger per-unit pricing: average price rose 11.47% to $529,362, and median price climbed 14.79% to $485,000. The price gains were driven primarily by larger and newer inventory—average lot size jumped 73.55% to 4.38acres, and average home size grew 18.87% to 1,778 SF—while average PPSF eased slightly (-3.79% to $317.46), a reminder that total value in this segment is heavily influenced by land contribution rather than improvement size alone. Homes also aged noticeably (average +23.38% to 33.22 years), consistent with limited new production. Market absorption improved modestly (average cumulative DOM -3.42% to 54.11 days), and sales-to-list ratios remained stable at 96.69% (-0.43%), typical for acreage properties.
The following is a scatter plot of all Washington County sales in 2025 (sales price vs. date of sale):
The Sales Price vs. Date of Sale scatter for Washington County shows consistent activity throughout 2025, with prices spanning roughly $300,000 to over $1,000,000 and no strong seasonal or directional trend. A couple of higher-end sales ($800K+ range) appear in late summer/early fall, while mid-range sales ($400K–$700K) dominate the bulk of transactions. This even distribution aligns with the county’s balanced pricing gains despite the slight drop in unit count.
No new construction or distressed sales occurred in 2025, keeping the segment entirely resale. Washington County’s manufactured home market benefits from its position between urban constraints and rural acreage opportunities, allowing larger parcels to support elevated values in a segment where land often outweighs the home itself in the valuation equation.
Clackamas County 2025 Stats
Clackamas County represented 40.63% of the total 2025 manufactured home market.
The table below summarizes key metrics for Clackamas County manufactured single-family residential sales in 2025 compared with 2024.
Category
2024
2025
% Change
Total $ Volume
$49.8 Million
$64.10 Million
+28.70%
Average Price
$508,188
$500,743
-1.47%
Median Price
$491,601
$450,000
-8.46%
Avg SP/OLP
96.47%
96.43%
-0.04%
Avg PPSF (TSF)
$314.19
$311.37
-0.90%
Avg Lot Size (ac)
4.04
3.13
-22.59%
Avg Age (Yrs)
27.35
28.73
+5.04%
Avg CDOM
51.48
57.95
+12.56%
Avg Total SF
1,663
1,676
+0.78%
Total # of Sales
98
128
+30.61%
# of New Constr.
2
3
+50.00%
# of REOs
1
2
+100.00%
# of Short Sales
0
0
—
Clackamas County dominates the Portland Region manufactured housing market on owned land, accounting for 128 sales in 2025 and $64.10 million in volume (43.20%). Sales count surged 30.61% from 98 in 2024, driving a 28.70% increase in dollar volume and cementing Clackamas as the clear leader in this segment.
Despite the robust volume growth, per-unit pricing softened modestly: average price fell 1.47% to $500,743, and median price declined 8.46% to $450,000. Average PPSF remained nearly flat (-0.90% to $311.37), while average lot size decreased 22.59% to 3.13 acres. The smaller average parcels likely contributed to the price softening by reducing land contribution, even as home size stayed stable (+0.78% to 1,676 SF) and age increased slightly (+5.04% to 28.73 years). Market time lengthened (average cumulative DOM +12.56% to 57.95 days), and sales-to-list ratios held steady at 96.43% (-0.04%). New construction remained minimal (3 units), and distressed activity was limited to 2 REOs.
Clackamas County’s average price hewed closely to 2024 levels, remaining essentially neutral in the dataset. With the county representing over 40% of regional sales volume, its stability anchored the market and allowed stronger price gains in smaller-volume counties to modestly lift the regional average.
The following is a scatter plot of all Clackamas County sales in 2025 (sales price vs. date of sale):
The Sales Price vs. Date of Sale scatter for Clackamas County shows consistent activity throughout 2025, with prices ranging from approximately $200,000 to over $1,100,000 and a subtle upward tilt in the latter half of the year. Higher-value sales (more points in the $600,000–$900,000+ range) become more prevalent from mid-year onward, reflecting a gradual increase in home size closing later in the period. This pattern helps offset some of the modest per-unit price softening seen in the annual averages.
Clackamas County’s leadership in manufactured home sales stems from its relative abundance of rural and semi-rural parcels compared to more urban counties. It represents the engine of the region’s manufactured homes market.
Yamhill County 2025 Stats
Yamhill County represented 21.90% of the total 2025 manufactured home market.
The table below summarizes key metrics for Yamhill County manufactured single-family residential sales in 2025 compared with 2024.
Category
2024
2025
% Change
Total $ Volume
$25.43 Million
$29.35 Million
+15.45%
Average Price
$454,037
$425,431
-6.30%
Median Price
$407,500
$410,000
+0.61%
Avg SP/OLP
96.33%
97.60%
+1.32%
Avg PPSF (TSF)
$288.51
$270.53
-6.23%
Avg Lot Size (ac)
3.13
2.99
-4.34%
Avg Age (Yrs)
29.75
31.80
+6.88%
Avg CDOM
54.38
50.88
-6.42%
Avg Total SF
1,604
1,579
-1.55%
Total # of Sales
56
69
+23.21%
# of New Constr.
0
0
—
# of REOs
2
1
-50.00%
# of Short Sales
0
0
—
Yamhill County ranks as the second-most active market for manufactured homes on owned land in the Portland Region, with 69 sales in 2025—up 23.21% from 56 in 2024—and $29.35 million in volume (+15.45%). This solid rebound in transaction activity underscores the county’s appeal for rural and semi-rural acreage buyers, where manufactured homes remain a viable affordability option.
Despite the volume strength, per-unit pricing softened: average price declined 6.30% to $425,431, while the median held nearly flat (+0.61% to $410,000). Average PPSF fell 6.23% to $270.53, reflecting slightly smaller homes (-1.55% to 1,579 SF) and marginally reduced lot size (-4.34% to 2.99 acres), combined with an older inventory base (+6.88% to 31.80 years). Absorption improved noticeably (average cumulative DOM -6.42% to 50.88 days—the fastest among the six counties), and sales-to-list ratios edged higher to 97.60% (+1.32%), suggesting relatively efficient pricing negotiations for acreage properties.
No new construction occurred, and distressed activity was minimal (one REO). Yamhill County’s manufactured home market benefits from its rural character and relative availability of acreage compared to more urban counties, though land contribution remains the primary valuation driver.
The following is a scatter plot of all Yamhill County sales in 2025 (sales price vs. date of sale):
The Sales Price vs. Date of Sale scatter for Yamhill County illustrates consistent activity throughout 2025, with prices ranging from approximately $100,000 to nearly $900,000 and the bulk clustering between $300,000 and $600,000. Higher-value sales appear scattered across the year without a dominant trend, reflecting the county’s mix of rural larger-lot parcels (supporting occasional $600K+ closings) and more modest suburban or small-lot transactions that drive much of the volume. The even monthly distribution aligns with the strong unit growth and quicker market time.
Columbia County 2025 Stats
Columbia County represented 13.97% of the total 2025 manufactured home market.
The table below summarizes key metrics for Columbia County manufactured single-family residential sales in 2025 compared with 2024.
Category
2024
2025
% Change
Total $ Volume
$20.98 Million
$16.94 Million
-19.27%
Average Price
$395,896
$384,984
-2.76%
Median Price
$373,500
$375,000
+0.40%
Avg SP/OLP
96.83%
93.90%
-3.03%
Avg PPSF (TSF)
$256.28
$262.81
+2.55%
Avg Lot Size (ac)
4.66
5.20
+11.70%
Avg Age (Yrs)
29.04
32.23
+10.98%
Avg CDOM
89.19
81.73
-8.37%
Avg Total SF
1,581
1,484
-6.09%
Total # of Sales
53
44
-16.98%
# of New Constr.
1
1
0.00%
# of REOs
3
1
-66.67%
# of Short Sales
0
0
—
Columbia County represents a distinctly rural segment of the Portland Region manufactured housing market on owned land, with 44 sales in 2025—down 16.98% from 53 in 2024—and $16.94 million in volume (-19.27%). This volume contraction reflects the county’s remote location and limited buyer pool.
Per-unit pricing showed mild softening: average price declined 2.76% to $384,984, while the median remained essentially flat (+0.40% to $375,000). Average PPSF edged up modestly (+2.55% to $262.81), supported by larger average lot size (+11.70% to 5.20 acres—the highest among the six counties) despite smaller homes (-6.09% to 1,484 SF) and an older inventory (+10.98% to 32.23 years). Market time improved (-8.37% to 81.73 cumulative DOM), though Columbia retained the longest average days on market among the counties. Sales-to-list ratios fell to 93.90% (-3.03%), indicating greater negotiation room typical of more isolated acreage properties. New construction was negligible (1 unit), and distressed activity reduced to one REO.
The following is a scatter plot of all Columbia County sales in 2025 (sales price vs. date of sale):
The Sales Price vs. Date of Sale scatter for Columbia County illustrates steady but sparse activity throughout 2025, with prices ranging from $115,000 to $725,000 and the majority clustering between $300,000 and $600,000. Higher-value sales appear scattered across the year without a clear trend, reflecting the county’s rural character and large-lot dominance, while lower-end transactions (some on small parcels) contribute to the lower tail. The even monthly distribution aligns with the improved absorption despite the overall volume decline.
Hood River County 2025 Stats
Hood River County represented 4.76% of the total 2025 manufactured home market.
The table below summarizes key metrics for Hood River County manufactured single-family residential sales in 2025 compared with 2024.
Category
2024
2025
% Change
Total $ Volume
$4.30 Million
$8.13 Million
+88.92%
Average Price
$477,994
$541,809
+13.35%
Median Price
$499,000
$560,000
+12.22%
Avg SP/OLP
95.20%
93.56%
-1.72%
Avg PPSF (TSF)
$321.86
$335.87
+4.35%
Avg Lot Size (ac)
1.22
1.35
+10.58%
Avg Age (Yrs)
27.56
26.47
-3.95%
Avg CDOM
34.78
76.47
+119.87%
Avg Total SF
1,639
1,650
+0.68%
Total # of Sales
9
15
+66.67%
# of New Constr.
0
0
—
# of REOs
0
0
—
# of Short Sales
0
0
—
Hood River County represents the smallest but most premium segment of the Portland Region manufactured housing market on owned land, with 15 sales in 2025—up 66.67% from 9 in 2024—and $8.13 million in volume (+88.92%). Despite the low absolute numbers, this rebound reflects renewed interest in the area’s scenic appeal and limited supply of suitable parcels.
Per-unit pricing advanced solidly: average price increased 13.35% to $541,809, and median price rose 12.22% to $560,000—the highest county medians in the region. Average PPSF climbed 4.35% to $335.87 (also the highest), supported by slightly larger lots (+10.58% to 1.35 acres—the smallest average acreage) and stable home size (+0.68% to 1,650 SF). Homes were marginally younger (-3.95% to 26.47 years—the youngest average age), suggesting a mix that included relatively recent builds. Market time extended significantly (+119.87% to 76.47 cumulative DOM), likely due to the county’s remote location and selective buyer pool, while sales-to-list ratios dipped to 93.56% (-1.72%), indicating greater negotiation room on premium properties. No new construction or distressed sales occurred.
Hood River County’s manufactured home market benefits from its unique location in the Columbia River Gorge, where demand for views, recreation, and limited supply drives premium per-unit values despite smaller average lots and extended market time.
The following is a scatter plot of all Hood River County sales in 2025 (sales price vs. date of sale):
The Sales Price vs. Date of Sale scatter for Hood River County shows sparse but steady activity throughout 2025, with prices ranging from $295,000 to $750,000 and the majority clustering between $500,000 and $700,000. Higher-value sales appear scattered across the year without a dominant trend, consistent with the county’s limited inventory and scenic/river-proximity premiums that support elevated pricing even on smaller parcels.
Closing Thoughts
2025 proved to be a year of quiet resilience and uneven recovery for manufactured homes on owned land in the Portland Region. Transaction volume rebounded strongly to 315 sales—essentially returning to 2023 levels after the softer 2024—and total dollar volume rose 16.25% to $148.4 million; putting nearly $21 million more dollars in sellers’ hands. Per-unit pricing held firm with modest gains and PPSF edged up, even as inventory continued to age and new construction remained negligible (just 4 units region-wide).
The year highlighted the segment’s rural character: Clackamas, Yamhill, and Columbia together accounted for ~74% of dollar volume and ~77% of sales, driven by acreage availability that buffered value despite macro pressures. Land contribution remained the dominant valuation driver across counties—diluting PPSF in larger-parcel sales while supporting total prices, especially in premium locations like Hood River (highest avg/median prices and PPSF) and rural pockets in Washington and Columbia (largest average lots). Heterogeneity persisted, with small-sample volatility in lower-volume counties (Multnomah, Hood River) and longer market times in remote areas, yet quicker absorption in Yamhill and Washington.
Distress stayed minimal (4 REOs, zero short sales), and the segment earned its place as the second-most affordable housing type per the Portland Appraisal Blog Affordability Index (PABAI 111.67), trailing only condominiums.
Manufactured homes on owned land continue to serve as a practical affordability pathway and, in many cases, an interim use on rural parcels where site-built homes are viewed as the highest and best use. There were 1,199 acreage site-built sales in 2025; when combined with the 153 manufactured homes on at least 1 acre of land, that yields 1,352 total acreage sales. Manufactured homes thus comprised 11.32% of the acreage market—almost eight times their approximate share of overall regional housing sales volume.
Looking to 2026, key questions include whether sustained rate relief and rural demand will sustain or accelerate volume, whether limited new production will further age the inventory, and how evolving land-use policies might affect acreage availability in outer counties. The niche’s resilience through 2025 suggests it will remain an important, if specialized, component of regional housing options.
What trends do you expect to see in 2026? I’d love to hear your thoughts—feel free to reply here or reach out directly.
Sources & Further Reading
All data presented in this annual review is sourced directly from RMLS and has been subjected to our rigorous cleaning and validation process to ensure reliability for manufactured residential analysis in the six-county Portland Region. The trends, comparisons, and commentary are the result of original appraisal expertise and independent analysis—not aggregated from secondary sources or news summaries.
Portland Affordability Index – PABAI: A Realistic Housing Qualification Metric for the Portland Region: Portland Appraisal Blog
Coda
Thanks for reading—I hope you found a useful insight or an unexpected nugget along the way. If you enjoyed the post, please consider subscribing for future updates.
Are you an agent in Portland who wonders why appraisers always do “x”?
A homeowner with questions about appraiser methodology?
If so, feel free to reach out—I enjoy connecting with market participants across Portland and the surrounding counties, and am always happy to help where I can.
And if you’re in need of appraisal services in Portland or anywhere in the Portland Region, we’d be glad to assist.
The 2025 Portland Region attached homes market saw median prices down 1.13% to $435k and CDOM up 14.13% to 68.4 days. New construction surged nearly 26%. The region recorded 1,646 sales, with Washington County accounting for 53.65% of activity. Regional overview, county trends, analytical insights, and more.
The White Stag Sign in late afternoon. Photo: Abdur Abdul-Malik, Portland Appraisal Blog (CC BY-SA 4.0)
The 2025 Portland Region attached homes market entered the year on solid footing, supported by steady demand, a consistent flow of new construction, and a segment that has largely settled into its post-rate-shock rhythm. After several years of adjustment to higher borrowing costs, attached homes now behave in a more predictable way: functional, resilient, and shaped as much by deliberate buyer selectivity as by broader economic conditions.
This segment occupies a distinctive middle ground in the region’s housing landscape. Fee-simple ownership of both the dwelling and underlying land provides a measure of autonomy and equity-building potential similar to detached homes, while the high prevalence of mandatory HOA dues introduces condominium-like shared responsibilities and carrying-cost considerations. This hybrid nature influences buyer decision-making, particularly when association fees, maintenance obligations, or restrictions factor into total ownership affordability.
New construction remained a key stabilizing force, infusing the market with modern townhomes and rowhouses that appealed to buyers seeking updated features and efficiency in suburban and edge-urban locations. At the same time, resale inventory reflected greater heterogeneity—from older rowhouses to newer planned-unit developments—requiring careful attention to comparable selection and valuation adjustments.
Buyers exercised greater selectivity, prioritizing pricing alignment, condition, location, and overall carrying costs. This manifested in extended marketing times for some properties and a subtle shift toward more balanced conditions, though the market avoided the sharper softening observed in the condominium segment. Affordability for attached homes held near equilibrium, with the Portland Appraisal Blog Affordability Index (PABAI) indicating that typical household income was nearly sufficient to qualify under prevailing rates, taxes, insurance, and HOA dues—placing the segment more attainable than detached homes but not as affordable as condominiums.
Taken together, 2025 reads as a transition year for attached homes: a market still on stable ground, but beginning to lean toward buyers as supply loosens and selectivity increases. The sections that follow document these dynamics in detail, drawing on cleaned RMLS data to provide a clear, reference-grade record of the year.
The Portland Region in this update comprises the six Oregon counties of Columbia, Clackamas, Hood River, Multnomah, Washington, and Yamhill. These counties form a contiguous housing ecosystem centered on Portland—Multnomah as the core home county, with the others tightly integrated through commuting patterns, economic ties, and shared market dynamics (e.g., Yamhill’s strong connection via Highway 99W and wine-country adjacency). Beyond Yamhill, the MLS system changes, further distinguishing this six-county area from broader geographic aggregations. For a detailed overview—including county profiles, population data, key value influencers, and why this definition differs from the official seven-county Portland–Vancouver–Hillsboro MSA—see my dedicated page: The Portland Region – Six-County Market Area Overview.
All data is sourced from RMLS and reflects open-market attached single-family residential sales (excluding condominiums, detached homes, and multifamily). SNL (“Sold Not Listed”) entries—off-market transactions entered retroactively—have been excluded to preserve consistency with true market activity.
All figures have undergone my standard cleaning process to address common RMLS accuracy challenges, including misclassifications (e.g., condos listed as attached), square footage/price typos, incomplete fields, status/date mismatches, and non-representative entries. For a detailed overview of these issues, their impact on market analysis, and how I mitigate them through automated flagging, cross-verification, and manual review, see my dedicated page: RMLS Data Accuracy Challenges.
It is important to note that attached homes are just that: attached; whether on just one or both sides. They also entail ownership of the land the structure sits on. This makes them distinct from condominiums. They are also differentiated from multifamily properties in that each unit is individually owned. With a duplex, for example, there is a single owner, although the owner may rent or occupy each unit as they see fit. The owner cannot sell half of a duplex (one unit). It can get confusing, and the data in RMLS reflects that.
An attached home is just like a single-family detached home in rights and responsibilities; the principal difference is whether the structure is completely freestanding or joined at the hip with a neighbor or two. While an attached home is often located in an HOA and may even be physically indistinguishable from a townhome-style condominium, they are not condos, and are more similar to detached homes in all the categories that matter.
Portland Region 2025 Overview
2025 saw a continuation in the surge of new construction in the attached home segment. Despite the greater share of new units, average and median prices softened.
Overall Regional Trends
The table below summarizes key metrics for attached single-family residential sales in the Portland Region (Columbia, Clackamas, Hood River, Multnomah, Washington, and Yamhill counties) for 2025 compared with 2024.
Category
2024
2025
% Change
Total $ Volume
$715.1 Million
$758.4 Million
+6.05%
Average Price
$461,973
$460,764
-0.26%
Median Price
$439,960
$435,000
-1.13%
Avg SP/OLP
97.93%
97.00%
-0.94%
Avg PPSF (TSF)
$301.50
$291.76
-3.23%
Avg HOA Dues
$234.09
$236.84
+1.18%
Avg Age (Yrs)
16.29
15.69
-3.67%
Avg CDOM
59.90
68.36
+14.13%
Avg Total SF
1,557
1,598
+2.60%
Total # of Sales
1,548
1,646
+6.33%
# of New Constr.
509
640
+25.74%
Avg Supply (Mos.)
3.00
3.98
+32.54%
# of REOs
4
7
+75.00%
# of Short Sales
3
2
-33.33%
Note: The calculated average HOA dues is for units reporting HOA dues (1,295 sales). All other metrics use the full dataset (1,646 sales). Single-Family Attached Residential | 2024 & 2025 Data: RMLS | PortlandAppraisalBlog.com
Key Observations From the Aggregate Data
The 2025 attached‑home market remained functional and well‑supplied, with new construction shaping both the composition of sales and the overall performance of the segment. Several themes stand out when interpreting the year‑over‑year changes:
New construction was the primary engine of market stability. The segment saw a meaningful increase in total sales, and roughly a quarter more new‑construction units closed compared to the prior year. These newly built townhomes and rowhouses made up a substantial share of all 2025 activity and were largely responsible for keeping overall volume in positive territory. Without this influx of fresh inventory, total sales would likely have been flat.
The average age of sold homes declined due to the shift in mix. With so many new units entering the pipeline, the average age of attached homes sold moved several percent lower. This reflects a compositional shift toward recently completed properties rather than any broad change in the region’s existing housing stock.
Average and median prices edged down as supply loosened. Both measures posted low‑single‑digit declines, consistent with a market where buyers had more options and more time. The combination of increased new‑construction supply and a noticeable rise in months of housing supply placed gentle downward pressure on pricing. These movements reflect a shift toward balance rather than any sign of distress.
Price per square foot fell more sharply, influenced partly by larger average unit sizes. PPSF declined by a few percentage points, outpacing the modest softening in overall prices. Part of this movement stems from slightly larger average square footage—an expected outcome when new construction makes up a bigger share of the sold mix. In years with size stability, PPSF tracks price movement more directly; in 2025, the compositional effect played a meaningful role.
HOA dues showed minimal upward movement—a notable bright spot for affordability. Average dues increased by just over one percent, a restrained change compared to the sharper increases seen in the condominium segment. For the majority of attached homes with mandatory dues, this stability helped keep total ownership costs predictable and prevented additional affordability pressure.
Distressed sales remained negligible. REO and short‑sale activity together amounted to single‑digit counts in a market with more than 1,600 closings. Their minimal presence reinforces the broader picture of a segment without systemic financial strain, even as marketing times lengthened and supply increased.
Portland Region Scatter Plots
To visualize the distribution of individual attached homes sales prices across 2025, the following scatter plots show sales price against date of sale. The first graph displays the full range of transactions, while the second focuses on the $800k or less range.
The full‑market scatter of 2025 attached‑home sales offers a clear visual sense of how this segment behaved across the year. Most sales cluster in a tight horizontal band between the mid‑$400s up to $600k, reflecting the segment’s characteristic price stability and relatively narrow product range. Unlike detached homes, which stretch from distressed fixers to luxury outliers, or condos, which include everything from micro‑units to penthouses, attached homes tend to occupy a consistent middle band. That uniformity is immediately visible here.
One of the most notable features of the scatter is the absence of deep entry‑level pricing. No sales fall below the $200,000 mark, and the lower edge of the distribution remains remarkably stable throughout the year. This is a structural trait of the segment: attached homes rarely include the very small, distressed, or legacy units that populate the lower ends of the condo and detached markets. The result is a natural price floor that keeps the distribution compact and predictable.
Within that band, a subtle downward drift emerges as the year progresses. Early‑year sales tend to sit slightly higher in the cluster, while late‑year sales settle modestly lower. The slope is gentle, but it aligns with the broader story of 2025: more supply, more new construction, and more buyer selectivity. The scatter shows a market that remained functional and well‑supplied, but one that softened at the margins as the year moved on.
A handful of higher‑priced outliers appear above the main band, many of them tied to new construction. But even these upper‑end sales do not distort the overall pattern. The segment’s pricing structure remains anchored in the middle of the market, with new construction reinforcing that center rather than pulling it upward.
Zooming in on sales priced at $800,000 or less we have:
When the scatter is narrowed to sales at $800,000 or less, the shape of the attached‑home market becomes even clearer. Nearly the entire dataset remains intact—97.6% of all 2025 attached sales fall at or below $800k—which means this zoomed‑in view isn’t a subset so much as a more legible rendering of the full market. The upper‑end outliers fall away, but the core structure of the distribution stays exactly the same.
What emerges is a dense, disciplined band of activity stretching from the low‑$300s to the upper‑$700s, with the vast majority of sales clustering between roughly $400,000 and $600,000. This is the heart of the attached segment.
The downward tilt that was only faintly visible in the full‑range scatter becomes more apparent here. Early‑year sales sit slightly higher within the band, while late‑year sales drift modestly lower. It’s a gentle slope, but it reinforces the broader theme of 2025: a market still on solid footing, but gradually softening as supply increased and buyers became more selective. The scatter shows this visually in a way that tables alone cannot.
Bottom-line Summary
The attached‑home segment in 2025 presents a clear, consistent picture: a market still functioning well, but gradually shifting under the weight of expanded supply and persistently high interest rates. The regional overview table shows modest price erosion, a noticeable rise in months of housing supply, and a meaningful increase in new‑construction deliveries—all signals that the tight conditions of prior years have begun to ease. The scatterplots reinforce this story visually. The segment maintained a firm price floor and a concentrated middle band, but the gentle downward drift across the year reflects buyers taking more time, exercising more discretion, and benefiting from a wider set of options.
New construction played a central role in this transition. It supported overall sales volume and refreshed the inventory, yet it did so without distorting the pricing structure; most new units landed squarely within the core price band. The result is a market that remains orderly and well‑supplied, but one that is unmistakably edging toward buyer‑favored conditions. Prices have not broken sharply, and the segment is not yet in a buyer’s market, but the combination of elevated rates, increased choice, and softening at the margins points to a landscape where buyers hold a bit more leverage than they did a year ago.
Sales Volume
A treemap visualizing the distribution of attached homes sales by county in 2025 clearly illustrates the market’s geographic concentration.
The sales‑volume treemap underscores how geographically concentrated the attached‑home market remains. Washington County once again carried the segment, accounting for more than half of all 2025 attached sales. Its dominance reflects both the depth of its attached‑home inventory and the steady stream of new construction that continued to shape the year’s activity. Multnomah County followed at roughly a quarter of all sales, with Clackamas contributing another meaningful share. Together, these three counties made up more than ninety‑six percent of the region’s attached‑home transactions—a level of concentration that has become a defining feature of this segment.
The remaining counties—Yamhill, Columbia, and Hood River—registered only small numbers of sales, consistent with their limited attached‑home stock and slower pace of new development. Their presence in the treemap is more about completeness than influence; they round out the regional picture but do not materially shape the segment’s behavior.
The following bar chart shows monthly sales volume for 2025:
Monthly sales activity in 2025 followed a seasonal arc, with a slow winter start, a steady rise into late spring, and a clear peak in early summer. June marked the high point for the year, reflecting the traditional convergence of buyer activity, new listings, and new‑construction deliveries. From April through October, the market moved in a remarkably stable band.
What stands out in this cycle is the strength of the late‑year months. November and December often taper more sharply, but in 2025 they held up better than expected. A significant share of that resilience came from new construction, which made up a large portion of the closings in those months and helped offset the seasonal slowdown. This pattern aligns with the broader theme of the year: increased supply—especially from new deliveries—gave buyers more options and kept transaction volume moving even as higher interest rates continued to weigh on affordability.
The line graph below compares monthly sales volume across the twelve months for 2024 and 2025.
The year‑over‑year comparison highlights the greater 2025 attached segment activity, even though both years followed broadly similar seasonal patterns. The two lines track closely through the early months, but 2025 begins to pull ahead in February and maintains that advantage through most of the year. The spring and early‑summer stretch is where the difference is most visible: April, June, and August all posted noticeably higher volumes in 2025, reflecting the impact of expanded inventory—particularly from new construction—and a buyer pool that remained engaged despite elevated interest rates.
What’s striking is that 2025 didn’t outperform 2024 because of a single outsized month. Instead, it was a series of steady, incremental gains across the middle of the year that pushed the annual total higher. Even in months where 2025 dipped slightly below 2024—May, September, October, and November—the differences were modest and quickly offset by stronger performance elsewhere. December 2025 finished ahead of the prior year, helped by a substantial share of new‑construction closings that kept volume slightly above 2024.
Sales Price
The following bar chart shows average monthly sales price for 2025:
Note: The y-axis starts at $420,000 to allow better examination of monthly differences.
Average pricing in 2025 moved within a remarkably narrow range, which is one of the defining characteristics of the attached segment. Monthly averages hovered close to the annual mean of roughly $461,000, with only modest fluctuations from one month to the next. The early spring months posted the highest averages of the year, but even those peaks were measured rather than dramatic. As the year progressed, prices drifted gently lower, reflecting the same softening seen in the scatterplots and the broader regional metrics.
What’s notable is how contained the movement is. Even in months where the average dipped—most visibly in August and November—the declines were incremental rather than abrupt. This stability mirrors the segment’s structural consistency: attached homes tend to be more uniform in size, age, and configuration, and the market rarely experiences the sharp swings that can appear in detached or condo segments. The late‑year averages also show the influence of new construction, which helped support pricing even as the market tilted toward buyers.
The line graph below compares average monthly sales prices across the twelve months for 2024 and 2025.
The year‑over‑year comparison shows just how stable pricing has been in the attached segment. The two lines move almost in unison, with only modest month‑to‑month differences and no meaningful divergence across the calendar year. Both years follow the same gentle seasonal rhythm, and both remain anchored within a narrow price band that reflects the segment’s structural consistency. At this scale, the line appears almost flat, underscoring how little volatility the market experienced despite elevated interest rates and shifting supply conditions.
Zooming in we have:
Note: The y-axis starts at $430,000 to allow better examination of monthly differences.
Once the scale tightens, the subtle differences between 2024 and 2025 come into focus. Both years still move within a narrow band, but the month‑to‑month shifts become more visible. In 2025, prices rise a bit more sharply the first three months before easing through spring, summer and early fall, while 2024 shows a smoother arc with a gentler spring peak and a more pronounced slide into year‑end. 2024 was ahead of 2025 seven out of twelve months, with average and median prices slightly down in 2025.
New Construction
The bar graph below shows monthly total attached homes sales for 2025, with new construction volume nested within each bar to illustrate the portion of sales that were newly built.
The comparison between new‑construction closings and total monthly sales makes clear just how central new deliveries were to the attached segment in 2025. New construction consistently accounted for a substantial share of activity throughout the year, often representing a third or more of all monthly sales. In several months—most notably October, November, and December—new construction made up close to half of all closings, providing a meaningful buffer against the seasonal slowdown that typically appears late in the year.
What stands out is the steadiness of this contribution. Rather than appearing in isolated bursts, new‑construction sales were present in every month and moved in tandem with the broader market. This pattern reflects both the ongoing build‑out of attached housing in the region and the role these units played in keeping transaction volume healthy despite elevated interest rates. The segment’s overall resilience in 2025 is closely tied to this pipeline of new supply, which expanded buyer choice and helped maintain momentum even as the market tilted gradually toward buyer‑favored conditions.
The chart ultimately reinforces a theme that appears throughout the annual: new construction didn’t distort the pricing structure, but it did shape the year’s activity. It supported volume, refreshed inventory, and played an outsized role in the late‑year months, helping the market finish stronger than it otherwise might have.
The bar graph below shows the number of new construction closings by county, with side-by-side bars for 2024 and 2025.
The county‑level comparison highlights how unevenly distributed new‑construction activity is across the region—and how much of the segment’s growth in 2025 came from just two counties. Washington and Multnomah together accounted for virtually all of the increase in new‑construction closings, with both counties posting strong year‑over‑year gains. Washington County, in particular, expanded its lead, reflecting the depth of its development pipeline and its role as the region’s primary engine for attached‑home production. Multnomah also saw a meaningful increase, driven by infill projects and the continued build‑out of attached housing in its growth corridors.
The remaining counties played only a marginal role. Clackamas saw a modest decline, while Columbia and Hood River posted very small numbers that reflect their limited attached‑home inventory rather than any meaningful shift in market conditions. Yamhill recorded no new‑construction closings in 2025, consistent with its historically small footprint in this segment.
What the chart ultimately shows is a highly concentrated pattern: nearly all new‑construction activity occurred in the three core counties, and within that group, Washington and Multnomah carried almost the entire load. This concentration mirrors the broader sales‑volume distribution and reinforces a central theme of the annual—new construction was a major driver of 2025 activity, but its impact was geographically focused, shaping the market most strongly where development pipelines were already established.
The table below shows new construction sales volume by dollar amount for 2025 compared with 2024.
The following double bar chart provides the above table information at a glance:
The dollar‑volume comparison shows just how much financial weight new construction carried in 2025. Builders collectively brought in roughly $60 million more than the prior year—a substantial jump that reflects both higher unit counts and the continued shift toward more affordable attached‑home formats. Washington and Multnomah counties were responsible for nearly all of that increase. Washington alone accounted for about 62% of all new‑construction dollars, and nearly a quarter of the region’s entire attached‑home dollar volume, underscoring its role as the center of gravity for new development.
Multnomah also posted a strong gain, driven by steady infill activity and the ongoing build‑out of attached housing in its established corridors. Clackamas softened slightly, and the remaining counties contributed only marginal amounts, reinforcing the highly concentrated nature of new‑construction activity in this segment.
New construction represented nearly 39% of all attached‑home sales in 2025—far higher than the roughly 11% share seen in the detached segment. That disparity speaks to a clear market pivot: with elevated rates and inflation pressuring affordability, buyers gravitated toward smaller, more attainable new homes, and builders responded accordingly. The attached segment became the primary outlet for new supply that could meet buyers at a workable price point.
Average prices add another layer to the story. Washington County—the dominant producer—actually saw its average new‑construction price dip year over year. Given its outsized influence, that decline helped pull down the aggregate pricing trend for the entire segment. Some of this softening may reflect the broader economic backdrop, including the localized effects of the Intel layoffs in Hillsboro, which introduced additional caution into the westside market. When the county that produces the majority of new attached homes experiences even a modest price shift, the impact shows up in the regional numbers.
Cumulative Days on Market
The bar chart below compares average cumulative days on market (CDOM) throughout 2025.
Average CDOM in 2025 followed a familiar seasonal pattern, but with a slightly longer tail than in tighter years. The winter months opened with elevated market times, reflecting both leftover 2024 inventory and the slower pace typical of the season. Conditions improved sharply in April—the low point for the year—as new listings were priced more competitively and buyers were more active. From there, CDOM settled into a middle band through summer and early fall, with only modest month‑to‑month movement.
The late‑year uptick is notable but not alarming. October posted one of the higher averages of the year, and November and December remained elevated compared to the spring lows. This pattern aligns with the broader dynamics shaping the segment: increased supply, more new‑construction options, and buyers taking more time to evaluate choices in a higher‑rate environment. The attached segment remained functional and well‑supplied, but the longer market times—especially compared to the spring trough—signal a market gradually easing toward buyer‑favored conditions.
The bar chart below compares cumulative days on market for 2024 and 2025.
The year‑over‑year comparison shows a clear shift toward longer market times in 2025. While both years follow the same seasonal rhythm—winter highs, a sharp spring improvement, and a gradual rise into fall—the 2025 bars sit noticeably higher through most of the calendar. The spring trough is still present, but it’s not as deep, and the summer and early‑fall months show some of the largest gaps between the two years. August, in particular, stands out as a moment where buyers took significantly more time than they did the year before.
This pattern aligns with the broader dynamics shaping the segment. Expanded inventory, a heavier flow of new‑construction options, and persistently high interest rates all contributed to a more deliberate pace among buyers. Homes still sold, but they required more exposure, more showings, and more patience from sellers. The late‑year months illustrate this well: 2025 remained elevated relative to 2024 even as new‑construction closings helped keep overall activity moving.
The following dual-axis chart illustrates two interrelated indicators of market health for single-family attached homes in the Portland Region throughout 2025: the number of active listings each day (green line, right axis) and the average daily Days on Market (DOM) of those active listings (red line, left axis):
This metric reflects the average current listing history (DOM) of the active inventory pool only—typically ranging from 400 to 650 units on any given day—and is distinct from cumulative DOM or final time-to-sale for closed transactions.
Because well-priced and competitively positioned properties sell quickly and exit the active pool, the average DOM is disproportionately influenced by lingering inventory. The chart therefore serves as a real-time snapshot of stale inventory levels, pricing discipline, and buyer selectivity across the year.
The chart reveals a clear inverse seasonal pattern between active inventory volume and average daily DOM.
Active listings (green) started the year relatively low (~400–450 units in January–February), rose steadily through spring and early summer to a peak of approximately 650–680 units (mid-May through July), then gradually declined into the 450–500 range by December. This mid-year swell reflects the typical seasonal influx of new listings, including a significant portion of newly completed townhomes and rowhouses.
Average daily DOM (red) moved in the opposite direction: beginning around 140 days in early January, it declined sharply through spring to a trough of ~90–95 days in late spring/summer, remained relatively stable through early fall, then rose gradually to ~110–115 days by year-end (with a brief dip in mid-November before the final uptick).
This inverse relationship is driven by compositional effects in the active pool. During the peak listing/closing season (late spring through summer), a higher volume of fresh, competitively priced units entered the market. These sold quickly, contributed little to the average DOM, and kept the metric low. In contrast, fall and winter saw fewer new listings and more selective buyers, allowing properties to linger longer. These stale units accumulated in the shrinking active pool and pulled the average DOM higher—particularly noticeable in the late-year rise despite thinning supply.
The pattern underscores a key takeaway for sellers and listing agents: misalignment on pricing or presentation can result in extended exposure, especially during lower-volume seasons.
Housing Supply
Months of supply (MOS) represents the number of months it would take to absorb current active inventory at the prevailing sales pace, assuming no new listings enter the market. The following bar chart shows MOS by calendar month for 2025:
Months of supply in 2025 moved within a relatively tight band, but the overall pattern points to a market operating with more breathing room than in prior years. The year opened with elevated supply levels, reflecting both leftover winter inventory and the steady flow of new construction that has become a defining feature of the attached segment. Conditions tightened briefly in February and April, but the broader trend is one of stability rather than compression.
Through the middle of the year, supply hovered around the four‑month mark—high enough to give buyers meaningful choice, but not so high as to signal oversupply. July and September posted some of the higher readings of the year, consistent with the slower pace reflected in the CDOM charts and the gradual softening seen in the pricing metrics. Even so, the market remained functional: listings continued to move, and the supply levels never drifted into territory that would indicate a breakdown in demand.
The late‑year dip in December is typical for the season, but it also reflects the influence of new‑construction closings, which helped keep inventory from accumulating as sharply as it might have in a purely resale‑driven environment.
The line graph below compares months of supply for 2024 (blue line) and 2025 (red line), with a full y-axis scale to show true proportional differences:
The year‑over‑year comparison shows a clear expansion in supply throughout 2025. While both years follow the same seasonal pattern—tightening in early spring, loosening through summer, and a modest late‑year dip—the 2025 line sits noticeably higher in nearly every month. The difference is especially pronounced from March through November, where supply levels in 2025 consistently ran one to two months above the prior year.
This shift reflects the combined influence of expanded inventory, a heavier flow of new‑construction listings, and a more deliberate pace among buyers navigating elevated interest rates. The attached segment remained orderly and functional, but the additional supply gave buyers more choice and more time, contributing to the longer market times seen in the CDOM charts. Even the December reading, while lower than the fall peak, remained above 2024 levels, underscoring how persistent the year‑over‑year increase was.
Overall, the comparison reinforces the broader theme of the annual: 2025 was a year where the attached segment operated with more breathing room. Supply didn’t spike into overshoot territory, but it expanded enough to shift the balance of leverage subtly toward buyers and to support the gradual softening visible in the pricing metrics.
HOA Dues
While not all attached homes are located in an HOA with mandatory dues, a significant number are:
# of Attached Homes Reporting HOA Dues
1,295
78.68% of Sales
The bar chart below compares average monthly HOA dues (for reporting sales) for 2024 and 2025:
HOA dues in the attached segment remained remarkably stable in 2025, especially compared to the sharp increases seen in the condo market. With nearly 79% of all attached‑home sales reporting dues, this is a meaningful metric for understanding the real carrying cost of the segment—and the year‑over‑year changes were modest. Most counties saw only small adjustments, and the regional pattern reflects a market where dues are largely predictable and tied to routine maintenance rather than major capital projects.
The county‑level shifts tell a nuanced story. Washington and Clackamas posted slight increases, consistent with normal operating‑cost inflation. Multnomah, by contrast, saw a small decline, which helped offset increases elsewhere and contributed to the segment’s overall affordability profile. The outlier counties—Columbia, Hood River, and Yamhill—show more volatility, but their sample sizes are too small to influence regional trends in any meaningful way.
What stands out most is how restrained these changes are. In a year where interest rates and inflation continued to pressure buyers, the stability of HOA dues provided a measure of predictability that helped support demand. This is especially important in a segment where dues are common and where buyers are often comparing attached homes not only to detached options but also to townhome‑style condos with much higher monthly obligations.
Overall, the HOA landscape in 2025 reinforces the broader theme of the annual: the attached segment remained one of the most accessible pathways into new or newer housing, with dues that stayed manageable even as other cost pressures mounted.
Histograms
Histograms offer a unique and powerful perspective on the attached homes market that traditional summary statistics and bar charts cannot fully capture: they reveal the underlying shape, spread, and clustering of the data, exposing patterns, skewness, tails, and bifurcations that averages and medians alone obscure.
The following histogram shows the distribution of sales price as a percentage of original list price in 2025:
The histogram of Sales Price to Original List Price (SP/OLP) ratios for 2025 attached home sales in the Portland Region reveals a strongly right-skewed distribution centered on high negotiation success for sellers, with the overwhelming majority of transactions closing at or very close to asking price.
The peak bin—98.0%–99.9% SP/OLP—contains 587 sales, or 35.66% of the total 1,646 transactions. This single bin alone accounts for more than one-third of all closings, underscoring how competitively positioned attached homes moved in 2025. The adjacent bins reinforce this: 96.0%–97.9% (229 sales, 13.91%), 94.0%–95.9% (194 sales, 11.79%), and 100.0%–101.9% (162 sales, 9.84%) together push the concentration around the 96–102% range to nearly half the market.
Cumulatively:
Approximately 46.8% of sales closed below 98% SP/OLP (771 transactions), indicating some level of negotiation or concessions in nearly half the market.
Roughly 45.5% closed between 98% and under 102% (a tight band around full price or slight premiums).
Only 7.65% was at or above 102% SP/OLP (above full asking), and just 0.79% reached ≥108%—showing limited instances of bidding wars or aggressive over-asking closes.
The left tail (below 90% SP/OLP) is thin: only ~10% of sales fell below 90%, and the extreme low end (<80%) is negligible (15 transactions total). This distribution reflects good seller leverage in the attached segment overall, but with clear evidence of buyer pushback in a softening environment: the modal (peak) outcome is 98–99.9% (modest concessions), and the right tail thins rapidly above 101.9%.
The following histogram shows the distribution of sales prices of attached homes in 2025:
The histogram of sales prices for single-family attached residential properties in the Portland Region during 2025 shows a classic bell-shaped distribution centered firmly in the mid-$400k range. The largest share of transactions—425 sales, or 25.82% of the total 1,646—closed in the $400,000–$439,999 bin, marking this as the clear peak for townhomes and rowhouses in suburban and edge-urban locations.
The distribution remains tightly concentrated around this peak. The bins immediately below and above—$360,000–$399,999 (274 sales, 16.65%) and $440,000–$479,999 (310 sales, 18.83%)—together account for an additional 35.48% of sales, meaning roughly 61% of all attached homes sold between $360,000 and $479,000. This narrow ~$120k window captures the vast majority of the market.
Lower price ranges taper off quickly. Below $400,000, only about 27.3% of sales occurred (449 transactions), and activity below $320,000 was minimal at just 3.58% (59 sales). The segment shows no meaningful volume in the low $200k range, with only 3 sales falling in the $200,000–$239,999 bin. On the upper end, volume in prices drop off sharply at or above $600,000, where just 7.9% of sales (130 transactions) took place, and only 16 sales reached or exceeded $960,000 (0.97%).
The slight left skew within the mid-range—more volume below $440,000 than above—aligns with the modest downward pressure seen in average and median prices and the more noticeable PPSF decline. This pattern reflects the influence of competitively priced new construction units entering the market and increased buyer selectivity amid higher months of supply and longer average marketing times.
The consistent floor at or above $320,000 for the dense portion of the distribution highlights the structural support in attached homes: fee-simple ownership of land and structure, minimum practical sizes for townhomes and rowhouses, and HOA/maintenance responsibilities that prevent the deep low-end pricing occasionally seen in condominiums or distressed detached properties.
The following histogram shows the distribution of price per square foot for attached homes in 2025:
The histogram of price per square foot (PPSF, based on total square footage) for single-family attached residential sales in the Portland Region during 2025 shows a strong central peak in the $250 to under $290 range, with the distribution skewed slightly left.
The two highest bins are tied: $250–$269 and $270–$289, each with 315 sales and 19.14% of the total 1,646 transactions. These two adjacent ranges together capture 38.28% of all closings, making the $250–$289 PPSF interval the clear core of the market for attached homes.
The peak concentration extends on either side:
Below the peak, the $230–$249 bin has 189 sales (11.48%), and the $290–$309 bin has 218 sales (13.24%).
Taken together, the four bins from $230 to $309 account for 63% of sales (1,037 transactions).
Lower PPSF ranges fall off steadily. Below $230 per square foot, only about 8.2% of sales occurred (135 transactions), with activity below $210 minimal at just 2.43% (40 sales). The extreme low end ($150–$169) has only 1 sale (0.06%).
On the upper end, PPSF drops off more quickly at $330. Sales at or above $330 per square foot represent roughly 18.53% of the market (305 transactions), with very thin volume above $410 (only 1.15% at $410–$429 and lower thereafter). Only 3 sales reached or exceeded $530 per square foot (0.18%).
The modest left skew within the mid-range—more volume in the $250–$289 peak and below than above—aligns with the compositional effects discussed earlier: average total square footage rose +2.60% to 1,598 SF, and the influx of newer, slightly larger units from construction helped pull representative PPSF levels lower.
The following histogram shows the distribution of age for attached homes in 2025:
The histogram of actual age (years since original construction) for single-family attached residential sales in the Portland Region during 2025 shows a strongly unimodal distribution with an overwhelming peak in very recent construction and a noticeable secondary concentration in properties originally built 18–26 years ago.
The dominant bin—0–2 years—contains 653 sales, or 39.67% of the total 1,646 transactions. This single range accounts for nearly 40% of all closings, reflecting the significant role new construction played in sustaining volume and freshness in the attached segment throughout 2025. The next few bins remain modest: 3–5 years (46 sales, 2.79%), 6–8 years (64 sales, 3.89%), 9–11 years (79 sales, 4.80%), and 12–14 years (31 sales, 1.88%). Together, properties 14 years old or newer represent roughly 53.04% of sales (873 transactions), underscoring how recent inventory dominated the market.
A secondary cluster appears in the 18–26 year range (original construction roughly 1999–2007), with notable peaks at 18–20 years (133 sales, 8.08%), 21–23 years (152 sales, 9.23%), and 24–26 years (121 sales, 7.35%). These three bins alone account for 24.66% of sales (406 transactions), representing the largest group of older attached homes that traded.
Beyond 26 years, volume drops off sharply and remains thin. Properties 27 years and older make up only 19.81% of sales (326 transactions), with no single bin exceeding 62 sales (27–29 years, 3.77%). The oldest group (≥57 years) has just 8 sales (0.49%), showing very limited turnover among truly vintage attached structures.
This unimodal pattern—39.67% under 3 years old—directly ties to the new construction influx discussed earlier: the surge in fresh units lowered average age to 15.69 years. The relative scarcity of mid-age (15–17 years) and older (27+ years) sales highlights how attached homes tend to cluster around building cycles rather than a smooth age distribution.
The following histogram shows the distribution of total square footage for attached homes in 2025:
The histogram of total square footage for single-family attached residential sales in the Portland Region during 2025 shows a clear central peak in the 1,500–1,599 SF range, with the distribution skewed slightly left within the mid-size band.
The dominant bin—1,500–1,599 SF—contains 335 sales, or 20.35% of the total 1,646 transactions. This single range captures the largest share of closings, reflecting the typical size for modern townhomes and rowhouses in the region.
The peak concentration extends on either side. The adjacent bins of 1,400–1,499 SF (198 sales) and 1,600–1,699 SF (207 sales) add another 24.61%. Taken together, the three bins from 1,400 to 1,699 SF account for 44.96% of sales (740 transactions), forming the core mid-size heart of the segment.
Lower square footage ranges taper off steadily. Below 1,400 SF, roughly 25.15% of sales occurred (414 transactions), with activity below 900 SF minimal.
On the upper end, square footage drops off more quickly above 1,700 SF. Sales at or above 1,700 SF represent 29.89% of the market (492 transactions), with volume thinning further at or above 2,000 SF to 11.66% (192 sales).
The consistent concentration around 1,400–1,699 SF highlights the practical size norms for attached homes: efficient layouts that balance livability, land constraints, and HOA/shared-element considerations without extending into the larger footprints common in detached single-family properties.
The following histogram shows the distribution of cumulative days on market for attached homes in 2025:
The histogram of cumulative days on market (CDOM) for single-family attached residential sales in the Portland Region during 2025 shows a distribution with a pronounced left-side peak in very short marketing times and a secondary spike in extremely long exposure, giving the appearance of bimodality when binned into 20 groups.
The dominant left-side peak falls in the 0–6 CDOM bin, with 314 sales or 19.08% of the total 1,646 transactions. This reflects the segment’s core of well-priced, competitively positioned properties that sell very quickly, often within the first week of listing.
The core short-to-moderate range (0–55 days) accounts for 59.17% of sales (974 transactions). This broad group covers everything from immediate sales to marketing times that draw closer to the regional average CDOM of 68.36 days.
Marketing times that approach the regional average and extend to about double that level (56–132 days) represent 25.09% of sales (413 transactions). These properties experienced extended exposure—often due to pricing, condition, location, or HOA-related factors—but still closed without reaching the extreme tail.
The long right-side tail (≥133 days) contains 259 sales or 15.74% of transactions. This extreme marketing time bookend captures the properties that lingered well beyond double the regional average, sometimes for hundreds of days (with the full spread in this bin reaching up to 2,017 days). When binned coarsely, this tail creates the visual appearance of a secondary mode at the far right, even though the underlying data is a long, continuous tail rather than a true symmetric peak.
The overall shape—strong concentration in very short CDOM, a moderate middle tail of extended but not extreme marketing times, and a notable spike in the long-tail extreme—reflects buyer selectivity in a softening environment. Well-positioned properties moved fast, while mispriced or challenged units (high HOA dues, outdated features, or location drawbacks) accumulated longer exposure, particularly in the ≥133 day group.
The following histogram shows the distribution of monthly HOA dues for attached homes in 2025:
The histogram of monthly HOA dues (for properties reporting non-zero dues) in single-family attached residential sales in the Portland Region during 2025 shows a strong central peak in the $150–$179 range, with the distribution skewed slightly right within the mid-to-higher dues band.
The dominant bin—$150–$179—contains 245 sales, or 18.92% of the 1,295 transactions reporting non-zero HOA dues. This single range captures the largest share of closings, reflecting the typical monthly fee level for attached homes with mandatory associations in the region.
The peak concentration extends on either side. The adjacent bins of $120–$149 (59 sales, 4.56%) and $180–$209 (166 sales, 12.82%) add another 17.37%. Taken together, the three bins from $120 to $209 account for 36.29% of reported dues sales (470 transactions), forming the core mid-range heart of the distribution.
Lower dues ranges taper off steadily. Below $150 per month, roughly 21.31% of sales occurred (276 transactions), with activity below $90 minimal.
On the higher end, dues drop off more quickly above $300. Sales at or above $300 per month represent 25.87% of the market (335 transactions), with volume thinning further at or above $420 (only 9.96%, 129 sales). Only 33 sales reached or exceeded $570 per month (2.55%).
The distribution is left-skewed—more volume in the $150–$209 peak and below than above—aligns with the modest HOA increase observed earlier (+1.18% to $236.84 average). This pattern reflects the prevalence of moderate dues in newer and suburban attached communities, where associations provide amenities without escalating to condo-like levels.
The consistent concentration around $150–$209 highlights the practical dues norms for attached homes: fees that cover shared maintenance and amenities while remaining manageable for buyers, especially compared to the sharper increases seen in the condominium segment.
Miscellaneous Statistics & Standout Transactions
Here are some of the most notable outliers and extremes from the 2025 Portland Region attached homes market—numbers that illustrate the full range of the data and the extremes buyers and appraisers encounter.
Lowest Sales Price: $215,000—3-bedroom, 2.1-bathroom unit. The lowest price was obtained by a fixer townhouse in Portland that closed as a cash sale. Unlike the condo and detached segments of the housing market, attached homes have a much higher “floor” of prices. The 1,224-sq. ft. home was purchased by a flipper and renovated. Photos of this property (in its renovated state) are currently available online.
Highest Sales Price: $1,745,000—The highest price obtained by an attached home in 2025 was a new construction property in Lake Oswego. The attached home is 3,390 sq. ft. and has 4 bedrooms and 5 bathrooms. The interior has high-quality finishes. Photos of this property are currently available online.
Lowest Price Per Square Foot: $154.99—The lowest price was obtained by a fixer townhouse in Portland that sold for $460,000. The property is 2,968 sq. ft. and has 3 bedrooms and 3.1 bathrooms. The home needed a lot of work and sold to a flipper who later obtained $759,490 for the renovated townhome. Photos of this property (in its renovated state) are currently available online.
Highest Price Per Square Foot: $597.61—5-bedroom, 2.1-bathroom. The highest price was obtained by a modern townhouse in Hood River that sold for $1,500,000. The property has good views of the Columbia River. Photos of this property are currently available online.
Longest CDOM: 2,017 days—3-bedroom, 2.1-bathroom end-unit townhome-style in Sandy (Clackamas County). This property had a curious listing history. It was a new construction in a subdivision but apparently was held back from sale by the builder; perhaps as a model to show as the other units sold. Portland Appraisal Blog tried to reach out to the agents. The buyer’s agent did respond, but didn’t have much information to share. The agent did confirm the unit was rented at the time of the sale. So, it’s possible someone connected to the builder was occupying the unit as a rental until the subdivision finally sold out. Photos of this property are currently available online.
Smallest Attached Home: 655 SF—1-bedroom, 1-bathroom unit in King City (Washington County). This property sold in an age-restricted (55+) community. The home sold for $245,000 and had reported monthly HOA dues of $186. Photos of this property are currently available online.
Largest Attached Home: 3,510 SF—4-bedroom, 4.2-bathroom townhouse in Lake Oswego. This property is a newer construction and sold for $1,585,000. The townhome has quality finishes. Photos of this property are currently available online.
Largest Lot: 0.26 acres—2-bedroom, 2-bathroom townhouse in Wilsonville (Clackamas County). The property is located in the the golf course community Charbonneau and sold for $750,000. Photos of this property are currently available online.
Highest Monthly HOA Dues: $840—3-bedroom, 2.1-bathroom attached home in Portland. The home is 3,373 sq. ft. The high dues cover exterior elements of the property, such as stucco siding and the roof, as well as landscaping. In addition, there is a semiannual $400 charge that covers trails, playground, and community events. Photos of this property are currently available online.
Highest Monthly HOA Dues Per SF: $0.63—2-bedroom, 1-bathroom end-unit property. The home is 1,092 sq. ft. with monthly HOA dues of $693. While the home sold for $262,400, the HOA dues are a reminder that monthly carrying costs for some relatively low-priced units can be drastically affected by HOA dues. Photos of this property are currently available online.
With the regional aggregate trends, graphs, monthly patterns, histogram analysis, and notable outliers covered, the remainder of this update turns to a county-level breakdown. The following sections present year-over-year comparisons for each of the six counties in the Portland Region—Multnomah, Washington, Clackamas, Yamhill, Columbia, and Hood River. Each county snapshot includes key metrics, commentary on local drivers, and any segment-specific observations that help explain broader regional patterns.
Multnomah County 2025 Stats
Multnomah County, encompassing the City of Portland and its immediate surroundings, accounted for 24.97% of all attached‑home sales in the region in 2025, making it the second‑largest contributor behind Washington County and serving as the secondary hub of the regional attached homes segment.
The table below summarizes key metrics for Multnomah County attached single-family residential sales in 2025 compared with 2024.
Category
2024
2025
% Change
Total $ Volume
$169.0 Million
$190.3 Million
+12.64%
Average Price
$445,867
$463,103
+3.87%
Median Price
$399,900
$415,995
+4.02%
Avg SP/OLP
97.30%
97.62%
+0.33%
Avg PPSF (TSF)
$311.47
$299.50
-3.85%
Avg HOA Dues
$244.45
$225.72
-7.66%
Avg Age (Yrs)
17.00
14.34
-15.67%
Avg CDOM
65.38
59.98
-8.26%
Avg Total SF
1,476
1,582
+7.18%
Total # of Sales
379
411
+8.44%
# of New Constr.
125
169
+35.20%
# of REOs
2
3
+50.00%
# of Short Sales
1
0
-100.00%
Note: The calculated average HOA dues is for units reporting HOA dues (216 sales). All other metrics use the full dataset (411 sales). Single-Family Attached Residential | 2024 & 2025 Data: RMLS | PortlandAppraisalBlog.com
The segment posted a solid year overall, with both sales volume and prices moving higher. Total dollar volume rose nearly 13%, supported by an 8% increase in closed sales and a modest gain in both average and median prices. (Newer and slightly larger homes also contributed to the increase.) The pricing environment here was steadier than in some of the surrounding counties, reflecting a mix of infill development, established neighborhoods, and a broad range of attached‑home types. The yearly gains meant that sellers netted nearly an additional $22 million—almost the exact increase in new construction dollar volume gains.
A few metrics stand out. New‑construction activity increased sharply, rising more than 35% year over year, and helped pull the average age of sold homes down meaningfully. That younger inventory mix also contributed to the increase in average square footage, which climbed more than 7%. Market times improved as well, with average CDOM falling by about 8%, suggesting that buyers responded to the refreshed inventory and more competitive pricing.
Multnomah was also one of the few counties where HOA dues declined, offering a small but notable affordability offset in a year where carrying costs remained top of mind for buyers. The slight improvement in the average sale‑to‑original‑list‑price ratio reinforces the picture of a segment that remained orderly and well‑priced, even as the broader market shifted toward more balanced conditions.
Overall, Multnomah’s attached‑home market in 2025 was defined by steady demand, a meaningful infusion of newer product, and pricing that moved upward without overheating—an environment that helped anchor the region’s overall performance.
The following table shows the geographic distribution of attached homes sales in Multnomah County:
The city distribution inside Multnomah County shows a market anchored almost entirely by Portland and Gresham, which together account for more than 93% of all attached‑home sales in 2025. Portland represents nearly 60% of the county’s activity and continues to set the pricing tone. Its higher average price and significantly higher PPSF reflect closer‑in locations, infill townhome development, and a broader mix of attached product types. The size profile of Portland’s inventory adds important context: resales averaged 1,654 square feet, while new‑construction attached homes averaged 1,233 square feet. That gap helps explain why Portland’s PPSF remains elevated even as its average price sits between the region’s most expensive and most affordable cities. The newer product coming online is smaller and designed to meet buyers at a more attainable price point. Because all new construction outside Gresham occurred in Portland, this mix of smaller new units and larger resale units plays a direct role in shaping the countywide averages for age, size, and PPSF.
Gresham plays a very different but equally important role. It contributed 138 sales, representing more than a third of the county’s total, and delivered 105 new‑construction closings in 2025. That pipeline makes Gresham the county’s primary source of newer, larger, and more affordably priced attached homes. The size profile here moves in the opposite direction of Portland: new‑construction attached homes averaged 1,652 square feet, while resales averaged 1,543 square feet. The newer product is not only larger but also positioned at a lower price point, which helps explain Gresham’s lower average price and PPSF despite its substantial share of total sales. It is the part of the county where buyers can still find newer, larger homes at approachable price levels, and that affordability profile is a major reason Gresham continues to carry so much of the county’s volume.
Fairview, Troutdale, and Lake Oswego contribute only small numbers of sales, and their averages move around more because of their limited sample sizes. They do not materially influence the countywide trends, but they round out the picture of a county where the attached‑home market is highly concentrated in two cities with distinct roles. Portland drives pricing and sheer volume, while Gresham drives new‑construction activity and affordability. Together, they explain the shape and direction of Multnomah County’s attached‑home segment in 2025, and the size differentials between new and resale product in each city help clarify why the countywide metrics moved the way they did.
The following is a scatter plot of all Multnomah County sales in 2025 (sales price vs. date of sale):
The scatter plot for Multnomah County shows why the county’s pricing metrics can rise year over year while PPSF still trends downward. The overall level of prices is higher than in 2024, and the upper half of the distribution remains well populated throughout the year. But the tilt in the cloud of points is unmistakable: the early‑year sales sit slightly higher on the vertical axis, while the later‑year sales settle into a lower band. That downward slope mirrors the modest softening seen in the regional charts and helps explain why PPSF declined even as average and median prices increased.
The pattern suggests that the market was still capable of producing higher‑end sales, but those sales were more common earlier in the year. As the year progressed, the mix shifted toward more mid‑range transactions, and the upper‑end outliers became less frequent. Because PPSF is sensitive to both price and size, this subtle change in the distribution is enough to pull the metric down even in a year where total dollar volume and average price moved higher.
Washington County 2025 Stats
Washington County is the largest attached‑home market in the region, accounting for over half of all attached‑home activity.
The table below summarizes key metrics for Washington County attached single-family residential sales in 2025 compared with 2024.
Category
2024
2025
% Change
Total $ Volume
$368.1 Million
$393.4 Million
+6.88%
Average Price
$454,999
$445,530
-2.08%
Median Price
$444,900
$438,500
-1.44%
Avg SP/OLP
98.17%
96.88%
-1.31%
Avg PPSF (TSF)
$298.25
$289.02
-3.09%
Avg HOA Dues
$232.82
$238.75
+2.55%
Avg Age (Yrs)
15.61
15.30
-1.95%
Avg CDOM
53.66
67.35
+25.50%
Avg Total SF
1,546
1,562
+1.06%
Total # of Sales
809
883
+9.15%
# of New Constr.
295
393
+33.22%
# of REOs
1
3
+200.00%
# of Short Sales
0
1
—
Note: The calculated average HOA dues is for units reporting HOA dues (807 sales). All other metrics use the full dataset (393 sales). Single-Family Attached Residential | 2024 & 2025 Data: RMLS | PortlandAppraisalBlog.com
Washington County is the dominant attached‑home market in the region, accounting for 883 of the 1,646 attached‑home sales in 2025, or 53.65% of all activity. Total dollar volume rose to $393.4 million, an increase of $25.3 million from 2024, even though both the average and median prices declined slightly. The average price dipped to $445,530, and the median settled at $438,500, reflecting a shift in the mix and a softer demand environment. The county’s pricing metrics were likely influenced in part by the well‑publicized Intel layoffs, which introduced uncertainty into the westside employment base. Buyers facing job instability or reduced confidence are less likely to enter the market, and that dynamic can reduce upward pricing pressure even when sales volume remains strong.
Sales activity itself increased by 74 transactions, and new‑construction closings rose from 295 to 393, showing that supply continued to expand. But pricing softened across several indicators. The average sale‑to‑original‑list‑price ratio declined from 98.17% to 96.88%, and average PPSF fell from $298.25 to $289.02. Market times lengthened meaningfully, with average CDOM rising from 53.66 to 67.35 days. These shifts align with a market where buyers had more options, sellers had to price more competitively, and some households delayed purchases due to employment uncertainty.
The following table shows the geographic distribution of attached homes sales in Washington County:
City
Avg Price
Avg PPSF
# of Sales
% of Sales
Beaverton
$408,094
$288.73
200
22.65%
Cornelius
$411,946
$271.49
35
3.96%
Forest Grove
$423,374
$281.61
39
4.42%
Hillsboro
$455,385
$287.30
275
31.14%
King City
$378,550
$309.58
10
1.13%
North Plains
$414,390
$276.66
20
2.27%
Portland
$473,309
$304.04
150
16.99%
Sherwood
$420,754
$278.29
28
3.17%
Tigard
$477,425
$294.01
87
9.85%
Tualatin
$493,246
$265.78
39
4.42%
Avg/Sum
$445,530
$289.03
883
—
The city‑level distribution shows how varied Washington County’s attached‑home segment is. Hillsboro and Beaverton together produced 475 sales, more than half of the county’s total. Hillsboro alone delivered 275 sales, including 175 new‑construction closings, making it the county’s largest source of new supply. Beaverton contributed 200 sales, with 29 of them new construction, and posted an average price of $408,094. The unincorporated portion of Washington County with a Portland address added 150 sales at an average of $473,309, and Tigard contributed 87 sales at $477,425. The remaining cities—Cornelius, Forest Grove, King City, North Plains, Sherwood, and Tualatin—each play smaller roles but collectively round out the county’s mix of attached‑home product.
New construction is central to understanding Washington County’s 2025 results. The county delivered 393 new‑construction sales, and those units averaged 1,631 square feet, compared to 1,507 square feet for resales. The size differential is consistent across most cities. Hillsboro’s new construction averaged 1,627 square feet, while its resales averaged 1,564. Tigard’s new construction averaged 1,685 square feet, compared to 1,597 for resales. Tualatin’s new construction averaged 1,900 square feet, while its resales averaged 1,653. These larger new units help explain why the countywide average square footage increased slightly even as prices softened. The age profile also reflects this dynamic: the average year built for new construction was 2025, while the resale stock averaged 1998, producing a blended countywide age of 15.30 years.
The PPSF patterns across cities align with the size and age mix. Portland, Tigard, and King City posted the highest PPSF figures—$304.04, $294.01, and $309.58, respectively—while Cornelius, Forest Grove, and Tualatin posted lower PPSF values tied to larger average sizes and newer construction. The countywide PPSF decline of $9.23 year over year reflects a shift toward larger, newer units and a softer demand environment rather than a broad price reset.
Overall, Washington County’s attached‑home market in 2025 was defined by expanding new‑construction activity, a modest softening in pricing metrics, and a meaningful increase in market times. As the region’s largest and most diverse attached‑home segment, Washington County’s mix of substantial new supply, shifting buyer sentiment, and employment‑related uncertainty explains nearly all of the year‑over‑year changes in price, PPSF, size, and CDOM.
The following is a scatter plot of all Washington County sales in 2025 (sales price vs. date of sale):
The Washington County scatter plot shows a pattern that aligns closely with the county’s year‑over‑year pricing results. Prices are still capable of reaching the upper ranges, but the distribution of sales shifts noticeably as the year progresses. Early‑year transactions include more sales in the higher price bands, while the later months show a denser cluster in the mid‑range. That subtle downward tilt in the cloud of points mirrors the countywide decline in both average price and PPSF.
The shape of the scatter also reflects the softer demand environment that emerged during the year. Washington County absorbed a significant number of Intel‑related layoffs, and employment uncertainty tends to reduce the number of buyers willing to stretch into higher price tiers. Even though total sales increased to 883, the composition of those sales changed. Fewer upper‑end transactions later in the year, combined with a larger share of mid‑range new‑construction closings, naturally pulled the averages down.
This shift in the distribution helps explain why PPSF fell from $298.25 to $289.02 even as the county delivered 393 new‑construction units averaging 1,631 square feet. Larger new homes at mid‑range prices, paired with fewer late‑year high‑end sales, create exactly the kind of tilt visible in the scatter.
Taken together, the scatter reinforces the broader story: Washington County remained active and productive, but the momentum softened as the year went on, and the mix of sales shifted just enough to influence the countywide pricing metrics.
Clackamas County 2025 Stats
Clackamas County is the region’s third‑largest attached‑home market.
The table below summarizes key metrics for Clackamas County attached single-family residential sales in 2025 compared with 2024.
Category
2024
2025
% Change
Total $ Volume
$155.2 Million
$146.0 Million
-5.96%
Average Price
$500,739
$506,874
+1.23%
Median Price
$464,980
$454,993
-2.15%
Avg SP/OLP
98.21%
96.79%
-1.45%
Avg PPSF (TSF)
$297.67
$288.54
-3.07%
Avg HOA Dues
$243.36
$252.08
+3.58%
Avg Age (Yrs)
16.59
17.75
+7.03%
Avg CDOM
69.84
84.50
+20.98%
Avg Total SF
1,693
1,747
+3.21%
Total # of Sales
310
288
-7.10%
# of New Constr.
84
74
-11.90%
# of REOs
0
1
—
# of Short Sales
1
1
0.00%
Note: The calculated average HOA dues is for units reporting HOA dues (249 sales). All other metrics use the full dataset (288 sales). Single-Family Attached Residential | 2024 & 2025 Data: RMLS | PortlandAppraisalBlog.com
Clackamas County accounted for 288 of the 1,646 attached‑home sales in 2025, or 17.50% of all activity, and about 19.25% of total dollar volume at $146.0 million. Compared to 2024, total volume slipped by $9.2 million, and sales declined from 310 to 288, even as the average price edged up from $500,739 to $506,874. The median price moved the other direction, dipping from $464,980 to $454,993, which points to a subtle shift in the mix rather than a broad upward push in pricing. At the same time, the average sale‑to‑original‑list‑price ratio eased from 98.21% to 96.79%, average PPSF fell from $297.67 to $288.54, and average CDOM stretched from 69.84 to 84.50 days, all consistent with a market that required more negotiation and more time to get to closing.
The following table shows the geographic distribution of attached homes sales in Clackamas County:
The city‑level distribution shows how segmented the Clackamas attached‑home market is. Happy Valley is the clear volume anchor, with 73 sales and 25.35% of the county’s activity at an average price of $457,235. Wilsonville follows with 50 sales and 17.36% of the market at a much higher average price of $615,189 and an average PPSF of $334.38. Lake Oswego contributes 34 sales at the top of the price spectrum, with an average of $741,039 and the highest PPSF in the public table at $358.45. Sandy adds 29 sales at an average of $369,457, while Oregon City, Milwaukie, and West Linn each contribute between 18 and 22 sales, with average prices ranging from the mid‑$400,000s to the low‑$500,000s. Canby, Clackamas, and Damascus round out the core group with smaller shares and more moderate pricing. Together, these cities create a county profile that spans everything from more affordable suburban product to some of the region’s highest‑priced attached homes.
New construction plays a smaller but still important role in Clackamas than in Washington County. Countywide, new‑construction closings declined from 84 in 2024 to 74 in 2025. New‑construction activity was highly concentrated: Happy Valley delivered 49 new‑construction sales, Milwaukie added 16, and smaller numbers appeared in Lake Oswego, Molalla, Oregon City, West Linn, and Wilsonville. On average, new‑construction attached homes in Clackamas closed at $518,360, with an average size of 1,776 square feet and an average PPSF of $286.66. Resales, by comparison, averaged $502,902, 1,737 square feet, and $289.20 per square foot. The countywide averages—$506,874, 1,747 square feet, and $288.54 per square foot—sit right between those two cohorts, which is exactly what you would expect from a blend of slightly larger, newer units and a somewhat older resale stock. The average year built for resales is 2001 and 2025 for new construction, which translates to a combined average age of 17.75 years in the county summary.
Overall, Clackamas County’s attached‑home market in 2025 was defined by slightly higher average prices, softer PPSF, longer market times, and a modest pullback in both total sales and new‑construction volume. The county remains a meaningful share of the regional attached‑home segment, offering a wide range of price points and product types, from more affordable options in places like Canby, Sandy, and Damascus to high‑end attached homes in Lake Oswego and Wilsonville that sit near the top of the regional price spectrum
The following is a scatter plot of all Clackamas County sales in 2025 (sales price vs. date of sale):
The Clackamas County scatter plot shows a distribution that aligns closely with the county’s year‑over‑year results. Prices remain capable of reaching the upper ranges—including a handful of sales above the one‑million‑dollar mark—but the bulk of activity sits between the mid‑$300,000s and the mid‑$600,000s. What stands out is the subtle shift in the mix as the year progresses. Early‑year sales include more transactions in the higher price bands, while the later months show a denser cluster in the middle of the range. That tilt in the cloud of points mirrors the countywide decline in PPSF from $297.67 to $288.54, even as the average price increased slightly to $506,874.
The scatter also reflects the broader softening visible in the county’s other metrics. Market times lengthened to 84.50 days, the sale‑to‑original‑list‑price ratio eased to 96.79%, and total sales slipped from 310 to 288. Fewer upper‑end transactions later in the year, combined with a modest reduction in new‑construction closings, naturally pull the averages down and help explain why PPSF declined despite a small increase in average square footage.
Taken together, the scatter reinforces the same theme present throughout the Clackamas section: the market remained active and capable of producing higher‑end sales, but the momentum softened as the year went on, and the composition of sales shifted just enough to influence the countywide pricing metrics.
Yamhill County 2025 Stats
Yamhill is a largely rural county and consequently had less than 2% of the attached home sales volume.
The table below summarizes key metrics for Yamhill County attached single-family residential sales in 2025 compared with 2024.
Category
2024
2025
% Change
Total $ Volume
$12.47 Million
$10.16 Million
-18.47%
Average Price
$389,559
$390,922
+0.35%
Median Price
$397,500
$379,305
-4.58%
Avg SP/OLP
96.54%
97.22%
+0.70%
Avg PPSF (TSF)
$276.62
$294.25
+6.37%
Avg HOA Dues
$108.16
$125.12
+15.69%
Avg Age (Yrs)
24.25
27.96
+15.31%
Avg CDOM
64.84
57.85
-10.79%
Avg Total SF
1,454
1,370
-5.74%
Total # of Sales
32
26
-18.75%
# of New Constr.
3
0
-100.00%
# of REOs
1
0
-100.00%
# of Short Sales
1
0
-100.00%
Note: The calculated average HOA dues is for units reporting HOA dues (14 sales). All other metrics use the full dataset (26 sales). Single-Family Attached Residential | 2024 & 2025 Data: RMLS | PortlandAppraisalBlog.com
Yamhill County is a very small slice of the regional attached‑home market, with 26 sales in 2025, or 1.58% of all attached‑home transactions and about 1.34% of total dollar volume at $10.16 million. With such a limited sample, year‑over‑year changes need to be read cautiously, but a few patterns are still clear. Total sales fell from 32 to 26, and volume declined by about $2.3 million, yet the average price held essentially flat at $390,922, and the median price slipped to $379,305. At the same time, average PPSF increased from $276.62 to $294.25, average size declined from 1,454 to 1,370 square feet, and average CDOM improved from 64.84 to 57.85 days, suggesting that the smaller number of sales that did occur tended to be slightly smaller, higher‑priced on a per‑square‑foot basis, and reasonably well absorbed.
The following table shows the geographic distribution of attached homes sales in Yamhill County:
The city breakdown underscores how concentrated the activity is. McMinnville accounts for 14 of the 26 sales at an average price of $419,444 and an average PPSF of $295.67, while Newberg adds 8 sales at $363,050 and $303.01 per square foot. Dayton contributes 2 sales, and Sheridan and Yamhill each contribute 1, with averages that can move significantly based on a single transaction. Across the county, the average year built is 1997, the average home size is 1,370 square feet, and there were no new‑construction closings in 2025, so all of the metrics reflect a purely resale market.
The following is a scatter plot of all Yamhill County sales in 2025:
The Yamhill County scatter plot reflects the realities of a very small market, where individual transactions can influence the yearly metrics more than in larger counties. Most sales cluster between the low‑$300,000s and the mid‑$400,000s, with only a few points extending above that range. The distribution remains relatively steady throughout the year, without a pronounced early‑year or late‑year tilt, which is consistent with the county’s stable average price of $390,922 and the modest decline in median price. With no new‑construction closings in 2025, every point on the chart represents resale activity.
Overall, the scatter reinforces the same theme present in the county tables: Yamhill’s attached‑home segment is small, steady, and shaped more by the specific properties that come to market than by large‑scale trends.
Columbia County 2025 Stats
Columbia is a largely rural county and therefore had little of the attached home sales volume.
The table below summarizes key metrics for Columbia County attached single-family residential sales in 2025 compared with 2024.
Category
2024
2025
% Change
Total $ Volume
$3.71 Million
$8.42 Million
+127.06%
Average Price
$412,222
$366,253
-11.15%
Median Price
$385,000
$370,000
-3.90%
Avg SP/OLP
98.39%
95.72%
-2.72%
Avg PPSF (TSF)
$262.59
$254.94
-2.91%
Avg HOA Dues
$118.33
$21.25
-82.04%
Avg Age (Yrs)
17.44
16.52
-5.29%
Avg CDOM
54.78
58.74
+7.23%
Avg Total SF
1,570
1,451
-7.56%
Total # of Sales
9
23
+155.56%
# of New Constr.
0
4
—
# of REOs
0
0
—
# of Short Sales
0
0
—
Note: The calculated average HOA dues is for units reporting HOA dues (2 sales). All other metrics use the full dataset (23 sales). Single-Family Attached Residential | 2024 & 2025 Data: RMLS | PortlandAppraisalBlog.com
Columbia County’s attached‑home market is still very small in absolute terms, but it was noticeably more active in 2025. The county recorded 23 sales, up from 9 the prior year, which works out to 1.40% of all attached‑home sales in the region and about 1.11% of total dollar volume at $8.42 million. Because the 2024 baseline was so low, the jump in volume and sales count produces large percentage increases, even as the average price moved down from $412,222 to $366,253 and the median price slipped to $370,000. Average PPSF edged down to $254.94, the sale‑to‑original‑list‑price ratio softened to 95.72%, and average CDOM rose slightly to 58.74 days, all consistent with a market that had more activity but also required a bit more flexibility from sellers.
The following table shows the geographic distribution of attached homes sales in Columbia County:
City
Avg Price
Avg PPSF
# of Sales
% of Sales
Columbia City
$505,000
$336.22
1
4.35%
Rainier
$352,500
$282.21
4
17.39%
Scappoose
$404,051
$237.18
4
17.39%
St. Helens
$349,472
$246.43
14
60.87%
Avg/Sum
$366,253
$254.95
23
—
Most of the county’s attached‑home sales occurred in St. Helens, which accounted for 14 of the 23 closings at an average price of $349,472. Rainier and Scappoose each added 4 sales, and Columbia City contributed a single transaction at a higher price point of $505,000. New construction appeared in the segment, with 4 new‑construction closings split between Rainier and St. Helens, but the market remains predominantly resale. With such a small sample, individual projects and one‑off sales can move the averages more than in the larger counties, so the Columbia County figures are best read as a snapshot of activity rather than a definitive trend.
The following is a scatter plot of all Columbia County sales in 2025:
The Columbia County scatter plot reflects a small but more active market in 2025. With only 23 sales, each transaction has a noticeable influence on the overall pattern, and the chart shows a fairly even spread of prices throughout the year. Most sales cluster between the mid‑$200,000s and the mid‑$400,000s, with a few points extending above that range. There isn’t a clear early‑year or late‑year shift, which aligns with the county’s average price of $366,253 and the modest change in median price.
The appearance of a few new‑construction sales is visible in the upper portion of the scatter, but the market remains predominantly resale, and the distribution largely reflects the specific homes that happened to close rather than any broader trend. The slight increase in market times and the softer sale‑to‑list‑price ratio are consistent with what the chart shows: steady activity, modest variability, and no pronounced directional movement.
Overall, the scatter simply illustrates a small segment that became more active in 2025 without showing a strong price trajectory in either direction.
Hood River County 2025 Stats
Hood River is a largely rural county and therefore had little of the attached home sales volume.
The table below summarizes key metrics for Hood River County attached single-family residential sales in 2025 compared with 2024.
Category
2024
2025
% Change
Total $ Volume
$6.65 Million
$10.11 Million
+52.04%
Average Price
$738,981
$674,147
-8.77%
Median Price
$645,000
$650,000
+0.78%
Avg SP/OLP
96.70%
92.90%
-3.93%
Avg PPSF (TSF)
$433.30
$354.77
-18.12%
Avg HOA Dues
$118.04
$103.68
-12.17%
Avg Age (Yrs)
8.33
13.80
+65.60%
Avg CDOM
34.89
81.33
+133.12%
Avg Total SF
1,747
1,902
+8.88%
Total # of Sales
9
15
+66.67%
# of New Constr.
2
0
-100.00%
# of REOs
0
0
—
# of Short Sales
0
0
—
Note: The calculated average HOA dues is for units reporting HOA dues (7 sales). All other metrics use the full dataset (15 sales). Single-Family Attached Residential | 2024 & 2025 Data: RMLS | PortlandAppraisalBlog.com
Hood River County is a tiny but high‑priced slice of the attached‑home market, with 15 sales in 2025—about 0.91% of regional transactions and 1.33% of total dollar volume at $10.11 million. Compared to 2024, both sales count and volume increased (from 9 to 15 closings and from $6.65 million to $10.11 million), but the average price moved down from $738,981 to $674,147, while the median price held essentially flat at $650,000. Average PPSF declined from $433.30 to $354.77, average size increased to 1,902 square feet, and average CDOM more than doubled to 81.33 days, all consistent with a small market that saw more, larger sales but required more time and negotiation to get them closed.
The following table shows the geographic distribution of attached homes sales in Hood River County:
Activity is split between just two locations. Hood River accounts for 10 of the 15 sales at an average price of $803,900 and an average PPSF of $414.33, while Cascade Locks contributes 5 sales at a much lower average price of $414,640 and $235.65 per square foot. There were no new‑construction closings in 2025, so all of the metrics reflect resale activity. With such a limited sample, the county’s figures are best read as a snapshot of what happened to sell in a given year rather than a definitive statement about long‑term trends.
The following is a scatter plot of all Hood River County sales in 2025 (sales price vs. date of sale):
The Hood River County scatter plot reflects a small but active segment, with 15 sales spread fairly evenly across the year. Most transactions fall between the mid‑$400,000s and the mid‑$900,000s, with a few higher‑priced outliers that are typical for this market. The distribution doesn’t show a pronounced early‑year or late‑year shift, which aligns with the county’s stable median price of $650,000 and the modest decline in the average.
Because all 2025 activity was resale and the sample size is limited, the scatter mainly illustrates the mix of properties that happened to close rather than a directional trend. The wider range of prices compared to the other small counties is consistent with Hood River’s higher overall price structure, but the chart itself remains steady and without a clear slope.
Overall, the scatter simply reinforces the nature of this segment: small, high‑priced, and shaped more by individual transactions than by broad market movement.
Closing Thoughts
Taken together, the 2025 attached‑home markets across the Portland Region tell a consistent story. Activity remained steady, but the momentum softened as the year went on, and most counties saw some combination of longer market times, lower sale‑to‑list ratios, and modest shifts in pricing. New construction played an outsized role in Washington and Clackamas Counties, while the smaller counties moved largely on the strength of whatever resale inventory happened to come to market. Prices didn’t collapse, but they also didn’t accelerate—instead, the region settled into a more balanced posture, shaped by higher inventory, more negotiation, and a clearer separation between early‑year and late‑year conditions.
The scatter plots reinforce this broader theme: the market was functional and capable of producing higher‑end sales, but the distribution of those sales changed over the course of the year. Some counties saw a tilt toward mid‑range transactions, others simply reflected their small sample sizes, and the larger counties showed the gradual easing that defined the regional trend.
Overall, 2025 was a year of normalization. The market remained active, but buyers had more room to move, sellers had to price with greater precision, and the data across all six counties points to a landscape that is stable, slower, and more sensitive to mix than in the years that preceded it.
What trends do you expect to see in 2026? I’d love to hear your thoughts—feel free to reply here or reach out directly.
Sources & Further Reading
All data presented in this annual review is sourced directly from RMLS and has been subjected to my rigorous cleaning and validation process to ensure reliability for single-family attached residential analysis in the six-county Portland Region. The trends, comparisons, and commentary are the result of original appraisal expertise and independent analysis—not aggregated from secondary sources or news summaries.
External Obsolescence in Hillsboro — Residential Market Response to Intel’s 2024–2025 Workforce Reductions: Portland Appraisal Blog
Portland Affordability Index – PABAI: A Realistic Housing Qualification Metric for the Portland Region: Portland Appraisal Blog
Coda
Thanks for reading—I hope you found a useful insight or an unexpected nugget along the way. If you enjoyed the post, please consider subscribing for future updates.
Are you an agent in Portland who wonders why appraisers always do “x”?
A homeowner with questions about appraiser methodology?
If so, feel free to reach out—I enjoy connecting with market participants across Portland and the surrounding counties, and am always happy to help where I can.
And if you’re in need of appraisal services in Portland or anywhere in the Portland Region, we’d be glad to assist.
The 2025 Portland Region condo market softened modestly, with median prices down -3.0% to $325,000 and CDOM up +32% to 102 days. Rising HOA dues (+13%) and high rates increased pressure on buyers, while urban Portland dominated 61% of sales. Detailed analysis, histograms, county breakdowns, appraisal insights, and more.
The Portland Skyline at dusk with the majestic Mount Hood in the distance. Via Canva Pro
The Portland-area condominium market in 2025 continued its multi-year softening trend, with average and median prices down modestly year-over-year.
Higher interest rates remained a persistent constraint on purchasing power, while rising HOA dues in many complexes increased the effective monthly payment burden. These combined pressures made qualification more challenging and prompted greater selectivity among active buyers—some deferred purchases, waited for concessions, or walked from listings with elevated carrying costs.
Despite these headwinds, the condo segment as a whole stayed moderately affordable relative to the HUD MSA median household, and total sales volume declined only modestly year-over-year. The more telling indicators of shifting dynamics were the continued rise in average months of supply and the substantial increase in cumulative days on market—both pointing to reduced urgency and a more buyer-favored environment, particularly in areas with long-term oversupply such as the Pearl District and Portland Downtown neighborhoods .
While the condo market has been battered over the last few years, it continues to function. Units are getting sold—just taking longer—so this is not a story of panic, but one of measured adjustment to sustained challenges.
The Portland Region in this update comprises the six Oregon counties of Columbia, Clackamas, Hood River, Multnomah, Washington, and Yamhill. These counties form a contiguous housing ecosystem centered on Portland—Multnomah as the core home county, with the others tightly integrated through commuting patterns, economic ties, and shared market dynamics (e.g., Yamhill’s strong connection via Highway 99W and wine-country adjacency). Beyond Yamhill, the MLS system changes, further distinguishing this six-county area from broader geographic aggregations. For a detailed overview—including county profiles, population data, key value influencers, and why this definition differs from the official seven-county Portland–Vancouver–Hillsboro MSA—see my dedicated page: The Portland Region – Six-County Market Area Overview.
All data is sourced from RMLS and reflects open-market condominium residential sales. SNL (“Sold Not Listed”) entries—off-market transactions entered retroactively—have been excluded to preserve consistency with true market activity.
Since condominium is an ownership type and not necessarily a description of style, a strict examination was made of all other major single-family housing types in RMLS (detached homes, attached homes, and manufactured homes on owned land) and any condominium sales found in those segments were aggregated into this review. All figures underwent standard cleaning to address common RMLS accuracy challenges, including square footage/price typos, incomplete fields, status/date mismatches, and non-representative entries. For a detailed overview of these issues, their impact on market analysis, and mitigation through automated flagging, cross-verification, and manual review, see the dedicated page: RMLS Data Accuracy Challenges.
Portland Region 2025 Overview
2025 saw a continuation of erosion in condo prices, with a substantial increase in the time it takes a condo unit to sell. Higher interest rates and rising HOA dues in many complexes compounded affordability pressures, making monthly payments more burdensome and prompting greater buyer selectivity.
Overall Regional Trends
The table below summarizes key metrics for condominium residential sales in the Portland Region (Columbia, Clackamas, Hood River, Multnomah, Washington, and Yamhill counties) for 2025 compared with 2024.
Category
2024
2025
% Change
Total $ Volume
$912.4 Million
$873.5 Million
-4.26%
Average Price
$376,101
$371,576
-1.20%
Median Price
$334,900
$325,000
-2.96%
Avg SP/OLP
95.56%
94.00%
-1.63%
Avg PPSF (TSF)
$337.57
$325.78
-3.49%
Avg HOA Dues
$439.75
$497.10
+13.04%
Avg Age (Yrs)
30.91
31.67
+2.44%
Avg CDOM
77.68
102.45
+31.88%
Avg Total SF
1,133
1,153
+1.79%
Total # of Sales
2,426
2,351
-3.09%
# of New Constr.
449
385
-14.25%
Avg Supply (Mos.)
5.62
6.74
+19.82%
# of REOs
14
24
+71.43%
# of Short Sales
1
8
+700.00%
Note: The calculated average HOA dues is for units reporting HOA dues (2,271 sales). All other metrics use the full dataset (2,351 sales). Condominium Residential | 2024 & 2025 Data: RMLS | PortlandAppraisalBlog.com
Key Observations From the Aggregate Data
The 2025 Portland Region condominium market exhibited clear signs of continued softening, though the declines remained gradual and contained rather than abrupt. Buyer leverage increased noticeably compared to 2024, despite persistently elevated interest rates and rising HOA dues that amplified monthly payment pressures. While the segment retained moderate affordability relative to the HUD MSA median household, the combination of these factors contributed to extended marketing times, higher inventory levels, and greater price concessions across many transactions.
Average and median sales prices declined modestly year-over-year (-1.2% average to $371,576; -3.0% median to $325,000), reflecting buyer selectivity rather than widespread distress.
Price per square foot (PPSF) fell -3.5% to $325.78—a more direct indicator of price erosion in the condo segment, where size distribution is tight and PPSF declines are not driven by compositional shifts toward larger units (as often seen in detached homes).
Cumulative days on market (CDOM) increased substantially (+31.9% to 102.45 days average), with the monthly CDOM comparison showing 2025 consistently higher than 2024 in nearly every month—a clear signal of reduced urgency for some and greater qualification difficulty for others, resulting in prolonged exposure for sellers.
Months of supply rose +19.8% to 6.74 months average—firmly in buyer-favored territory for most of the year, peaking at 8.91 months in June during softer volume periods.
Total sales volume dipped only modestly (-3.1% to 2,351 units)—the decline was concentrated in suburban counties (Washington -7.5%, Clackamas -14%), while Multnomah (Portland core) held relatively steady (+0.65%).
New construction volume fell -14.3% to 385 units, almost entirely in Multnomah County (96% share), with suburban new supply dropping sharply (Clackamas -64%, Washington -58%)—limiting fresh inventory and contributing to resale reliance.
Average monthly HOA dues rose +13.0% to $497.10—the sharpest annual increase in recent years, with intensity (HOA per SF) highest in urban Multnomah ($0.463/SF) and resort-adjacent Hood River ($0.456/SF), further squeezing affordability from a payment perspective.
The market remained heavily urban-concentrated: the City of Portland alone accounted for approximately 61% of regional sales, with the Big Three counties (Multnomah, Washington, Clackamas) representing 98.9% of total volume—underscoring that condo activity is fundamentally a Portland-core story.
Persistent long-term oversupply in key urban submarkets (Pearl District, Portland Downtown ) continued to amplify selectivity, while rural counties (Yamhill, Columbia, Hood River) saw negligible activity, consistent with limited demand and condo availability in those areas.
Portland Region Scatter Plots
To visualize the distribution of individual condominium sales prices across 2025, the following scatter plots show sales price against date of sale. The first graph displays the full range of transactions, while the second focuses on the $800k or less range.
The full time-series view of sales prices across 2025 reveals a market that remained active throughout the year without any significant upward momentum or late-year collapse.
High-end transactions above $1 million occurred sporadically—a thin but persistent tail reflecting continued demand for premium urban and luxury units—yet these outliers were rare relative to the overall volume. The vast majority of sales clustered well below $800,000, confirming the mid-tier focus of the Portland Region condo market in 2025. The absence of a clear ascending trend across the months aligns with the modest price erosion observed in the aggregate data and underscores how elevated interest rates, rising HOA dues, and buyer selectivity tempered any meaningful appreciation, even as closings continued at a steady pace.
Zooming in on sales priced at $800,000 or less—which account for the overwhelming majority of 2025 transactions—reveals a dense, horizontal band of activity that persisted throughout the year with a noticeable downward momentum:
The core cluster remained concentrated in the $200,000–$600,000 range across all months, reflecting the mid-tier focus that defines the Portland Region condo market. While volume fluctuated seasonally (stronger in spring and summer, softer in fall and winter), prices for the bulk of the market showed a steady gradual decline. This downward drift becomes more evident when viewed through the lens of price per square foot, where the year-long trend reveals consistent softening even within the representative price band.
The time-series view of PPSF across 2025 reveals a clear downward tilt in the fitted trendline, confirming that price per square foot softened steadily over the course of the year.
The dense core of transactions clustered between approximately $200 and $500 PSF for most of the period, with early-2025 sales tending to occupy the higher portion of that band and later sales shifting progressively lower. This gradual erosion in PPSF aligns with the modest decline observed in overall average PPSF (-3.5% year-over-year to $325.78). Unlike detached homes, where PPSF declines can sometimes stem from compositional shifts toward larger units, the tight size distribution in condos makes this PPSF trend a more direct indicator of genuine price softness throughout the market.
Bottom-line Summary
The 2025 Portland Region condominium market reflected a continuation of gradual softening that has characterized the segment in recent years. Prices declined modestly overall, with average and median figures down year-over-year, while time-on-market metrics lengthened substantially and inventory levels rose into clearly buyer-favored territory. Rising HOA dues and persistently high interest rates amplified monthly payment pressures, narrowing buyer pools and increasing selectivity—particularly in complexes with elevated carrying costs. Yet the market remained functional: transactions continued at a steady pace, volume held relatively close to the prior year, and affordability persisted at a moderate level relative to the HUD MSA median household. This was not a collapse, but a measured shift toward conditions favoring buyers, with the most pronounced effects visible in extended marketing times, higher months of supply, and selective pricing behavior across the region.
Sales Volume
A treemap visualizing the distribution of condominium sales by county in 2025 clearly illustrates the market’s geographic concentration.
The distribution of condo sales volume across the Portland Region in 2025 reveals extreme concentration in the urban core and immediate suburbs, with the three major counties accounting for nearly 99% of all transactions.
Multnomah County—encompassing the City of Portland and its immediate surroundings—dominated with 66.2% of regional sales (1,556 units), underscoring that the metro condo market is fundamentally an urban Portland story. Washington County followed at 22.7% (534 units), while Clackamas County contributed 10.0% (234 units). The remaining three counties (Columbia, Hood River, and Yamhill) combined for just 1.15% of volume (27 units total), reflecting the limited presence of condominium inventory in more rural and outer areas. This geographic skew highlights how condo demand remains anchored to denser, amenity-rich and walkable locations.
The following bar chart shows monthly sales volume for 2025:
Monthly sales volume in 2025 followed a recognizable seasonal rhythm, though the pattern was somewhat muted compared to more family-driven segments like detached single-family homes.
Activity started modestly in January (150 sales), built steadily through spring (peaking at 231 sales in April), and reached the year’s high in August (239 sales)—a classic spring-to-summer strength seen in many residential markets. Volume then tapered noticeably in fall and winter, with November marking the low point (148 sales) before a slight December rebound (189 sales).
The overall monthly range (148–239 sales) reflects a market that remained functional and active year-round, without the sharp seasonal swings or deep troughs often observed in detached homes. This steadier flow is consistent with a buyer base less constrained by school calendars—including singles, young couples, downsizers, and retirees—and underscores that while some affordability pressures and selectivity were present, the condo segment did not experience dramatic seasonal shutdowns.
The line graph below compares monthly sales volume across the twelve months for 2024 and 2025.
The year-over-year comparison of monthly sales volume reveals that 2025 closely tracked the seasonal pattern established in 2024, with no fundamental disruption to the typical residential rhythm, yet the overall level remained slightly lower.
Both years showed a spring buildup (March–April highs), sustained summer activity (July–August), and a fall/winter taper (November lows), consistent with broader market behavior. In 2025, the peak occurred in August (239 sales) rather than April (231), and summer months actually outperformed 2024 in July and August, while the late-year decline was more pronounced in November (148 vs. 201). The net result was a modest 3.1% reduction in total annual sales (2,351 vs. 2,426), indicating a market that continued to function steadily.
Sales Price
The following bar chart shows average monthly sales price for 2025:
Note: The y-axis starts at $330,000 to allow better examination of monthly differences.
Monthly average sales prices in 2025 remained remarkably stable across the year, fluctuating within a relatively narrow band of approximately $360,000 to $385,000.
The highest monthly average occurred in July ($384,196), while the lowest came in August ($359,556)—coinciding with the year’s peak volume month. Prices trended upwards until July and then trended downwards for the rest of the year. This overall flatness aligns with the modest year-over-year decline in average price (-1.2% to $371,576).
The line graph below compares average monthly sales prices across the twelve months for 2024 and 2025.
The year-over-year comparison of monthly average sales prices shows 2025 prices tracking closely with 2024 throughout most of the year, with no dramatic divergence or sustained downward break. Zooming in we have:
Note: The y-axis starts at $340,000 to allow better examination of monthly differences.
Both years fluctuated within a similar overall range (roughly $350,000–$390,000), reflecting the condo segment’s relative price stability. Early 2025 prices started near 2024 levels (January slightly higher, February and March lower), held steady through spring and summer (July nearly identical at ~$384,000), and ended the year modestly higher in December ($376,584 vs. $356,771). Noticeable softening appeared in August 2025 ($359,556 vs. $370,187), but the lack of a consistent or accelerating decline across months aligns with the modest overall annual drop (-1.2% average price to $371,576). This pattern reinforces that while buyer selectivity and carrying-cost headwinds were present, the market did not experience sharp or broad-based price erosion relative to the prior year.
New Construction
The bar graph below shows monthly total condominium sales for 2025, with new construction volume nested within each bar to illustrate the portion of sales that were newly built.
New construction provided a meaningful but uneven contribution to monthly sales volume in 2025, accounting for 16.4% of total transactions (385 out of 2,351 units) and following a clear seasonal cadence.
The share of new construction peaked in late winter and early spring (February–March ~26–28%), when fresh deliveries aligned with stronger buyer activity. It then declined sharply through summer and early fall (August–September dropping to ~7–9%), reflecting reduced project closings during the year’s highest total volume month (August 239 sales). A modest rebound occurred in late fall (October 15.3%), but the overall pattern shows new supply was front-loaded and tapered significantly in the second half of the year.
This uneven distribution meant resale inventory bore more absorption pressure during peak demand periods. The decline in new construction volume from 2024’s 449 units (-14.3%) limited buyers’ options for fresh supply.
The bar graph below shows the number of new construction closings by county, with side-by-side bars for 2024 and 2025.
New construction activity in 2025 remained overwhelmingly concentrated in Multnomah County, which accounted for 96.1% of all new condo units delivered (370 out of 385 total).
This extreme urban dominance reflects the ongoing focus of new development in Portland’s core and inner neighborhoods, where density, transit access, and demand for urban living support higher-rise and infill projects. Suburban counties saw significantly reduced new supply: Clackamas dropped -63.6% (22 to 8 units), Washington fell -58.3% (12 to 5 units), and Columbia had 1 in 2024 and none in 2025. Hood River contributed a small increase (0 to 2 units), but the absolute number remained negligible, while Yamhill had zero in both years.
The regional decline of -14.3% in new units (from 449 to 385) reduced fresh inventory overall, slightly shifting absorption pressure toward resale stock. Despite fewer new deliveries in 2025, months of supply remained elevated and cumulative days on market increased sharply—indicating that resale softness and buyer selectivity outweighed the limited relief from reduced new supply.
The table below shows new construction sales volume by dollar amount for 2025 compared with 2024.
The following double bar chart provides the above information at a glance.
In dollar terms, new construction volume declined 12.5% regionally to $144.6 million in 2025 (from $165.2 million in 2024), reflecting both fewer units delivered and shifts in average pricing among the new supply that did close.
Multnomah County again dominated, accounting for 94.5% of the total new construction value ($136.6 million in 2025, down 9.2% from 2024). This near-total concentration in the urban core mirrors the unit volume pattern and highlights the ongoing focus of new development in Portland’s denser, higher-value neighborhoods. Suburban counties experienced steeper value reductions: Clackamas fell 48.7% ($8.2M to $4.2M), Washington declined 59.9% ($6.3M to $2.5M), and Columbia dropped to zero from $200,000 in 2024. Hood River contributed a small $1.18 million in 2025 (from zero the prior year), while Yamhill remained at zero.
The sharp suburban pullback in new construction dollars limited fresh inventory outside the city, placing additional absorption pressure on existing resale stock.
Cumulative Days on Market
The bar chart below compares average cumulative days on market (CDOM) throughout 2025.
Monthly average cumulative days on market in 2025 followed a seasonal pattern that was both pronounced and persistent, with clear winter highs and summer lows.
CDOM started the year at its peak (January 130.22 days), reflecting slower winter activity, then improved steadily through spring and early summer (April low of 90.41 days, July low of 83.67 days)—coinciding with stronger volume periods. Marketing times lengthened again in late summer and fall (August 99.90, October 105.82, November high of 119.36 days), before easing slightly in December (106.27 days).
The overall range (83–130 days) and sustained elevation (only two months below 90 days) underscore a market where buyer selectivity remained strong year-round. Even during traditionally faster periods, average CDOM stayed well above 2024 levels, contributing to the annual increase of +31.9% to 102.45 days and reflecting the ongoing impact of high interest rates, rising HOA dues, and a more cautious buyer pool.
The bar chart below compares cumulative days on market for 2024 and 2025.
The year-over-year monthly comparison of average cumulative days on market reveals a dramatic and consistent widening of marketing times in 2025 compared to 2024, with increases ranging from 19% to 132% across nearly every month.
In 2024, CDOM remained relatively low and stable (mostly 50–70 days, with a modest rise in fall/winter), reflecting a more balanced market. In 2025, the curve shifted sharply upward: January soared to 130 days (+132% from 56), March reached 112 days (+128% from 49), and even the summer low in July (84 days) was +66% above 2024’s 50 days. Late-year months showed the smallest relative gap (December +19% to 106 days), but the overall elevation persisted. This broad-based increase across the calendar—with no month showing shorter times in 2025—signals significantly reduced buyer urgency and greater qualification difficulty, resulting in prolonged exposure for sellers and a more pronounced buyer-favored environment than in the prior year.
Housing Supply
Months of supply (MOS) represents the number of months it would take to absorb current active inventory at the prevailing sales pace, assuming no new listings enter the market. The following bar chart shows MOS by calendar month for 2025:
Months of supply in 2025 remained elevated throughout the year, averaging 6.74 months and reflecting a consistently buyer-favored market.
MOS started high in January (7.70 months), dipped slightly in spring (March–April ~5.9–6.0 months) during stronger volume periods, then climbed to a peak in June (8.91 months)—coinciding with the year’s lowest sales volume. Supply eased modestly in late summer (August 6.06 months) but stayed above 6 months in most remaining months, ending the year lower in December (5.01 months) amid year-end closings and listing cancellations.
The sustained elevation (above 6 months in 8 of 12 months) and mid-year peak underscore persistent absorption challenges, even as seasonal volume patterns persisted. This buyer-leaning inventory environment, up +19.8% from 2024’s 5.62 months average, contributed to greater buyer leverage, longer marketing times, and increased pressure on sellers to offer concessions throughout the year.
The line graph below compares monthly months of supply for 2024 (blue line) and 2025 (red line), with a full y-axis scale to show true proportional differences:
The year-over-year comparison of months of supply shows a clear and consistent upward shift in 2025, with the line remaining above 2024 levels in nearly every month and the annual average rising from 5.62 to 6.74 months (+19.8%).
In 2024, MOS fluctuated in a more balanced range (mostly 4.3–7.2 months), dipping to tighter levels in spring (March–April ~4.3–4.4 months) during stronger absorption periods. In 2025, supply started higher (January 7.70 vs. 6.21), peaked sharply in June (8.91 vs. 5.87), and stayed elevated through most of the year (above 6 months in 8 of 12 months). The only convergence occurred in late summer and December, where 2025 dipped closer to or slightly below 2024 levels (August 6.06 vs. 6.18, September 6.99 vs. 7.22, December 5.01 vs. 5.11).
This persistent elevation in 2025—particularly the mid-year spike—confirms a more buyer-favored inventory environment overall, even with some late-year relief from stronger closings.
HOA Dues
The bar chart below compares average monthly HOA dues (for reporting sales) for 2024 and 2025:
Average monthly HOA dues increased in most counties in 2025, with the regional figure rising 13.0% from $439.75 to $497.10—a sharper annual jump than the more gradual increases observed in 2024.
Multnomah County saw the largest dollar increase (+$64.56 to $513.20, +14.4%), reflecting higher costs in urban high-rise and mid-rise buildings with greater amenity and insurance burdens. Washington County rose +11.0% to $455.74, while Clackamas increased +6.8% to $497.14.
In the smaller counties, reported increases were noted in Hood River (+23.9% to $478.60) and Yamhill (+38.9% to $408.00), while Columbia showed a -22.7% decline to $227.50. These figures should be interpreted cautiously due to the very small sample sizes (5–15 sales per county), where HOA dues are often influenced by factors such as the size of the unit sold, the specific complex’s reserve status, or insurance allocations for that building.
This widespread upward pressure on HOA dues—particularly pronounced in urban and resort-adjacent areas—influenced affordability qualifications from a monthly payment perspective, contributing to the lengthening cumulative days on market.
Histograms
Histograms offer a unique and powerful perspective on the condominium market that traditional summary statistics and bar charts cannot fully capture: they reveal the underlying shape, spread, and clustering of the data, exposing patterns, skewness, tails, and bifurcations that averages and medians alone obscure.
While tables and trend lines show central tendencies and directional changes, histograms display the actual distribution of values—how many sales fall in each price band, how concentrated or dispersed PPSF is, where the bulk of CDOM accumulates, and how HOA dues are skewed. This distributional view highlights market segmentation (e.g., low-dues “winners” vs. high-dues “losers”), buyer selectivity (long tails in CDOM), and pricing dynamics (left shoulders in SP/OLP) in ways that are immediately visible and intuitive. The histograms illustrate these shapes for the 2025 Portland Region condo market, providing deeper insight into the forces driving the observed softening and buyer-favored conditions.
The following histogram shows the distribution of sales price as a percentage of original list price in 2025:
The distribution of sale price as a percentage of original list price in 2025 reveals a market where sellers generally achieved strong realization on well-priced listings, yet a substantial portion required meaningful concessions to close.
The histogram shows a sharp peak in the 98.0%–99.9% bin (586 sales, 24.9% of total), indicating that realistic pricing prevailed and many condos moved efficiently once listed correctly. Nearly a quarter of transactions closed at or very near full original asking—a sign of disciplined seller expectations and solid demand for properly positioned units.
However, the pronounced left shoulder—with nearly half of sales (49.3%) below 96%—is particularly telling. This meaningful volume of transactions highlights buyer leverage in a notable subset of cases, often tied to red flags such as high or rising HOA dues, special assessments, financing hurdles, condition issues, or over-optimistic initial pricing. The thin right tail (only 11.7% at or above 100%) further confirms the scarcity of true bidding wars in the condo segment.
Overall, the shape reflects a buyer-favored but not collapsed market: sellers still commanded close to asking in most cases when priced realistically, but the fat left shoulder underscores condo-specific frictions amplifying negotiation power and concessions.
The following histogram shows the distribution of sales prices of condo units in 2025:
The distribution of sales prices in 2025 shows a strongly right-skewed pattern, with the overwhelming majority of transactions concentrated in the mid-tier price bands that define the Portland Region condo market.
The histogram reveals a clear double peak: the highest concentration in the $225,000–under-$300,000 range (626 sales, 26.6% of total), closely followed by $300,000–under-$375,000 (622 sales, 26.5%). Together, these two bins capture more than half of all sales (53.1%), underscoring the dominance of affordable to moderately priced units. The cumulative share below $450,000 reaches 81.2%, confirming that the vast majority of condo activity remained accessible to a broad range of buyers. This mid-tier hump aligns with the typical buyer profile in the region (first-time buyers, downsizers, young couples, and investors seeking entry-level or urban alternatives).
The long but extremely thin right tail (scattered sales at or above $750,000) does indicate the presence of a luxury condo market in the region (mostly in Portland urban core areas). While this segment represents only a small fraction of total volume, it demonstrates that high-end demand persists in select locations with premium features, views, and amenities—even in a year marked by overall softening.
The following histogram shows the distribution of price per square foot for condo units in 2025:
The distribution of price per square foot in 2025 shows a relatively tight, unimodal pattern with a moderate right skew, centered on the mid-to-upper $200s and low $300s.
The histogram peaks in the $275–$299 range (279 sales, 11.9% of total), with strong adjacent bins at $250–$274 (249 sales, 10.6%) and $300–$324 (269 sales, 11.4%). Together, the $250–under-$350 range captures approximately 42.8% of sales, while the cumulative share below $400 PSF reaches 81.2%. This concentrated middle reflects the typical efficiency of mid-tier condos in the Portland Region—units of moderate size (median ~1,000–1,100 SF) in buildings with standard amenities and locations.
The right skew (18.8% at or above $400 PSF, with a thin tail beyond $500) indicates variability driven by premium factors: newer construction, better views, higher-floor locations, superior finishes, or high-demand urban/resort settings. The low-end tail (below $250 PSF, 21.2%) is limited but present, typically corresponding to older or less marketable complexes. Overall, the shape underscores that PPSF in condos is more tightly grouped than in detached homes, with declines in PPSF more directly reflecting price softness rather than size-driven composition changes.
The following histogram shows the distribution of total square footage of condo units in 2025:
The distribution of total square footage in 2025 exhibits a unimodal shape with moderate right skew, centered on the 900–1,100 SF range that typifies the Portland Region condo market.
The histogram peaks at 900–999 SF (312 sales, 13.3% of total), with strong adjacent bins at 800–899 SF (244 sales, 10.4%) and 1,000–1,099 SF (278 sales, 11.8%). Together, the 800–1,199 SF range captures approximately 43.9% of sales, and the cumulative share below 1,300 SF reaches 71.3%. This concentrated middle reflects the typical size profile for the region: compact to mid-sized units (1–2 bedrooms) in garden-style, mid-rise, or older urban buildings, offering efficient living without excessive space.
The moderate right skew (17.1% at or above 1,500 SF, with a thin tail beyond 2,200 SF) indicates variability driven by premium or larger configurations: newer high-rises, townhome-style condos, or combined units in premium locations. The low-end tail (below 800 SF, 19.3%) is present but limited, typically corresponding to studios or micro-units in older complexes. Overall, the tight size distribution underscores why PPSF in condos behaves more directly as a price indicator rather than a function of diminishing returns on incremental square footage (as often seen in detached homes).
The following histogram shows the distribution of cumulative days on market for condo units in 2025:
The distribution of cumulative days on market (CDOM) in 2025 shows a heavily right-skewed pattern, with a dominant early peak and a long, persistent tail that highlights the market’s buyer-favored nature.
The histogram peaks sharply in the 0–19 day bin (577 sales, 24.5% of total), with strong follow-up in the 20–39 day (298 sales, 12.7%) and 40–59 day (247 sales, 10.5%) bins. Together, sales closing in under 60 days account for approximately 47.7% of transactions, indicating that well-priced units continued to move efficiently even in a softer year. The cumulative share below 100 days reaches 63.6%, showing that a majority of condos sold within roughly three months.
The long right tail, however, is particularly telling: 36.5% of sales exceeded 99 days, 17.8% exceeded 179 days, and 2.9% lingered 380 days or more. This extended exposure—far beyond the regional average of 102.45 days—signals significant buyer selectivity, often tied to red flags such as high or rising HOA dues, special assessments, financing hurdles, condition issues, or overly-optimistic pricing. The presence of a meaningful number of very long-marketing units underscores how carrying-cost pressures, softer demand for luxury units, and reduced urgency amplified concessions and motivation in certain segments.
The following histogram shows the distribution of monthly HOA dues for condo units in 2025:
Note: The HOA dues histogram is for units reporting HOA dues (2,271 sales). All other histograms use the full dataset (2,351 sales).
The distribution of monthly HOA dues in 2025 shows a pattern that, while technically unimodal with a peak in the mid-range, is strongly influenced by a prominent low-end cluster that contributes to a near-bimodal appearance and shapes the affordability story.
The histogram peaks in the $400–$499 bin (438 sales, 19.3% of total), with strong adjacent bins at $300–$399 (315 sales, 13.9%) and $500–$599 (325 sales, 14.3%). Together, dues between $300 and under $600 capture approximately 47.5% of sales, while the cumulative share below $600 reaches 73.5%. This concentrated middle corresponds to the most common range for garden-style, mid-rise, and older urban/suburban buildings with standard amenities, reserves, and insurance coverage.
However, the prominent low-end cluster ($0–$299, 26.0% of sales, including a large $0–$99 bin at 13.9%) stands out as a distinct group, creating visual separation and a near-bimodal feel. This low-dues segment—often small infill developments, site condos, or minimal-association properties—represents the clear “winners” in affordability: lower monthly burdens, broader buyer appeal, easier financing, and faster absorption.
The moderate right skew (18.2% between $600 and $999, 8.3% at $1,000 or above, with a thin tail beyond $1,500) highlights variability driven by premium or challenged complexes: newer high-rises with elevators/concierge, resort-adjacent buildings, or older ones with elevated insurance/reserve needs. The low-end cluster ($0–$299, 26.0%) is notable but limited, typically corresponding to small infill developments, site condos, or minimal-association properties where dues remain nominal.
Overall, the shape underscores a clear bifurcation in carrying costs: a large mid-range core that supports broad access and a notable low-end cluster enhancing affordability for many, contrasted with a meaningful tail of higher dues that can constrain buyer pools, extend marketing times, and amplify concessions in affected segments.
Miscellaneous Statistics & Standout Transactions
Here are some of the most notable outliers and extremes from the 2025 Portland Region condo market—numbers that illustrate the full range of the data and the extremes buyers and appraisers encounter.
Highest Sales Price: $3,125,000—Penthouse unit at The Ritz-Carlton Residences, Portland (January 2025 sale). This represents an extreme high-water mark in the luxury segment. The current management team has decided that unsold units would be listed with a discount of at least 50%. While this does not necessarily reflect the precise diminution of value for this particular penthouse unit, it does underscore the risk of being among the first buyers into an expensive project—particularly when location-specific factors and market conditions do not fully support the initial pricing expectations. Photos of this property are currently available online.
Lowest Sales Price: $75,000—Ground-floor 1-bedroom, 1-bathroom condo in Beaverton (Washington County). This marks the absolute bottom of the 2025 dataset, typical for smaller, older units in suburban locations with basic amenities. Exterior photos of this property are currently available online.
Highest Price Per Square Foot: $1,263.14—This is the same penthouse unit at the Ritz Carlton that took the crown for highest sales price. That sale represented the extreme of the market in two distinct categories.
Lowest Price Per Square Foot: $87.98—A 1,165 SF 2-bedroom, 1.1-bathroom condo in the Hazelwood neighborhood in Portland. This sale closed at a price that places it at the absolute bottom of PPSF in the 2025 Portland Region condo dataset. Per agent comments and photos, this unit sold as a fixer and closed as a cash sale. Given this unit is ~27.6% of the average price of the Portland Region’s condo market, a sale like this represents an equity building opportunity for the right buyer. Photos of this property are currently available online.
Longest CDOM: 1,594 days—3-bedroom, 4-bathroom townhome-style condo in Portland with a riverfront location and mountain views. This unit’s extended marketing period began with an initial listing in August 2020 at $479,000 and concluded in February 2025 at $405,500—a reduction of approximately 18.3% from original asking. Photos of this property are currently available online.
Smallest Condo: 313 SF—Studio unit in Portland (1920s-era building in the Alphabet District/Nob Hill).This sale represents the smallest unit in the 2025 Portland Region condo dataset—a compact studio in an historic building with walkable access to Powell’s Books, NW 23rd Avenue shops/restaurants, Providence Park, Washington Park, and the Rose Garden. At 313 SF, this transaction typifies the micro-studio segment in older urban buildings, where small size limits functional utility and buyer appeal but offers an entry point for singles, young professionals, or investors. Such units often trade at low absolute prices and PPSF due to space constraints. Photos of this property are currently available online.
Largest Condo: 5,786 SF—Combined 5-bedroom, 4.1-bathroom unit occupying the entire third floor of its building in Portland (West Hills area). This was a resale of a rare merged unit created by combining three individually recorded condo units into a single expansive residence. The layout offers generous single-floor living with city and mountain views, including five dedicated parking spaces, guest parking, and three large storage closets (two combined). The sale closed at $1,040,000 after an original listing price of $1,950,000. The significant discount from original list ($1.95M → $1.04M) illustrates that the combined whole was not valued as greater than the sum of its parts—a reminder that market perception, functional utility, and buyer pool can limit premiums for unusually large or custom configurations in condo settings. The extremely high monthly HOA dues ($5,203) likely contributed to the prolonged marketing and ultimate pricing outcome, underscoring how carrying costs can materially impact marketability and buyer interest in high-end projects. Photos of this property are currently available online.
Highest Monthly HOA Dues: $5,203—The crown for the highest monthly HOA dues is the same property as the largest condo. By merging three units together the previous owner assumed a substantially higher monthly HOA bill. It is technically possible to add walls back in and revert the single unit back to three individual condos.
Highest Monthly HOA Dues Per SF: $1.92/SF—2-bedroom, 2-bathroom unit in Portland (mid-century building in King’s Hill Historic District). This sale closed at $361,500 in cash, with monthly HOA dues of $2,321 (including property taxes). At $1.92 per square foot, this represents the highest HOA intensity in the 2025 Portland Region condo dataset. The elevated dues burden, even at a relatively affordable sales price, illustrates how carrying costs can significantly narrow the buyer pool and create affordability barriers for many potential purchasers. Photos of this property are currently available online.
With the regional aggregate trends, graphs, monthly patterns, histogram analysis, and notable outliers covered, the remainder of this update turns to a county-level breakdown. The following sections present year-over-year comparisons for each of the six counties in the Portland Region—Multnomah, Washington, Clackamas, Yamhill, Columbia, and Hood River. Each county snapshot includes key metrics, commentary on local drivers, and any segment-specific observations that help explain broader regional patterns.
Multnomah County 2025 Stats
Multnomah County, encompassing the City of Portland and its immediate surroundings, dominated the regional condominium market in 2025, accounting for 66.2% of all sales (1,556 units out of 2,351) and serving as the true engine of the regional condo segment.
The table below summarizes key metrics for Multnomah County condominium residential sales in 2025 compared with 2024.
Category
2024
2025
% Change
Total $ Volume
$605.8 Million
$607.8 Million
+0.34%
Average Price
$391,826
$390,618
-0.31%
Median Price
$335,000
$330,000
-1.49%
Avg SP/OLP
95.23%
93.81%
-1.50%
Avg PPSF (TSF)
$355.03
$343.06
-3.37%
Avg HOA Dues
$448.64
$513.20
+14.39%
Avg Age (Yrs)
30.43
31.09
+2.17%
Avg CDOM
87.11
111.67
+28.19%
Avg Total SF
1,119
1,146
+2.44%
Total # of Sales
1,546
1,556
+0.65%
# of New Constr.
414
370
-10.63%
# of REOs
8
14
+75.00%
# of Short Sales
1
7
+600.00%
Note: Average monthly HOA Dues reflects only sales with reported HOA dues (1,496 sales in 2025). All other metrics use the full dataset. Condominium Residential | 2024 & 2025 Data: RMLS | PortlandAppraisalBlog.com
Multnomah County exhibited relative resilience compared to the regional trend, with sales volume holding steady (+0.65%) and total dollar volume slightly up (+0.34%). Average and median prices softened modestly (-0.31% and -1.49%, respectively), while PPSF declined -3.37% to $343.06—a more direct indicator of price pressure in the condo segment. Cumulative days on market rose +28.2% to 111.67 days average, reflecting increased buyer selectivity amid high interest rates and rising HOA dues (+14.39% to $513.20 average) as well as the presence of luxury condo units that naturally take longer to find qualified buyers. New construction fell -10.6% to 370 units (all in the City of Portland), and distress indicators ticked up (REOs +75%, short sales +600%), though absolute numbers remained small.
The following table shows the geographic distribution of condo sales in Multnomah County:
The market’s heavy concentration in Portland city proper (92% of county sales) underscores that Multnomah’s condo activity is fundamentally urban, with suburban pockets (e.g., Gresham, Lake Oswego portion) contributing only marginally.
The following is a scatter plot of all Multnomah County condo sales in 2025 (sales price vs. date of sale):
The full time-series view of sales prices in Multnomah County for 2025 shows a market that remained active year-round, with occasional high-end transactions above $1 million scattered throughout the period but representing only a small fraction of total volume. These outliers—primarily in premium urban core locations such as the Pearl District, Downtown, and South Waterfront—demonstrate that luxury demand persisted despite broader softening pressures.
Zooming in on sales priced at $800,000 or less we have:
The $800,000 or less segment accounts for the vast majority of Multnomah County condominium transactions. A dense horizontal band of activity is concentrated in the $200,000–$500,000 range across all months. It is at this scale a pattern of gradually lower prices is evident. The downward tilt of the core band aligns with the modest price declines observed in the aggregate data (-1.49% median, -3.37% PPSF) and reflects how elevated interest rates and rising HOA dues continued to temper upward pricing momentum in the urban core.
Washington County 2025 Stats
Washington County, encompassing suburban areas such as Beaverton, Hillsboro, Tigard, and Tualatin, experienced the sharpest softening among the major counties in 2025, with volume and price declines more pronounced than in Multnomah.
The table below summarizes key metrics for Washington County condominium residential sales in 2025 compared with 2024.
Category
2024
2025
% Change
Total $ Volume
$189.1 Million
$168.8 Million
-10.74%
Average Price
$327,654
$316,025
-3.55%
Median Price
$325,000
$305,000
-6.15%
Avg SP/OLP
96.60%
94.18%
-2.50%
Avg PPSF (TSF)
$301.48
$284.18
-5.74%
Avg HOA Dues
$410.71
$455.74
+10.97%
Avg Age (Yrs)
30.41
31.74
+4.37%
Avg CDOM
57.05
83.10
+45.68%
Avg Total SF
1,120
1,137
+1.49%
Total # of Sales
577
534
-7.45%
# of New Constr.
12
5
-58.33%
# of REOs
3
7
+133.33%
# of Short Sales
0
1
—
Note: Average monthly HOA Dues reflects only sales with reported HOA dues (524 sales in 2025). All other metrics use the full dataset. Condominium Residential | 2024 & 2025 Data: RMLS | PortlandAppraisalBlog.com
Washington County showed significant volume pressure (-7.45% sales, -10.74% dollar volume), with median price down -6.15% and PPSF declining -5.74%—steeper than regional and Multnomah figures. Cumulative days on market surged +45.7% to 83.10 days average, indicating prolonged exposure and increased buyer leverage in this suburban market. HOA dues rose +11.0% to $455.74 average, adding to monthly payment burdens. New construction fell sharply -58.3% to just 5 units, further limiting fresh supply. Distress indicators increased (REOs +133%, short sales from 0 to 1), though absolute numbers stayed small.
The following table shows the geographic distribution of condo sales in Washington County:
The county’s condo activity concentrated heavily in Beaverton (36% of sales) and Hillsboro (17%), with Portland mailing-address areas (unincorporated Washington County near the Multnomah line) contributing another 31%. This suburban focus, combined with external pressures such as Intel layoffs in Hillsboro, amplified selectivity and contributed to the county’s more pronounced softening compared to the urban core.
The following is a scatter plot of all Washington County condo sales in 2025 (sales price vs. date of sale):
The scatter plot shows a bell curve, gradually rising from January to about July and then declining for the remainder of the year.
Clackamas County 2025 Stats
Clackamas County, covering southern and eastern suburban areas such as Lake Oswego, Oregon City, Milwaukie, West Linn, and Happy Valley, experienced moderate softening in 2025, with more pronounced volume declines than Multnomah but less severe than Washington County.
The table below summarizes key metrics for Clackamas County condominium residential sales in 2025 compared with 2024.
Category
2024
2025
% Change
Total $ Volume
$106.6 Million
$86.22 Million
-19.10%
Average Price
$391,794
$368,456
-5.96%
Median Price
$350,000
$335,000
-4.29%
Avg SP/OLP
95.24%
94.60%
-0.68%
Avg PPSF (TSF)
$317.90
$305.59
-3.87%
Avg HOA Dues
$465.61
$497.14
+6.77%
Avg Age (Yrs)
34.82
35.17
+1.00%
Avg CDOM
68.62
84.77
+23.54%
Avg Total SF
1,237
1,220
-1.37%
Total # of Sales
272
234
-13.97%
# of New Constr.
22
8
-63.64%
# of REOs
3
3
0.00%
# of Short Sales
0
0
—
Note: Average monthly HOA Dues reflects only sales with reported HOA dues (228 sales in 2025). All other metrics use the full dataset. Condominium Residential | 2024 & 2025 Data: RMLS | PortlandAppraisalBlog.com
Clackamas County saw significant volume pressure (-13.97% sales, -19.10% dollar volume), with median price down -4.29% and PPSF declining -3.87%—declines more pronounced than in Multnomah but less severe than in Washington. Cumulative days on market rose +23.5% to 84.77 days average, indicating increased buyer selectivity in this suburban market. HOA dues increased +6.8% to $497.14 average, adding to monthly payment burdens but rising less sharply than in urban Multnomah. New construction fell -63.6% to just 8 units, further limiting fresh supply. Distress indicators remained stable (REOs flat at 3, short sales zero).
The following table shows the geographic distribution of condo sales in Clackamas County:
Activity concentrated in premium and mid-tier suburbs: Lake Oswego led with 67 sales (29% of county total) at the highest average price ($434,585) and PPSF ($336.28), followed by Wilsonville, West Linn, Milwaukie, and Happy Valley. Outer and smaller areas (grouped as “Other”) contributed only 31 sales combined, reflecting thinner demand in those locales and contributing to the county’s overall softness.
The following is a scatter plot of all Clackamas County condo sales in 2025 (sales price vs. date of sale):
The overwhelming majority of sale occurred in the $200k-$400k band. The graph also shows there is a small luxury condo market present in the county
Yamhill County 2025 Stats
Yamhill County, while more rural, had its condominium activity centered on McMinnville and Newberg. The county remained a very low-volume condominium market in 2025, with only 15 sales representing less than 0.6% of regional activity.
The table below summarizes key metrics for Yamhill County condominium residential sales in 2025 compared with 2024.
Category
2024
2025
% Change
Total $ Volume
$5.87 Million
$5.38 Million
-8.36%
Average Price
$293,635
$358,800
+22.19%
Median Price
$259,950
$340,000
+30.79%
Avg SP/OLP
96.49%
95.27%
-1.27%
Avg PPSF (TSF)
$271.63
$256.67
-5.50%
Avg HOA Dues
$293.84
$408.00
+38.85%
Avg Age (Yrs)
32.60
37.47
+14.93%
Avg CDOM
54.40
120.00
+120.59%
Avg Total SF
1,091
1,415
+29.72%
Total # of Sales
20
15
-25.00%
# of New Constr.
0
0
—
# of REOs
0
0
—
# of Short Sales
0
0
—
Note: Average monthly HOA Dues reflects only sales with reported HOA dues (14 sales in 2025). All other metrics use the full dataset. Condominium Residential | 2024 & 2025 Data: RMLS | PortlandAppraisalBlog.com
Yamhill County experienced a significant volume decline (-25.0% sales, -8.36% dollar volume) on a very small base. Median price increased +30.8% to $340,000 and average price +22.2% to $358,800 (skewed by larger units; PPSF fell -5.5% to $256.67). Cumulative days on market doubled to 120 days average, signaling very low demand and prolonged exposure. HOA dues rose sharply +38.9% to $408 average—the highest relative increase among counties, though starting from a low base. No new construction or distress sales occurred.
The following table shows the geographic distribution of condo sales in Yamhill County:
The following is a scatter plot of all Yamhill County condo sales in 2025 (sales price vs. date of sale):
Most activity stayed within $200k-$500k.
Columbia County 2025 Stats
Columbia County, while largely rural does have some activity in the cities of St. Helens and Scappoose. The county remained a very low-volume condominium market in 2025, with only 5 sales representing less than 0.3% of regional activity.
The table below summarizes key metrics for Columbia County condominium residential sales in 2025 compared with 2024.
Category
2024
2025
% Change
Total $ Volume
$710,000
$1.47 Million
+107.36%
Average Price
$236,667
$294,450
+24.42%
Median Price
$240,000
$290,650
+21.10%
Avg SP/OLP
94.21%
97.23%
+3.21%
Avg PPSF (TSF)
$267.81
$267.81
-0.00%
Avg HOA Dues
$294.33
$227.50
-22.71%
Avg Age (Yrs)
17.33
30.00
+73.08%
Avg CDOM
146.00
79.60
-45.48%
Avg Total SF
935
1,100
+17.69%
Total # of Sales
3
5
+66.67%
# of New Constr.
1
0
-100.00%
# of REOs
0
0
—
# of Short Sales
0
0
—
Note: Average monthly HOA Dues reflects only sales with reported HOA dues (4 sales in 2025). All other metrics use the full dataset. Condominium Residential | 2024 & 2025 Data: RMLS | PortlandAppraisalBlog.com
Columbia County saw minimal activity (5 sales, up from 3 in 2024), with all transactions confined to Scappoose and St. Helens. Median price rose +21.1% to $290,650 and average price +24.4% to $294,450 on the small sample, while PPSF remained flat at $267.81. Cumulative days on market improved -45.5% to 79.60 days average, though absolute demand stayed negligible. HOA dues declined -22.7% to $227.50 average (on very small reported cohort). No new construction or distress sales occurred in 2025.
These figures should be interpreted cautiously due to the extremely low volume—a single transaction can materially shift averages. Overall, Columbia County reflects the sparse nature of condominium inventory in largely rural counties.
The following table shows the geographic distribution of condo sales in Columbia County:
The following is a scatter plot of all Columbia County condo sales in 2025 (sales price vs. date of sale):
The five sales tightly clustered between $250k-$350k.
Hood River County 2025 Stats
Hood River County, a rural and resort-oriented area in the eastern part of the service region, remained a very low-volume condominium market in 2025, with only 7 sales representing less than 0.3% of regional activity. All transactions occurred within the City of Hood River proper—the only area with active condo inventory in the county.
The table below summarizes key metrics for Hood River condominium residential sales in 2025 compared with 2024.
Category
2024
2025
% Change
Total $ Volume
$4.45 Million
$3.94 Million
-11.39%
Average Price
$556,213
$563,286
+1.27%
Median Price
$564,350
$478,000
-15.30%
Avg SP/OLP
91.94%
97.07%
+5.58%
Avg PPSF (TSF)
$425.51
$520.97
+22.43%
Avg HOA Dues
$386.25
$478.60
+23.91%
Avg Age (Yrs)
28.63
26.57
-7.17%
Avg CDOM
85.25
99.57
+16.80%
Avg Total SF
1,327
1,118
-15.77%
Total # of Sales
8
7
-12.50%
# of New Constr.
0
2
—
# of REOs
0
0
—
# of Short Sales
0
0
—
Note: Average monthly HOA Dues reflects only sales with reported HOA dues (5 sales in 2025). All other metrics use the full dataset. Condominium Residential | 2024 & 2025 Data: RMLS | PortlandAppraisalBlog.com
Hood River County saw minimal activity (7 sales, down from 8 in 2024), with median price declining -15.3% to $478,000 while average price edged up +1.3% to $563,286 (small-sample volatility; PPSF increased +22.4%, with smaller units sold). Cumulative days on market rose +16.8% to 99.57 days average, and HOA dues climbed +23.9% to $478.60. Two new construction sales appeared in 2025 (from zero the prior year), but overall demand remained negligible. No distress sales occurred.
These figures should be interpreted cautiously due to the extremely low volume—individual transactions can materially shift averages. Overall, Hood River County reflects the sparse nature of condominium inventory in rural/resort areas.
The following is a scatter plot of all Hood River County condo sales in 2025 (sales price vs. date of sale):
Sales activity largely remained near $400k with a few data points above $600k.
Closing Thoughts
The 2025 Portland Region condominium market reflected a continuation of the gradual softening that has defined the segment in recent years. Prices declined modestly overall, with average and median figures down year-over-year, while time-on-market metrics lengthened substantially and inventory levels rose into clearly buyer-favored territory. Rising HOA dues and persistently high interest rates amplified monthly payment pressures, narrowing buyer pools and increasing selectivity—particularly in complexes with elevated carrying costs. Yet the market remained functional: transactions continued at a steady pace, volume held relatively close to the prior year, and affordability persisted at a moderate level relative to the HUD MSA median household. This was not a collapse, but a measured shift toward conditions favoring buyers, with the most pronounced effects visible in extended marketing times, higher months of supply, and selective pricing behavior across the region.
From an appraisal perspective, the year’s trends underscore several practical realities. The tight size distribution and flat PPSF-vs-SF relationship in condos make PPSF declines a more direct indicator of price softness than in detached homes, where compositional effects often play a much bigger role. Prolonged CDOM and elevated MOS highlight the need for careful time and motivation adjustments when selecting and weighting comparables, especially in segments with high HOA dues or project-specific challenges. The bifurcation between low-dues “winners” (small infill, minimal associations) and high-dues “losers” (premium or challenged complexes) further emphasizes the importance of in-complex comps to neutralize carrying-cost variance and reduce adjustment subjectivity.
Looking ahead, the condo market’s trajectory will likely depend on the trajectory of interest rates and ongoing pressures on HOA dues (insurance, reserves, major repairs). While the segment has shown resilience in the urban core—where demand remains anchored to location and lifestyle—suburban and rural areas face greater vulnerability to supply constraints and buyer caution. The persistent oversupply in key urban condo submarkets like the Pearl District and Portland Downtown suggests that stabilization may take time, but the market’s continued functionality—even in a challenging environment—indicates that condos remain a viable housing option for many in the region.
What trends do you expect to see in 2026? I’d love to hear your thoughts—feel free to reply here or reach out directly.
Sources & Further Reading
All data presented in this annual review is sourced directly from RMLS and has been subjected to my rigorous cleaning and validation process to ensure reliability for condominium residential analysis in the six-county Portland Region. The trends, comparisons, and commentary are the result of original appraisal expertise and independent analysis—not aggregated from secondary sources or news summaries.
External Obsolescence in Hillsboro — Residential Market Response to Intel’s 2024–2025 Workforce Reductions: Portland Appraisal Blog
Portland Affordability Index – PABAI: A Realistic Housing Qualification Metric for the Portland Region: Portland Appraisal Blog
Coda
Thanks for reading—I hope you found a useful insight or an unexpected nugget along the way. If you enjoyed the post, please consider subscribing for future updates.
Are you an agent in Portland who wonders why appraisers always do “x”?
A homeowner with questions about appraiser methodology?
If so, feel free to reach out—I enjoy connecting with market participants across Portland and the surrounding counties, and am always happy to help where I can.
And if you’re in need of appraisal services in Portland or anywhere in the Portland Region, we’d be glad to assist.

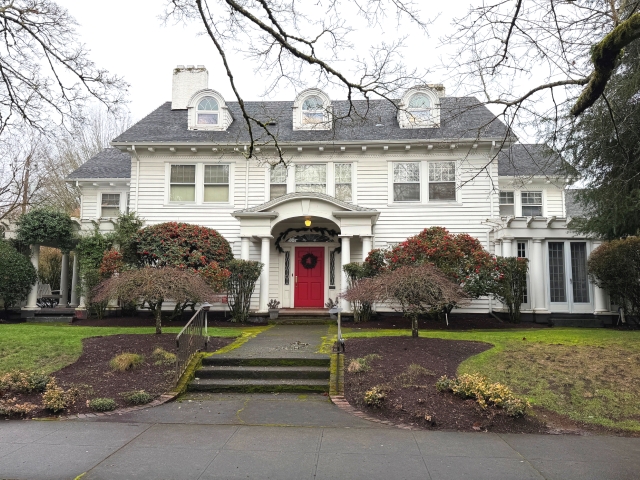


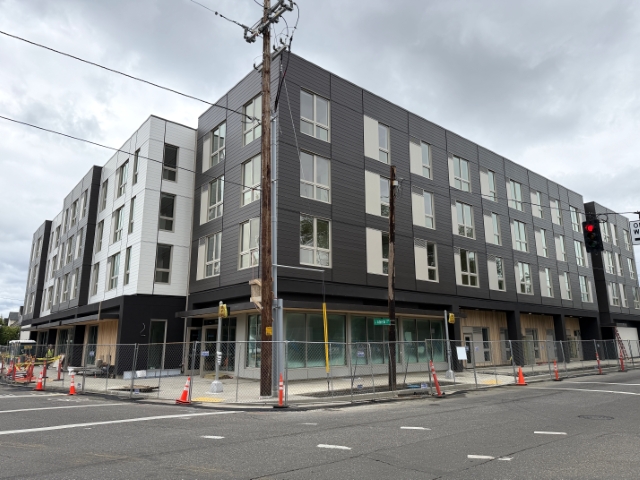

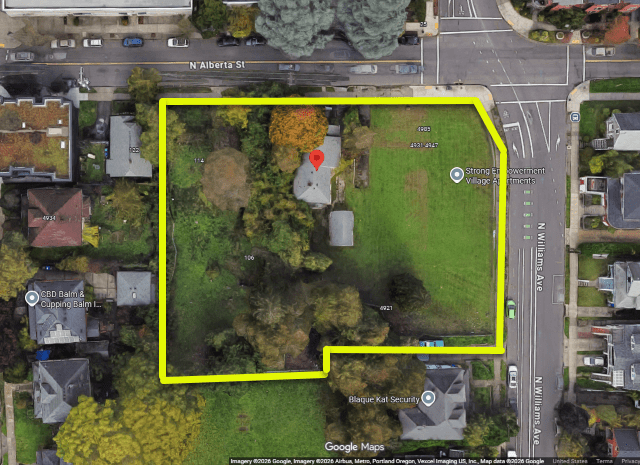
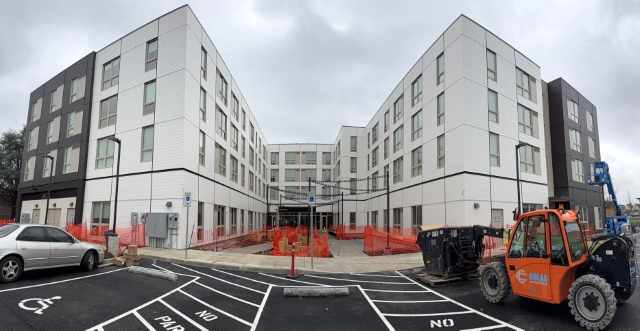
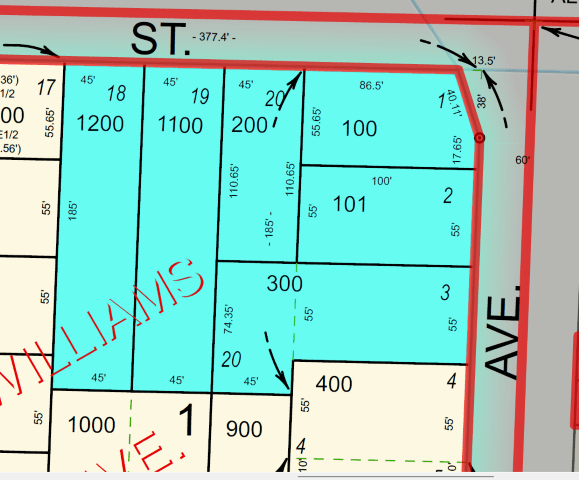
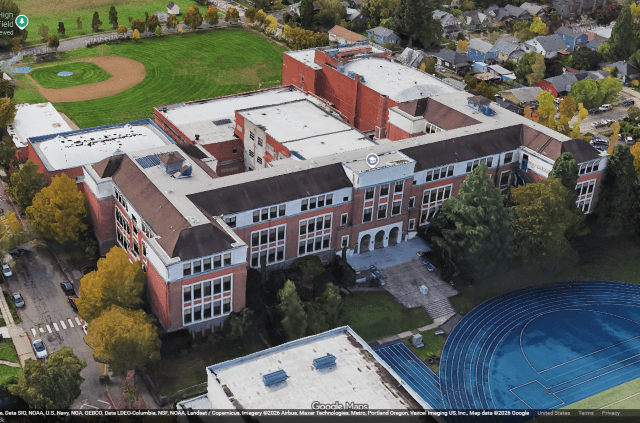


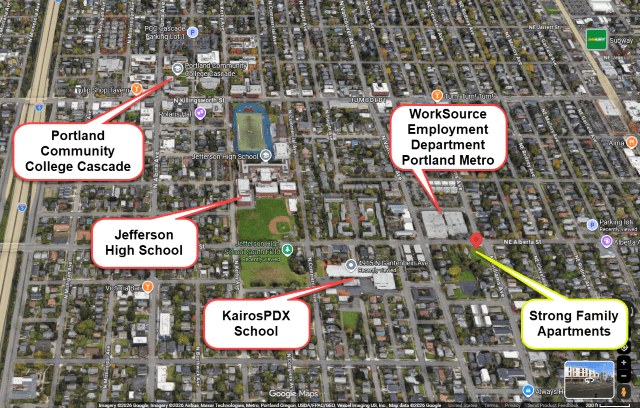


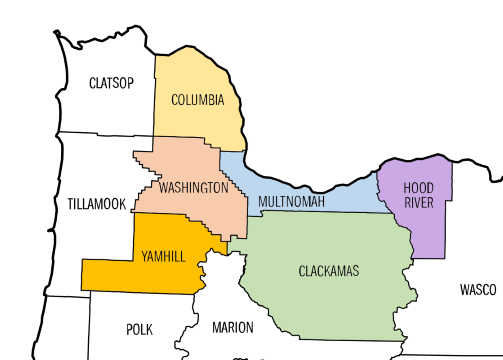
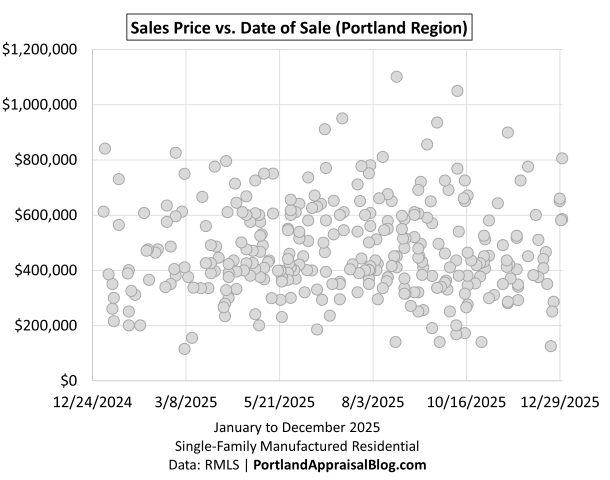
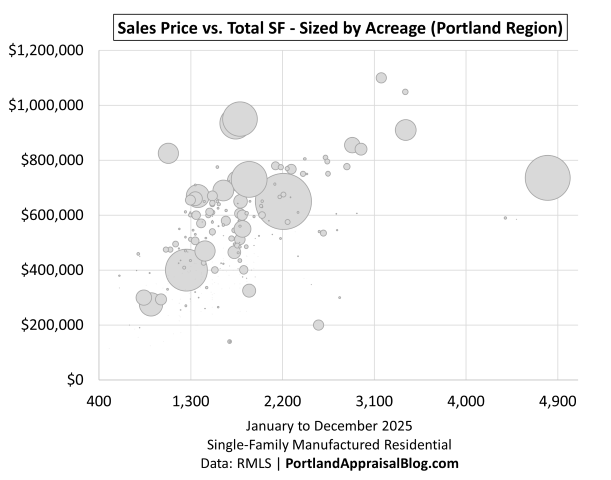
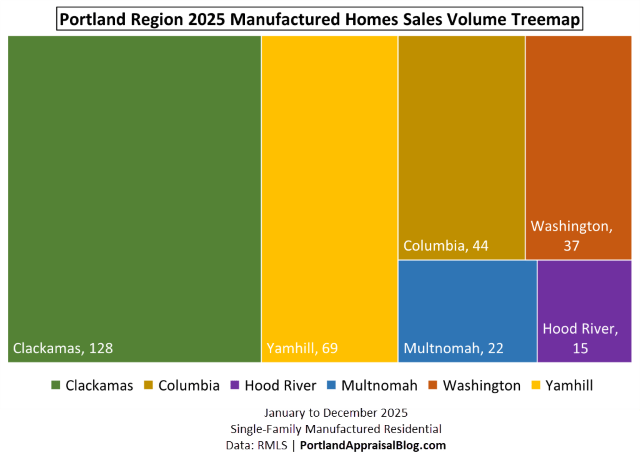
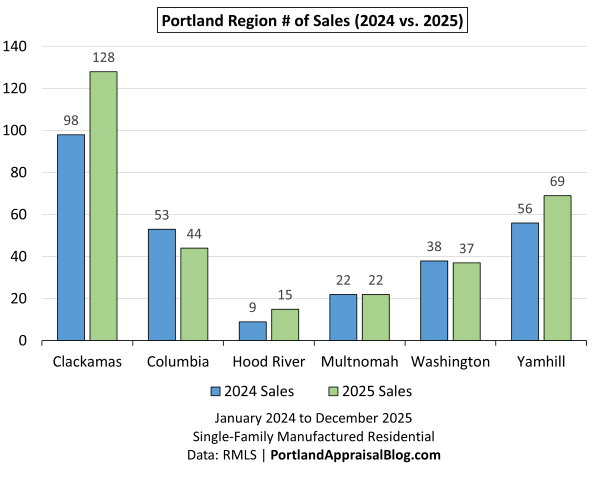
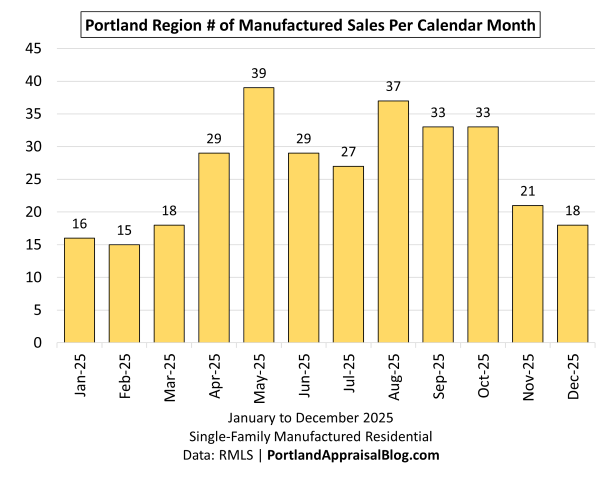
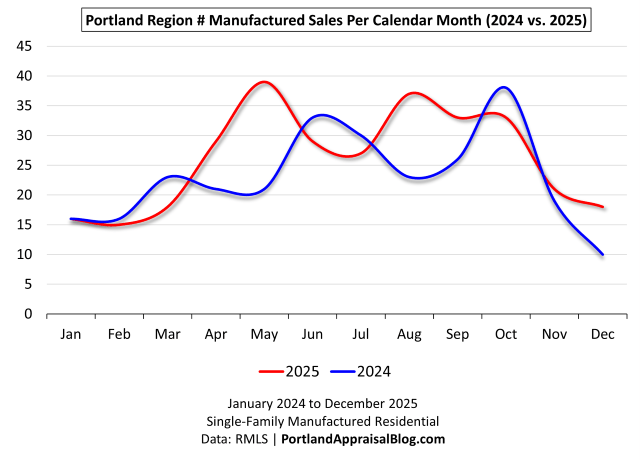
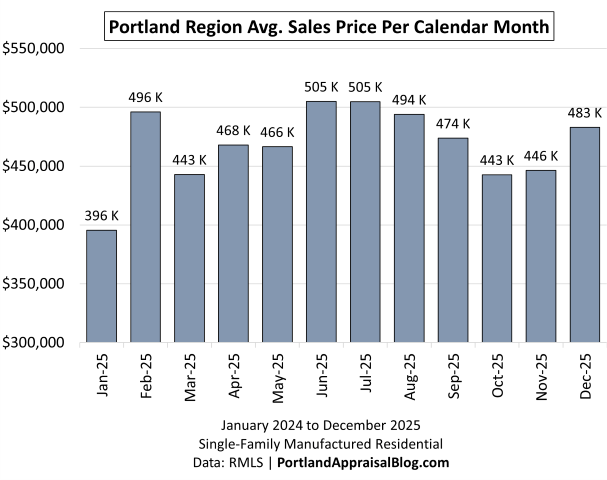
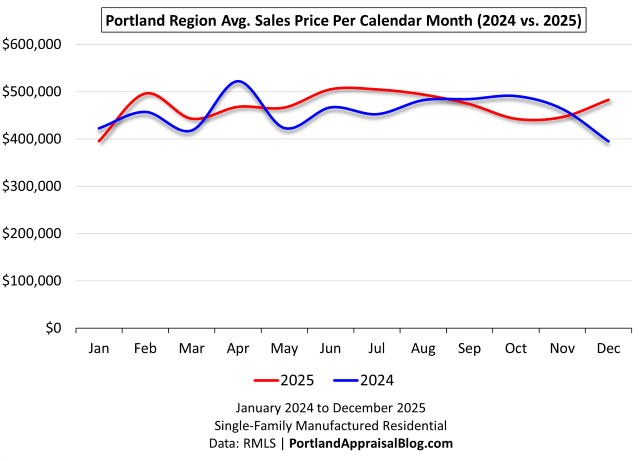
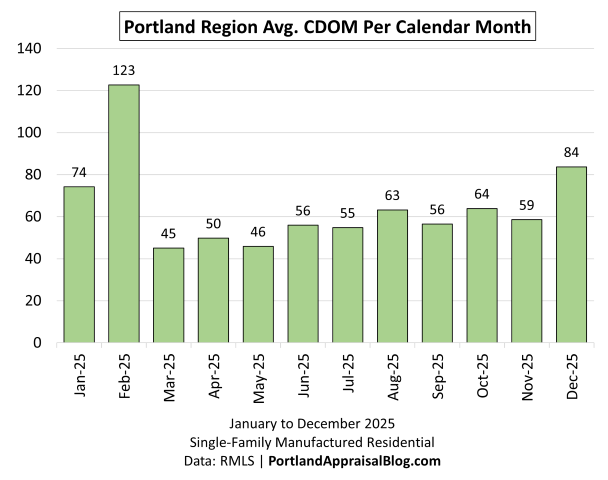
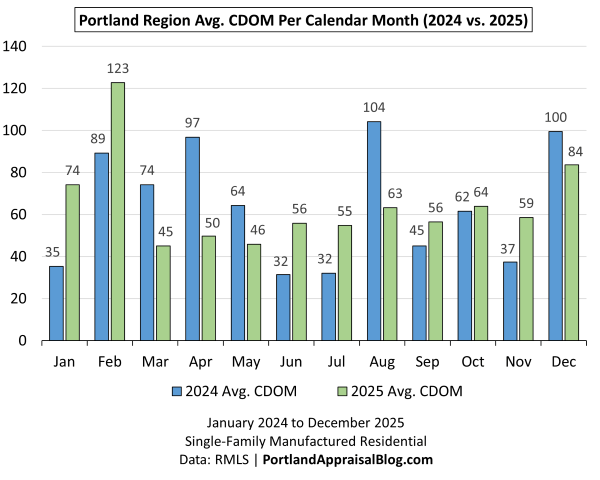
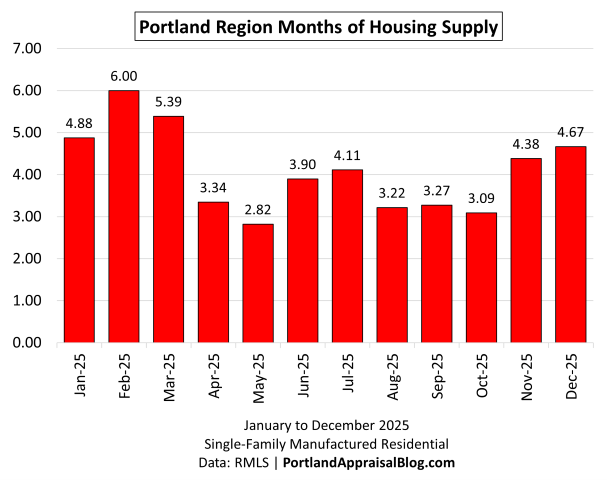
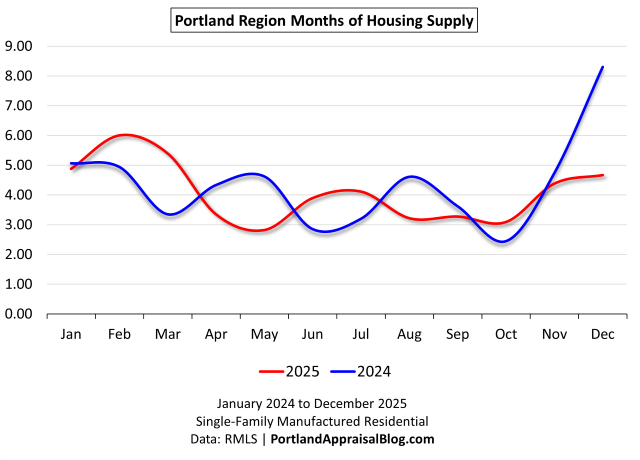
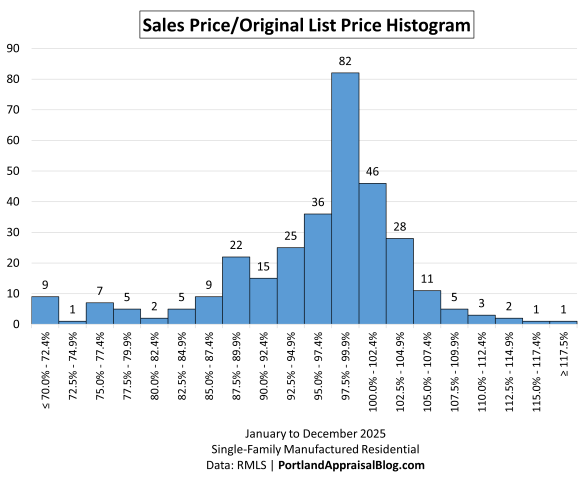
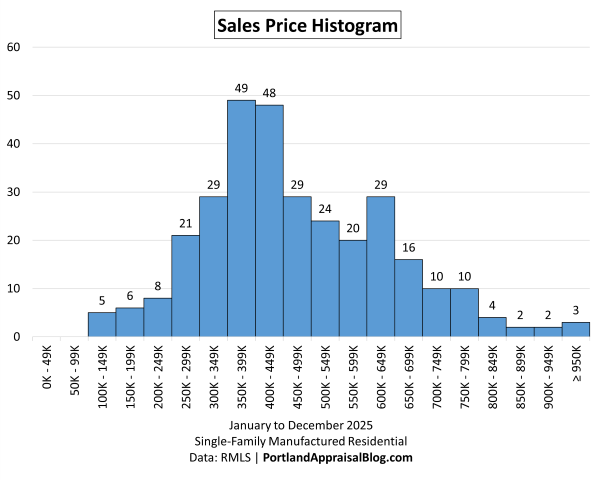
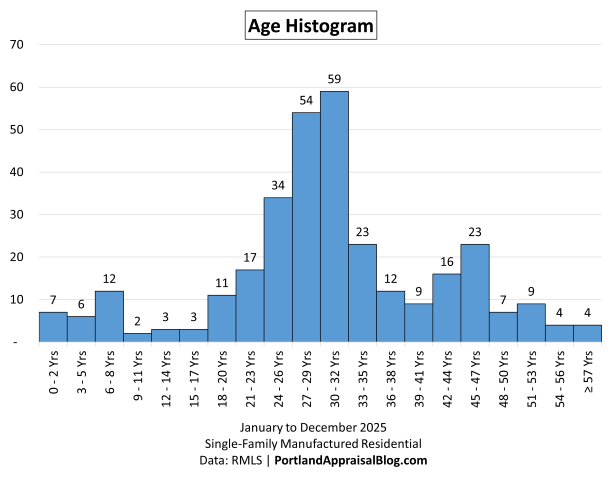
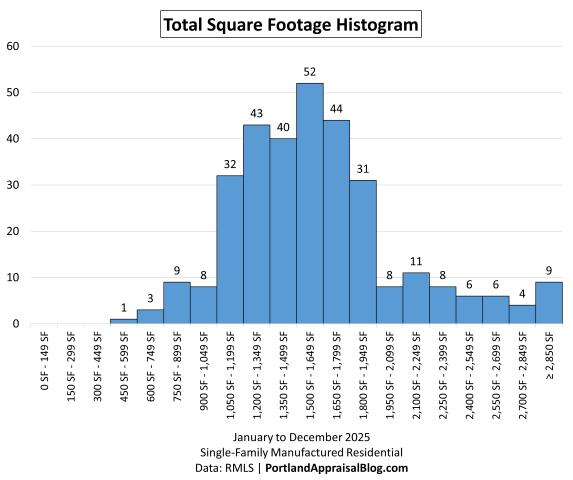
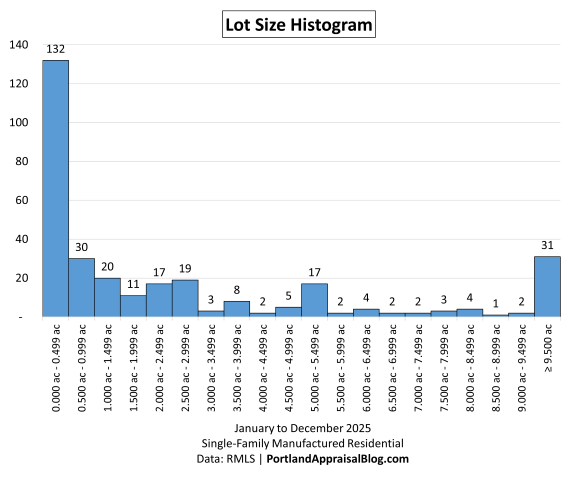
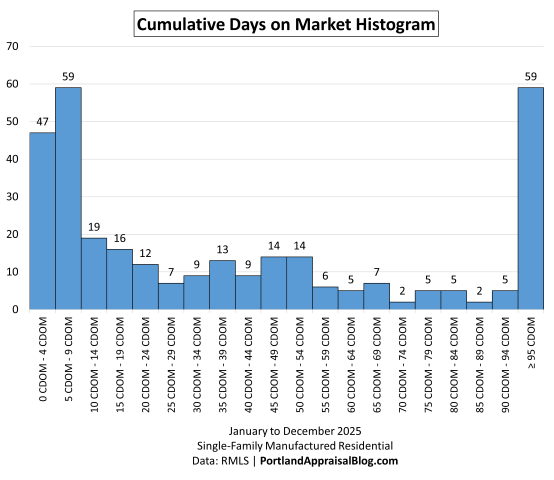
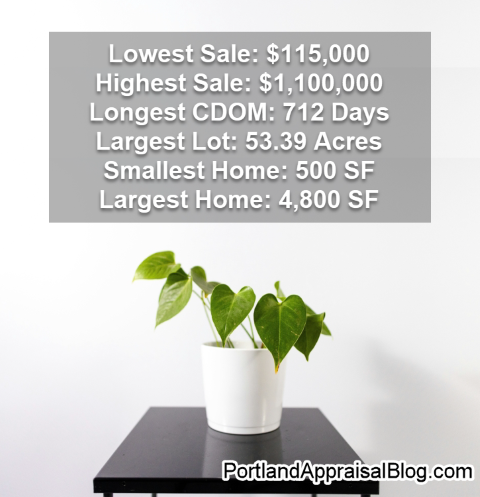
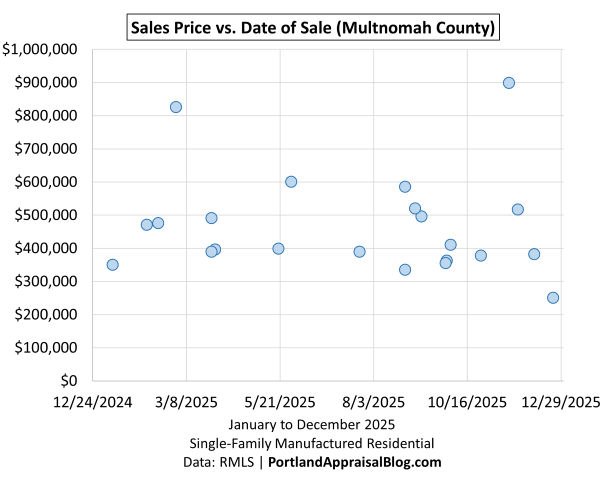
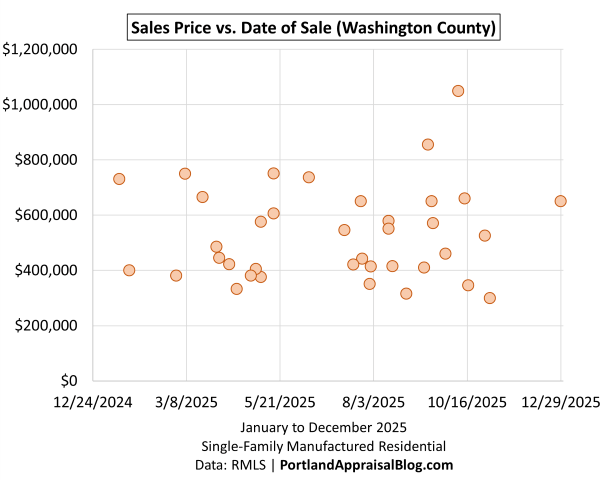
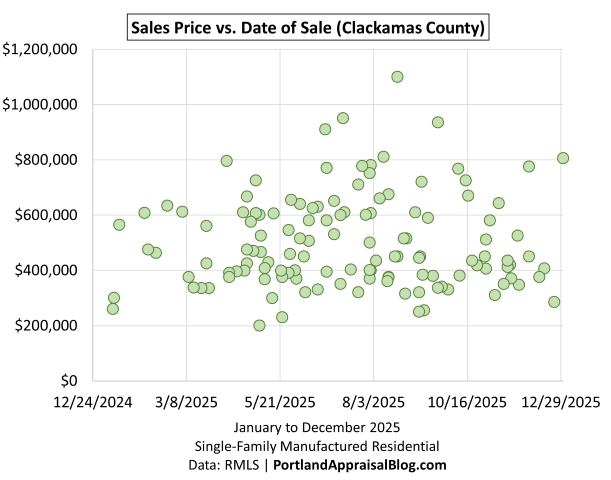
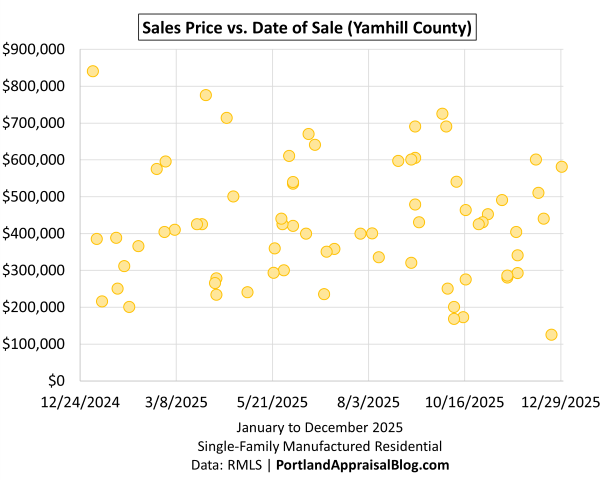
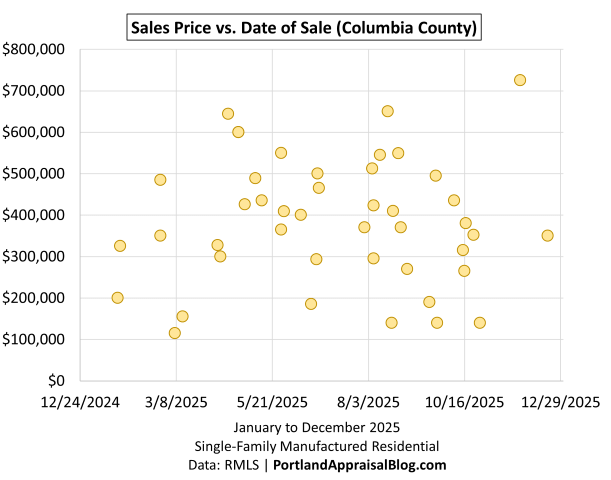
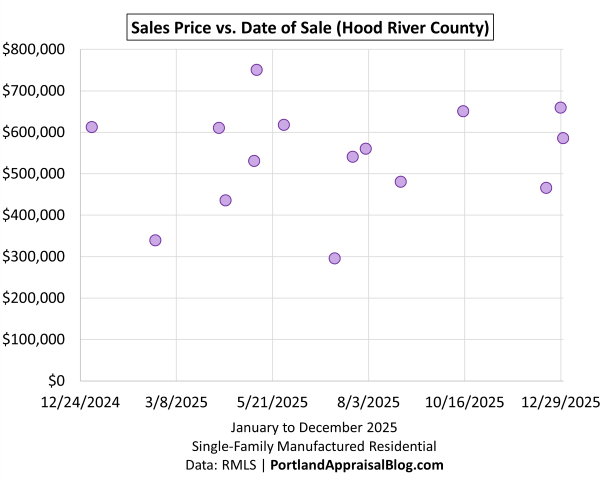


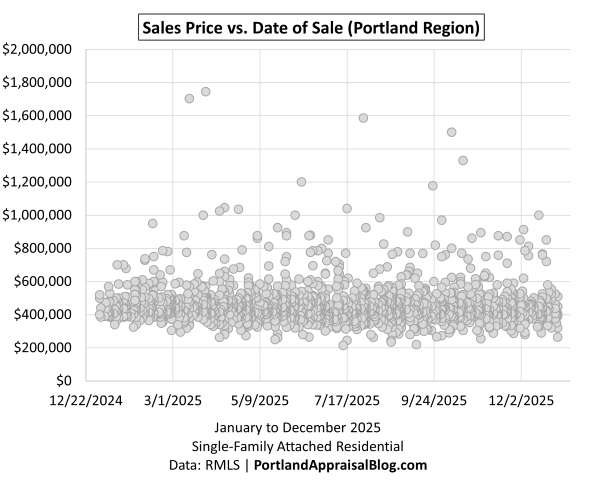
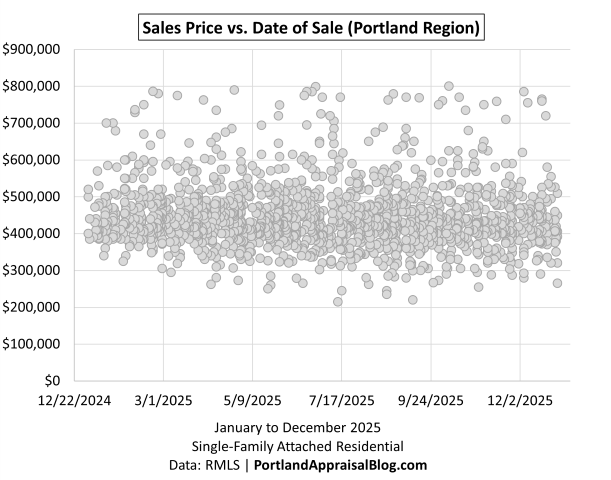
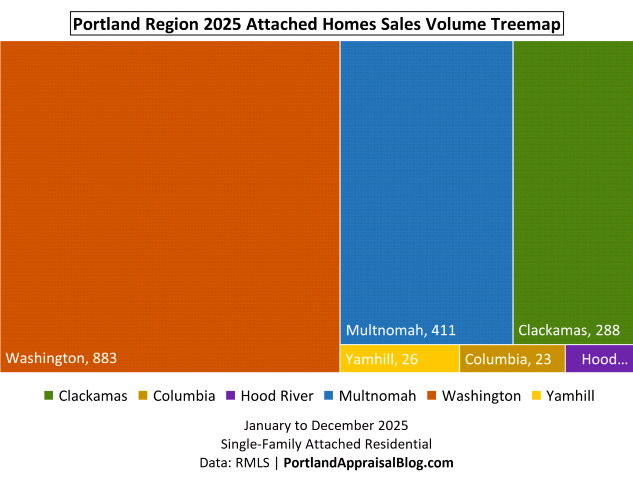
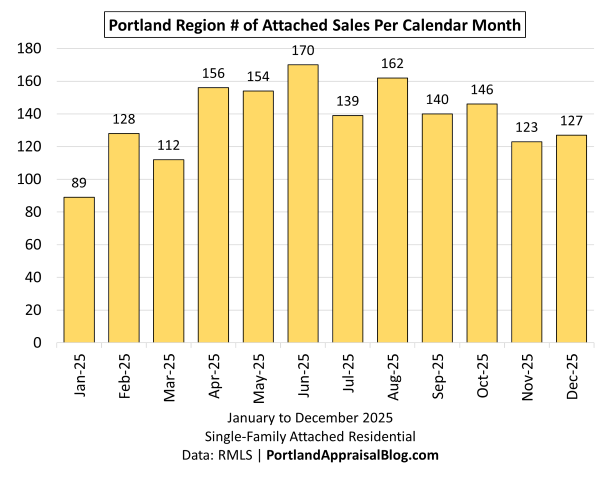
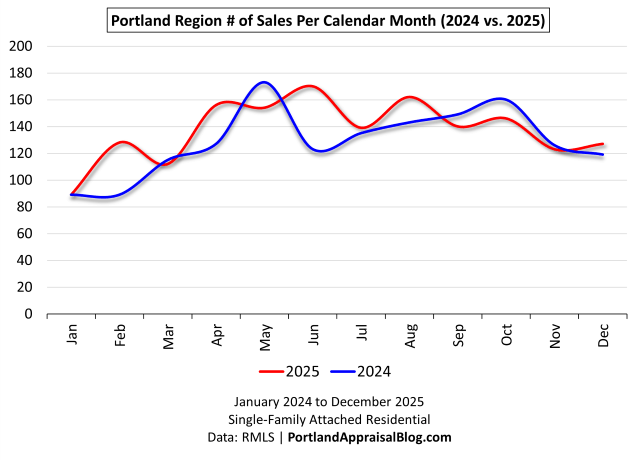
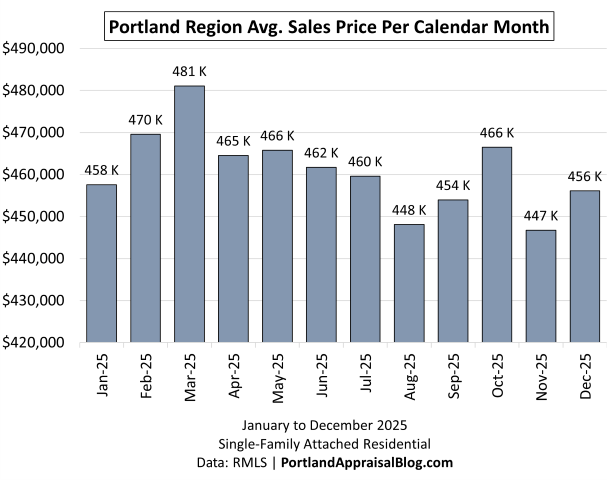
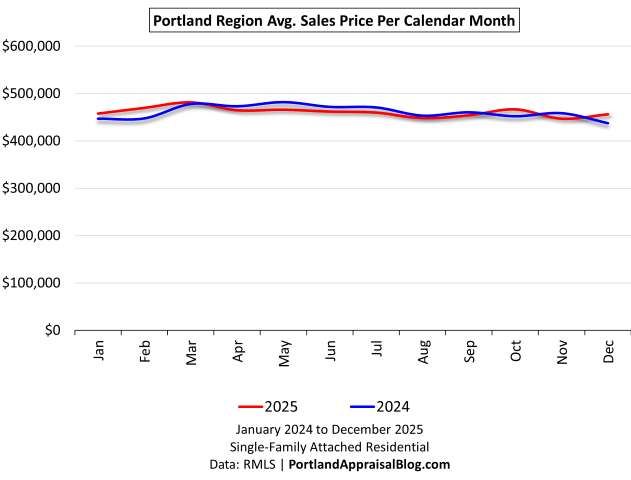

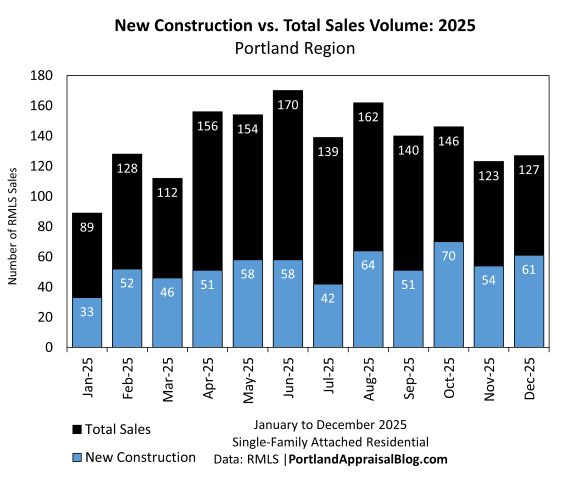
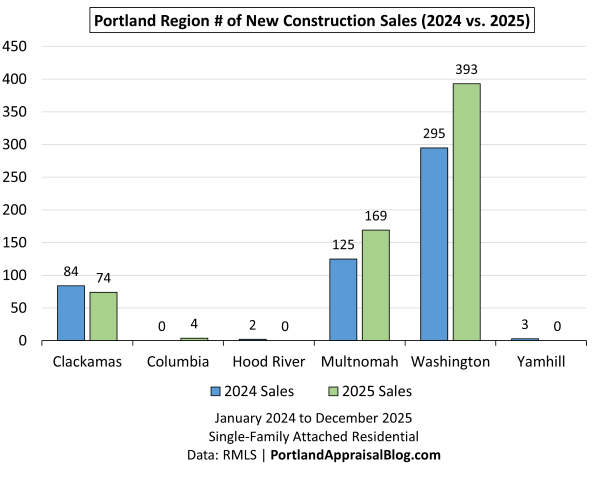
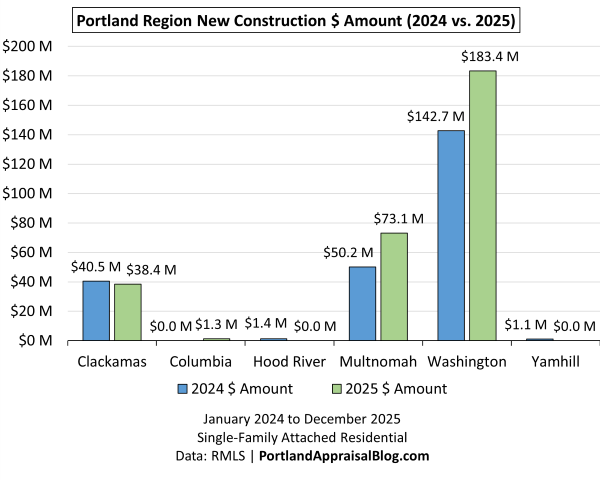
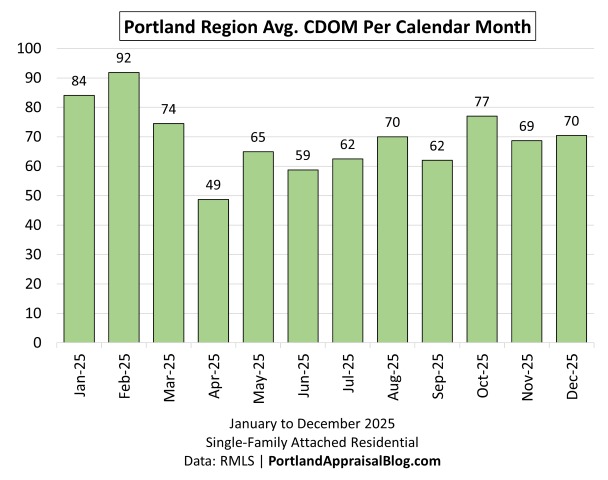
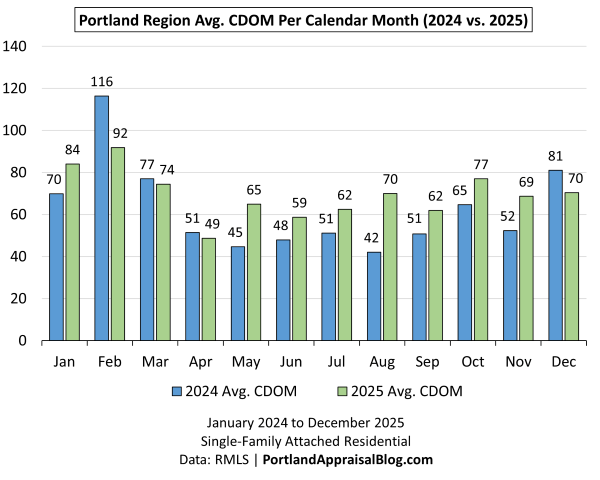
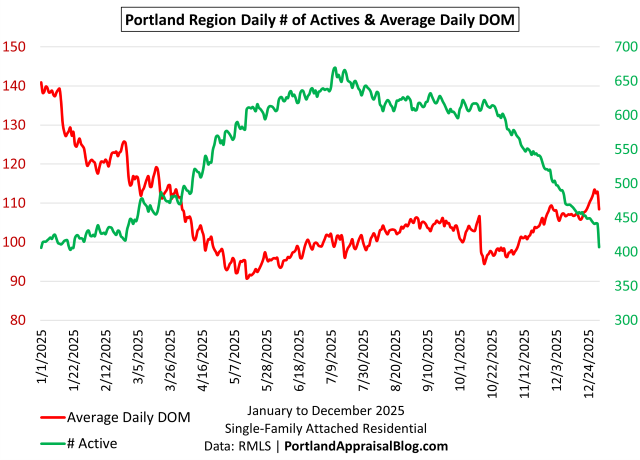
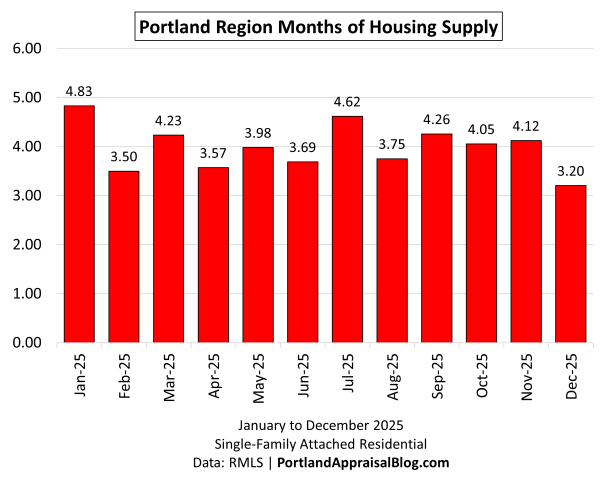
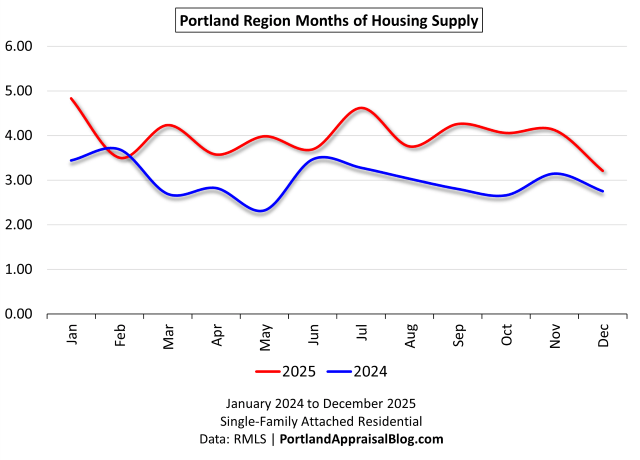
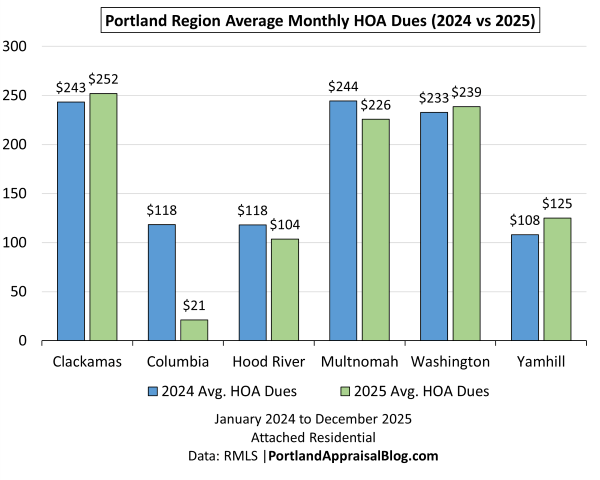
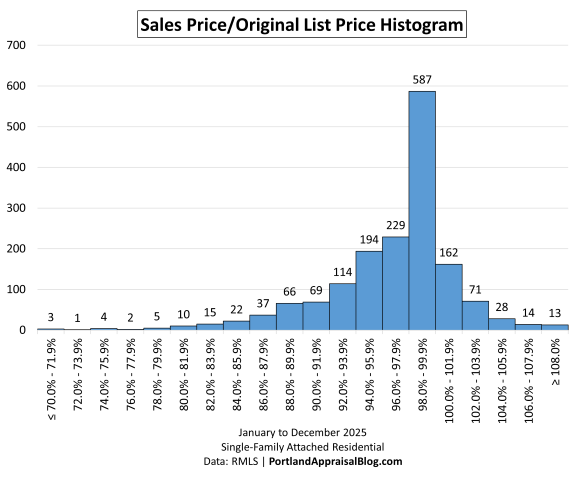
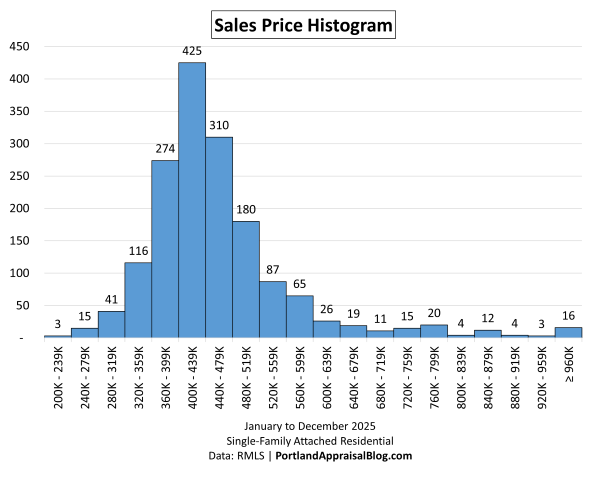
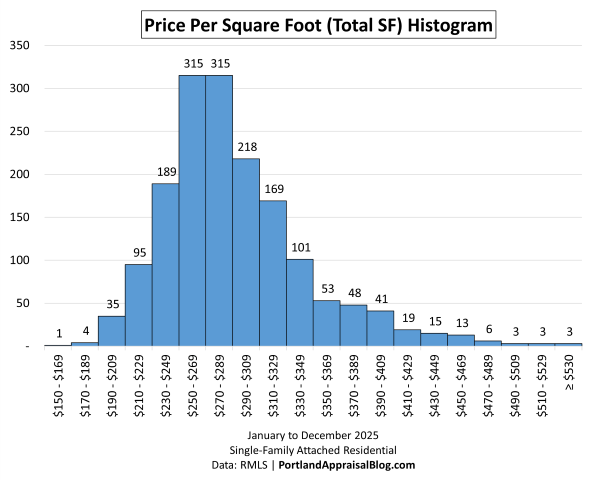
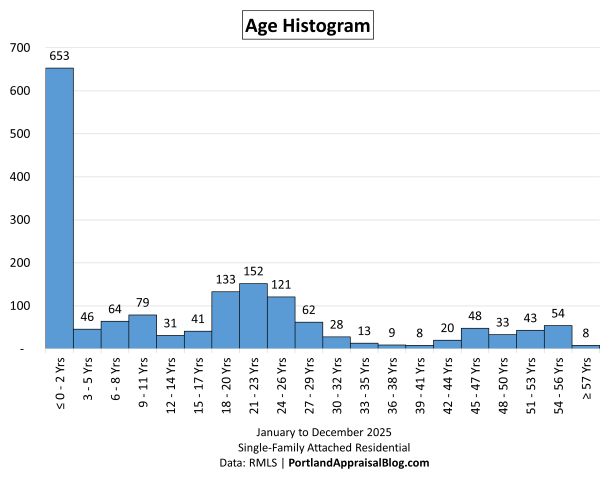
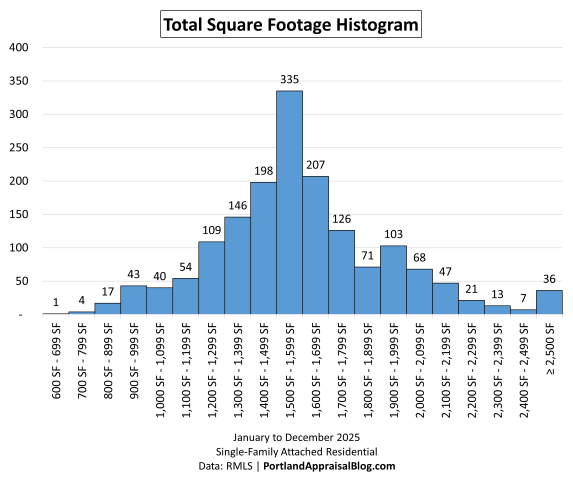
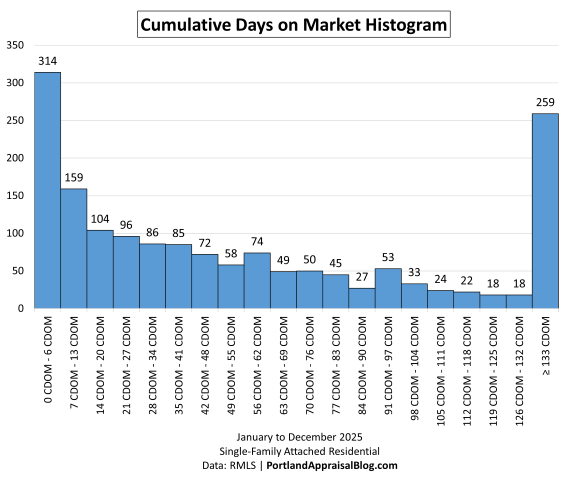
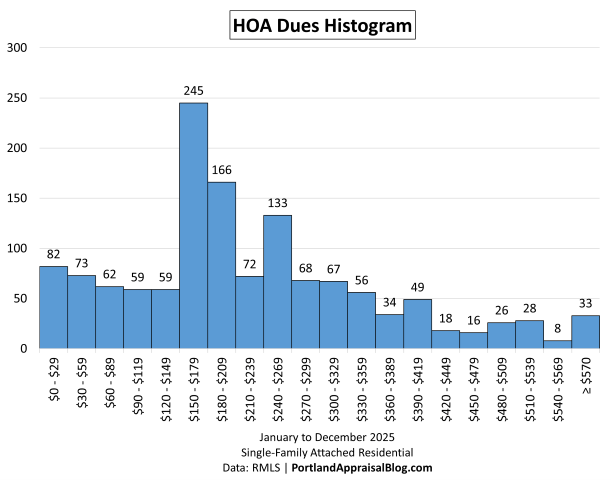
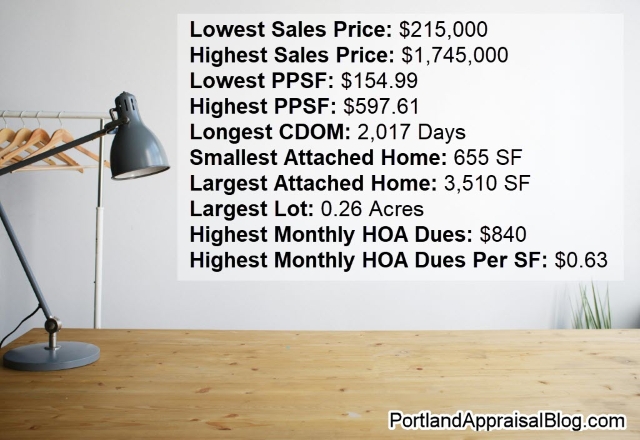
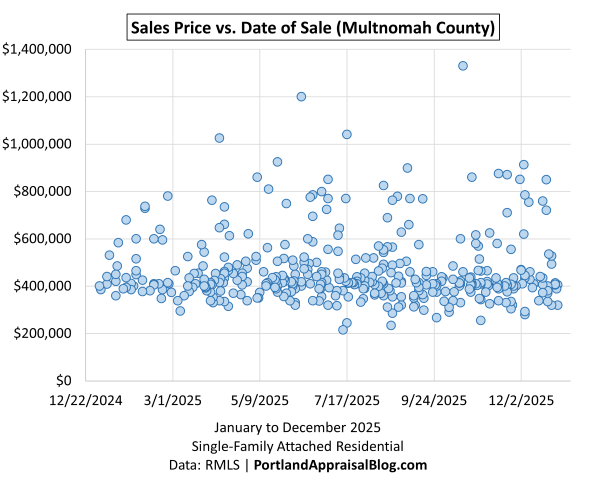
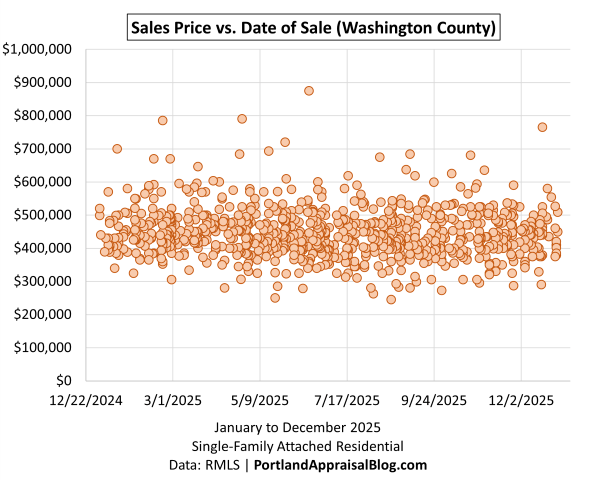
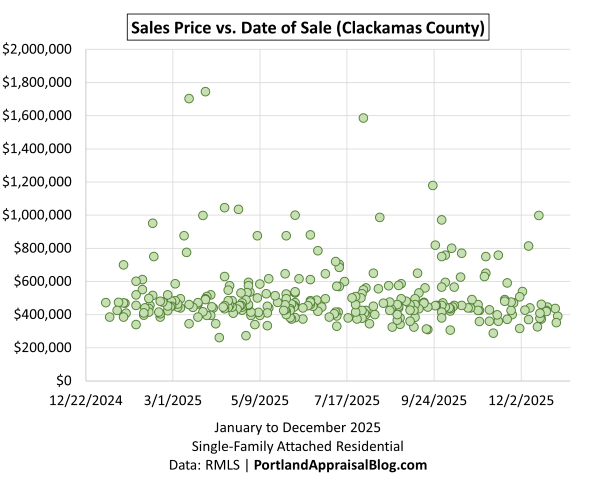
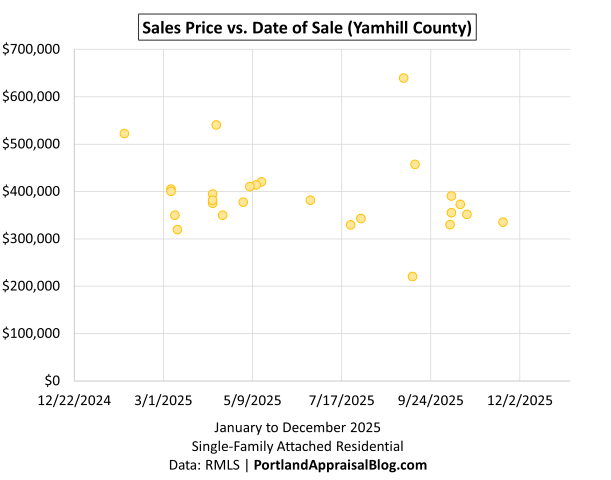
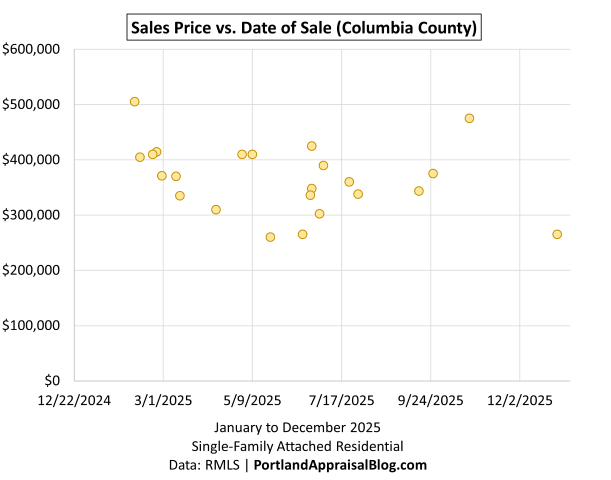
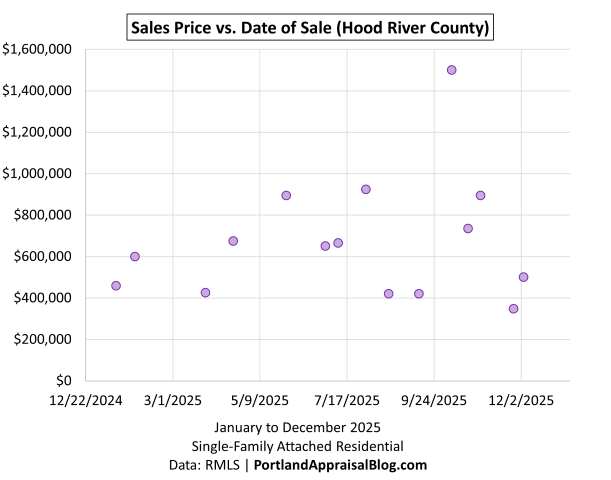


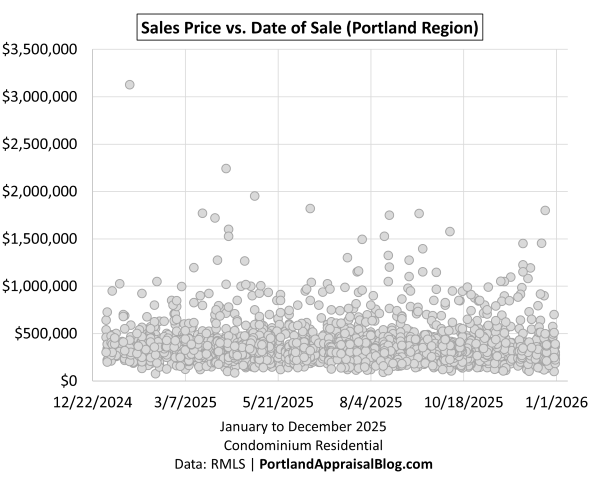
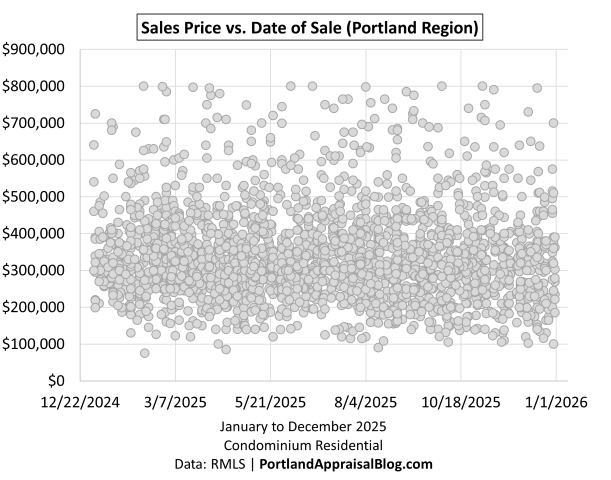
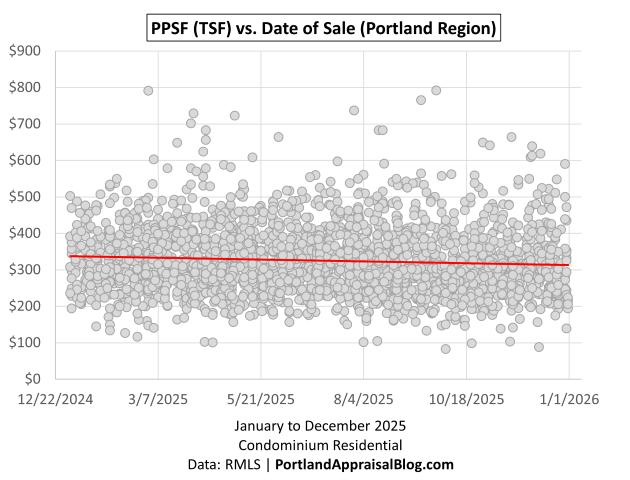
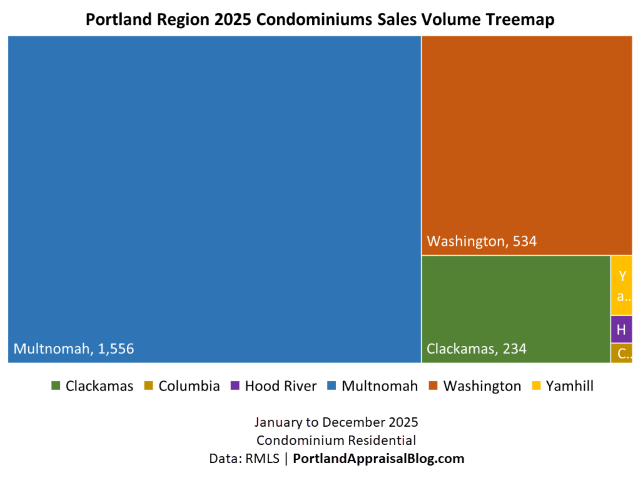
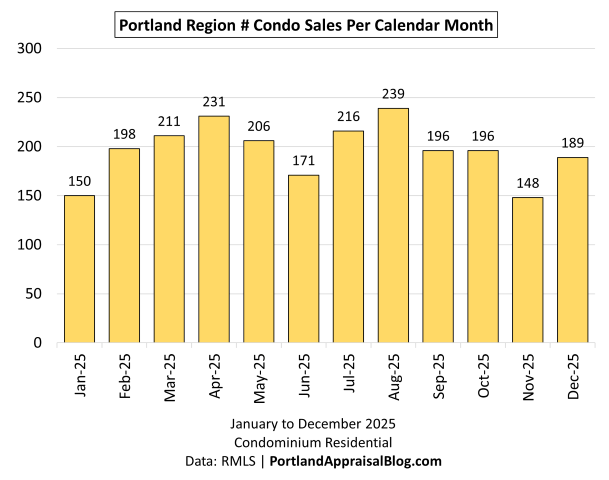
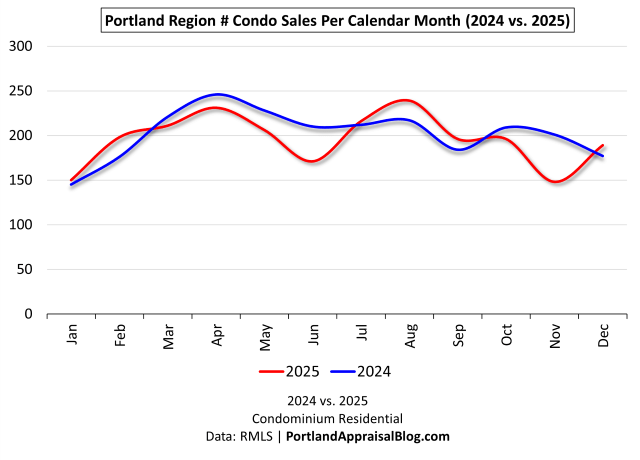
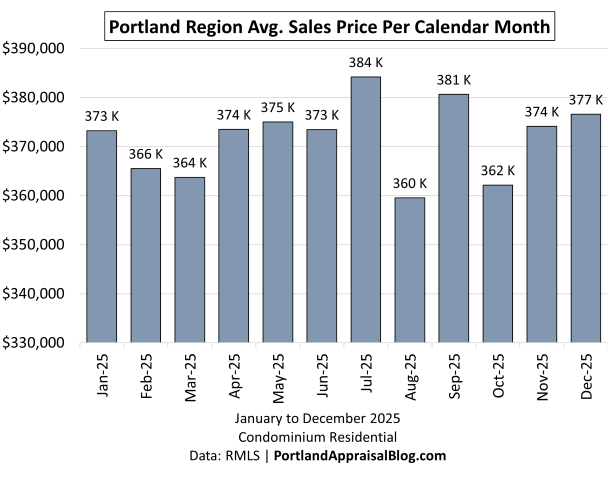
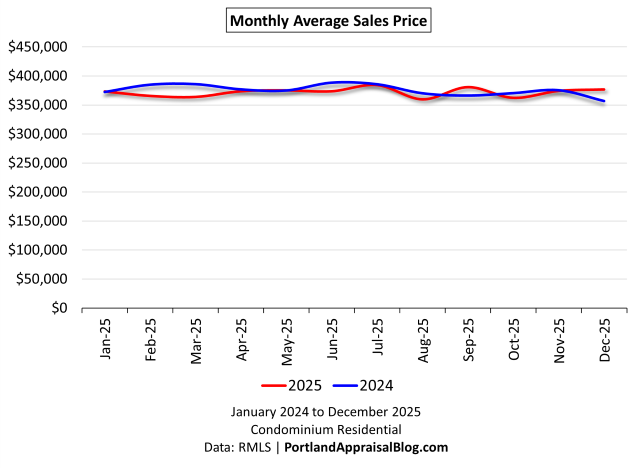
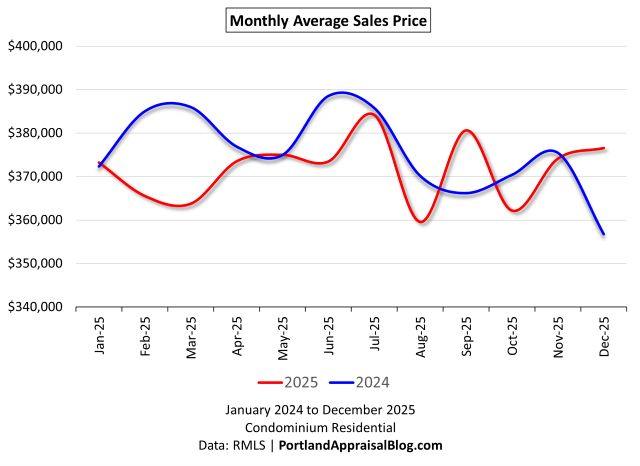
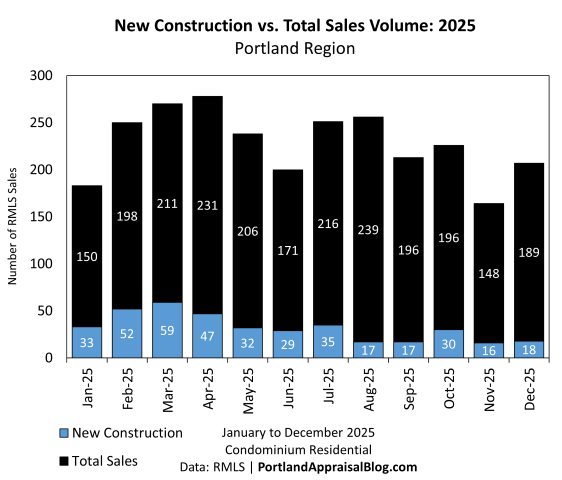
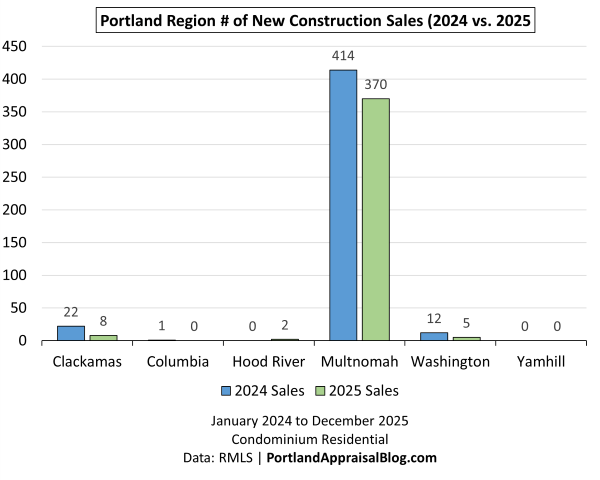
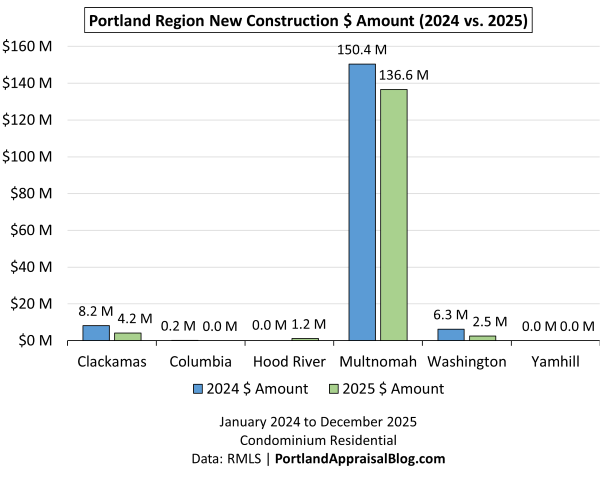
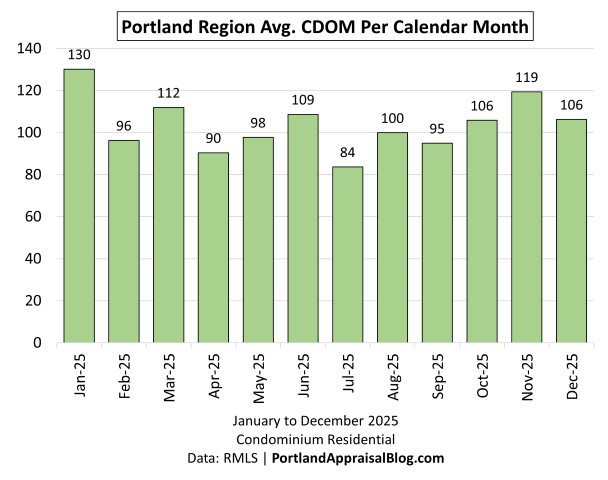
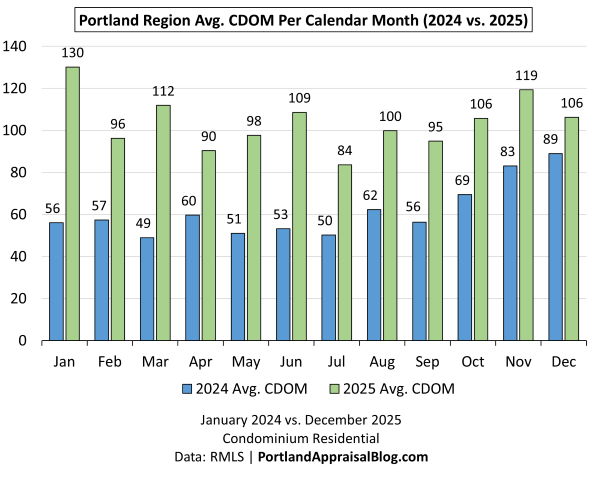
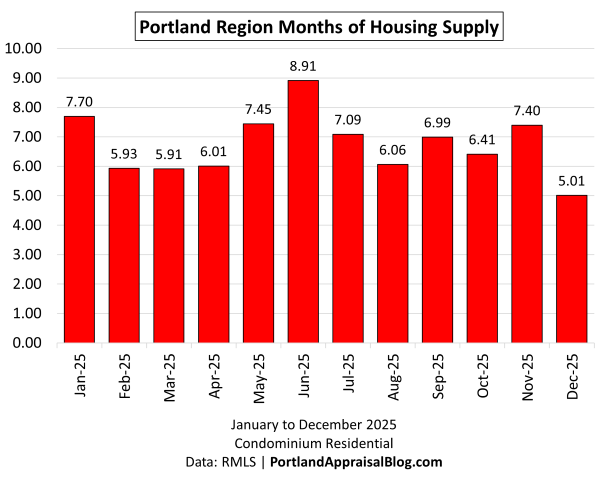
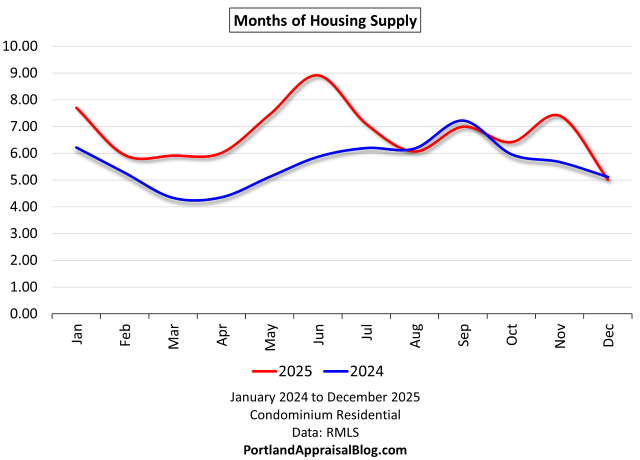
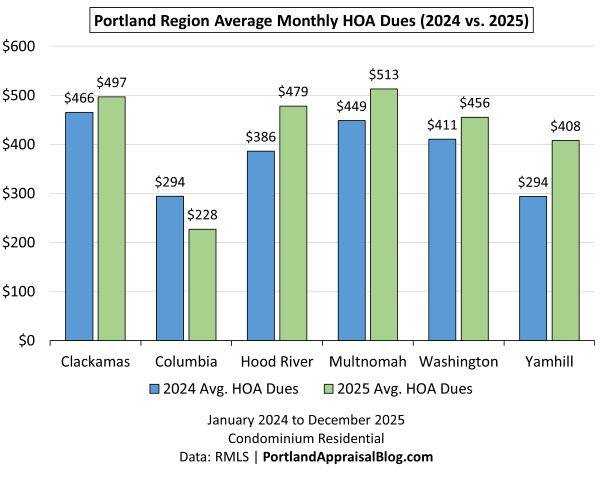
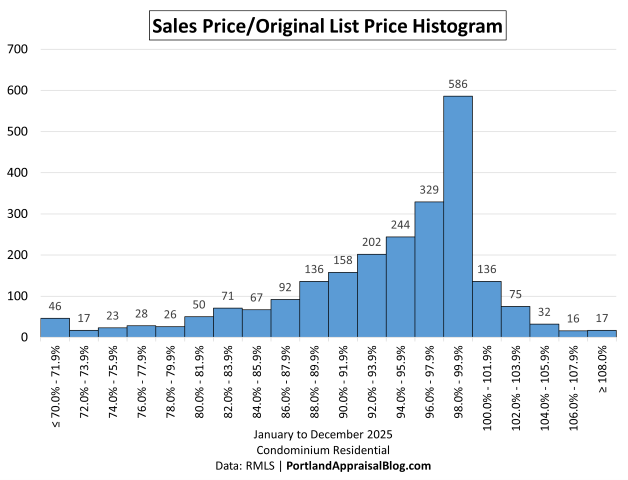
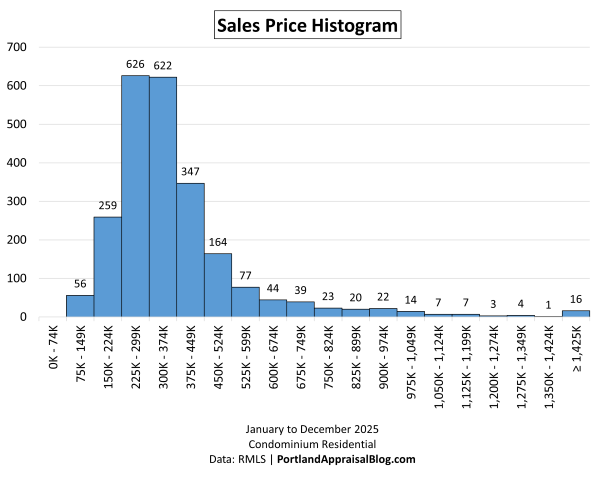
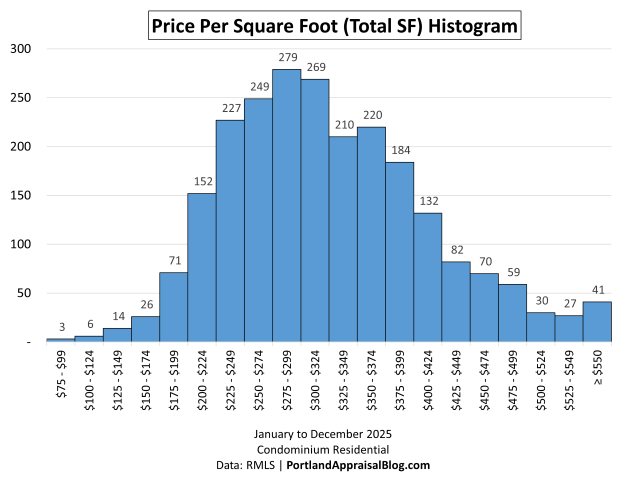
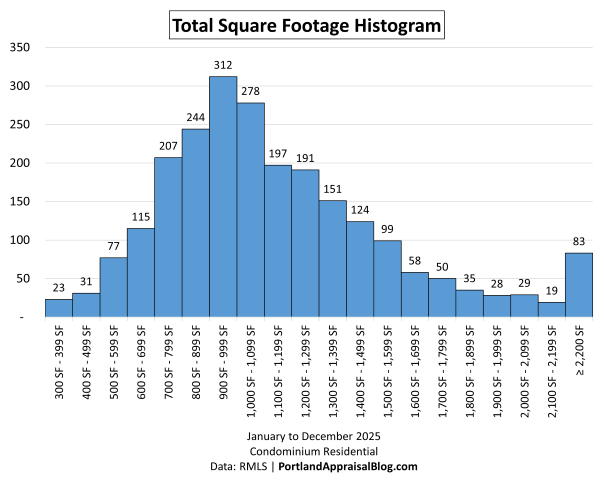
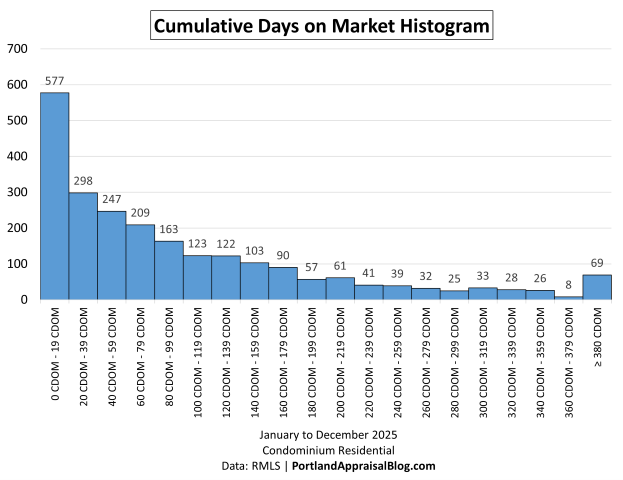
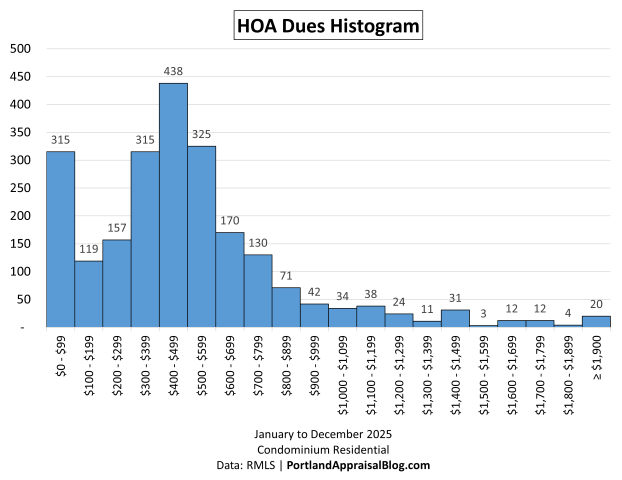
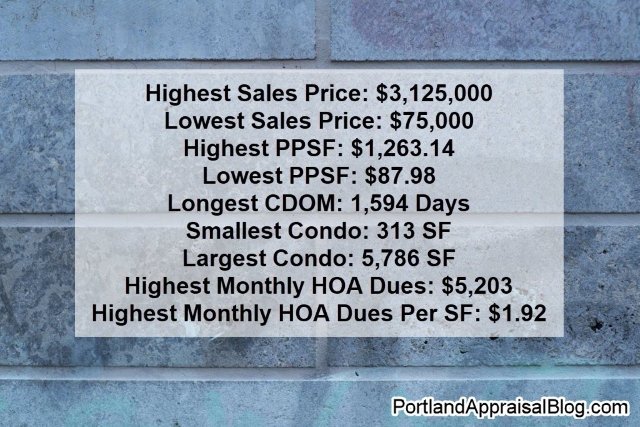
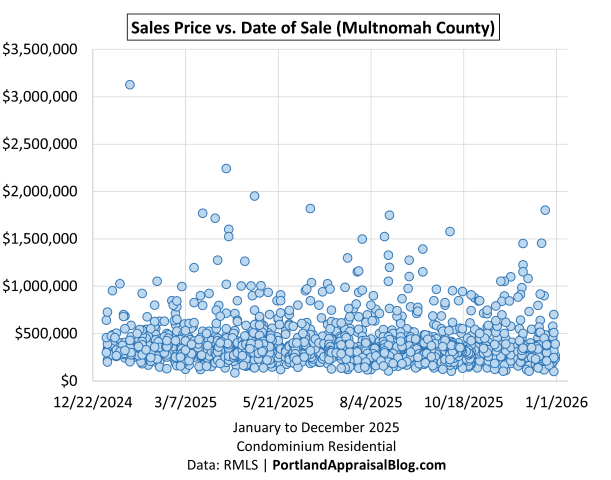
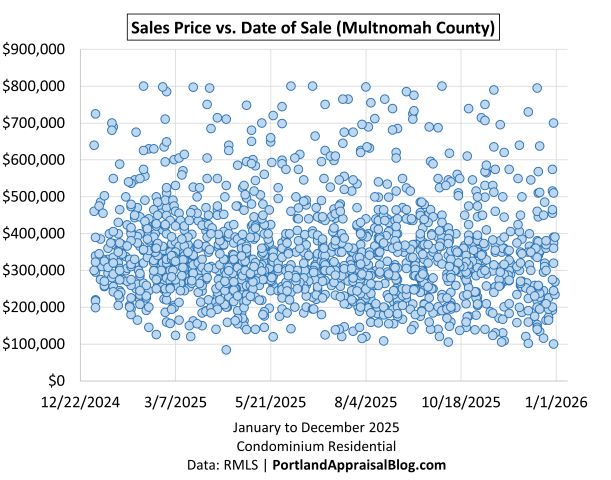
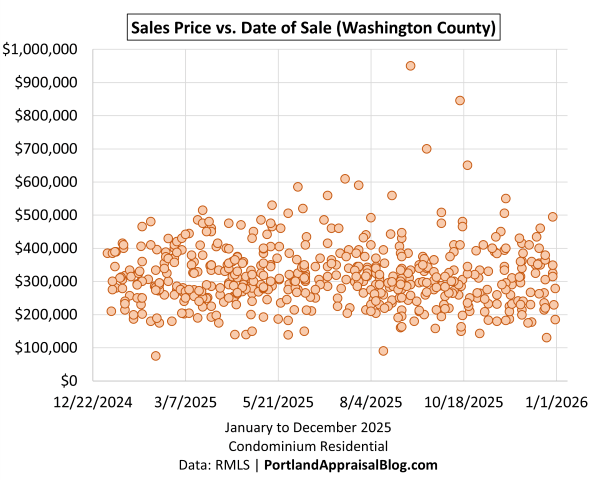
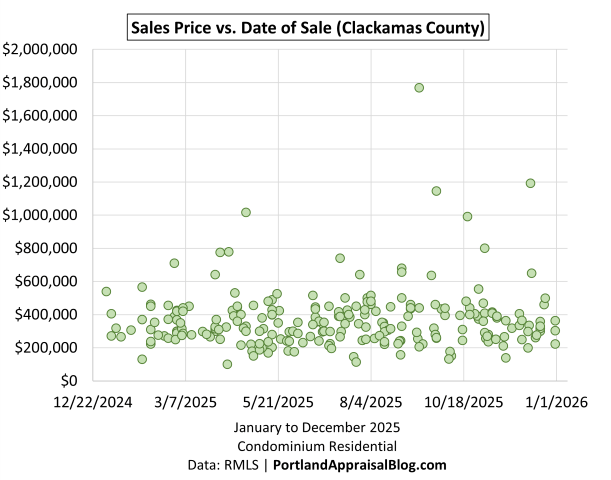
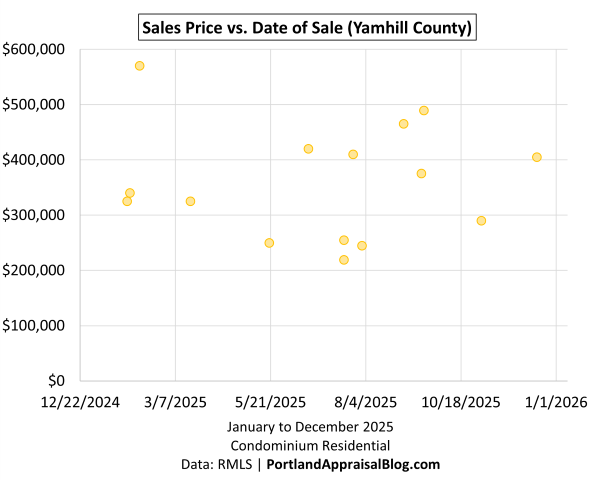
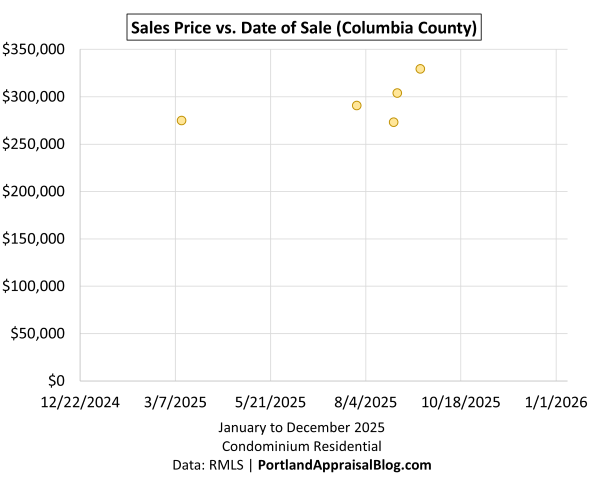
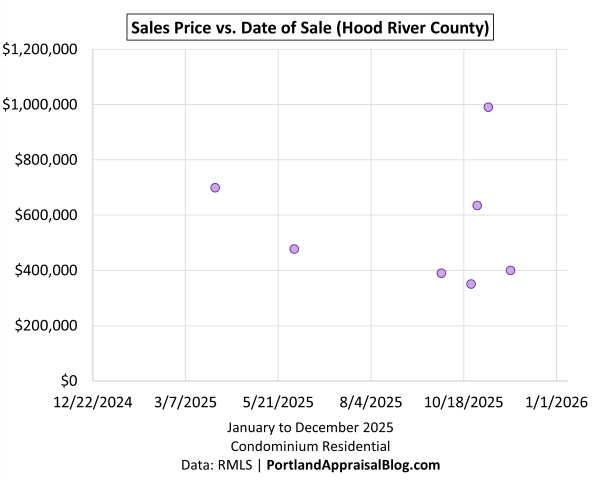

