Portland Real Estate Appraisal Brief – Friday, November 28, 2025: FHFA Q3 2025 House Price Index: National Trends, Oregon Context, and the Role of Appraisers

FHFA Q3 2025 HPI: U.S. +2.2% YoY, Oregon +0.31%, Portland MSA +1.51% — appraisal insights and practical implications for Portland appraisers and lenders.

National Overview & Oregon Statewide Performance

On November 25th, the Federal Housing Finance Agency (FHFA) released its Q3 2025 House Price Index (HPI). Nationally, home prices rose 0.2% quarter‑over‑quarter, and 2.2% year‑over‑year, reflecting a cooling but still positive trajectory across most regions.

Oregon posted +0.31% annual appreciation, ranking 45th nationally, with a –0.16% quarterly decline. These subdued figures mirror the broader West Coast trend: Washington registered +1.37% YoY, while California slipped –0.62% YoY. Oregon’s modest growth reflects a market in balance—neither surging nor contracting sharply.

Map showing Four-Quarter House Price Change by State.

Source: FHFA

Portland-Vancouver-Hillsboro MSA

In the “Purchase-only” FHFA index, the seven‑county Portland‑Vancouver‑Hillsboro MSA outperformed the statewide average slightly, recording +0.16% quarterly growth and +1.51% annual appreciation (” Seasonally Adjusted, Nominal” category). This MSA includes:

  • Oregon counties: Clackamas, Columbia, Multnomah, Washington, and Yamhill.
  • Washington counties: Clark and Skamania.

The inclusion of Clark County (Vancouver metro) is significant. Its size and activity often moderate or amplify Oregon‑centric trends, making the FHFA MSA lens broader than the Oregon‑only focus used in our local reporting.

In the “All-transactions” FHFA index, the values are similar but slightly different, recording -0.36% quarterly decline and +1.91% annual appreciation. This places the Portland‑Vancouver‑Hillsboro MSA 167th among all reporting MSAs.

Comparison with Our Six-County Oregon Focus

In our Q3 2025 Portland region market update (covering Columbia, Clackamas, Hood River, Multnomah, Washington, and Yamhill), we noted:

  • Median closed price flat at $600,000.
  • Cumulative days on market up to 52 (a 13%+ increase).
  • Sales volume essentially unchanged.

The FHFA’s +1.51% YoY for the seven‑county MSA aligns directionally with this stability but reflects slightly stronger performance due to Clark County’s contribution. When Clark and Skamania are excluded, the Oregon counties track closely with our reported flat medians and lengthening market times.

Methodology Matters: How FHFA Builds the HPI

The FHFA HPI is not just another dataset—it’s one of the most authoritative measures of U.S. housing trends. Here’s how it works:

  • Repeat-Sales Index: FHFA tracks the same property across multiple transactions to measure price changes over time.
  • Purchase Transactions: Use the sales price recorded in the mortgage data.
  • Refinance Transactions: Use the appraised value reported at the time of refinance (if an appraisal was ordered). Automated Valuation Models (AVMs) are not used.
  • Coverage: Only conforming conventional mortgages purchased or guaranteed by Fannie Mae and Freddie Mac are included.
  • New Construction: A new home enters the dataset when financed with a conforming mortgage, but it only contributes to the repeat-sales index once a second transaction occurs (sale or refinance).

This methodology ensures consistency and reliability, but it also means the index can lag in capturing brand‑new construction markets.

A Shoutout to Appraisers

Appraisers play a critical role in the FHFA dataset. Every time a refinance transaction includes an appraisal, that value becomes part of the HPI’s foundation. In other words:

  • Appraisal values anchor the index when no new sale price exists.
  • Consistency in appraisal practice ensures the HPI remains credible and defensible.
  • Local expertise matters: Appraisers’ ability to interpret market conditions, select comps, and apply adjustments directly influences the quality of the data feeding into national housing benchmarks.

Without appraisers, the FHFA’s “all‑transactions” index would be incomplete. Their work provides the bridge between raw market activity and standardized national reporting.

Appraisal Implications

Residential Valuations (1–4 Units):

  • Within Oregon counties, the FHFA’s +0.16% quarterly change supports only minimal positive time adjustments in paired‑sales analysis.
  • Of course, submarkets and particular neighborhoods may diverge from the broader trend. Appraisers must carefully define the competitive submarket for each property and measure market‑condition changes within that context.
  • Flat medians and longer days on market suggest no broad market‑condition adjustments are warranted for most single‑family assignments, but localized dynamics can still justify nuanced treatment.

Cross‑Border and Portfolio Work:

  • For assignments involving Clark or Skamania counties, or when lenders request regional context, the FHFA MSA index provides an authoritative benchmark.
  • The modest +1.51% annual growth reinforces conservative expectations for refinance, purchase, and estate‑planning valuations across the full seven‑county footprint.

Why This Matters

Homeowners, lenders, realtors, estate planners, and attorneys benefit from seeing both perspectives:

  • Oregon‑only trends (flat medians, longer marketing times)
  • FHFA’s broader MSA view (slightly stronger due to Clark County)

Together, they provide a fuller picture of market stability and cross‑border dynamics in the Portland metro.

Frequently Asked Questions (FAQ)

What is the FHFA House Price Index (HPI)?

The FHFA HPI is a repeat‑sales index that measures changes in single‑family home values using data from Fannie Mae and Freddie Mac mortgages. It tracks the same property across multiple transactions to calculate price changes over time.

Does the HPI measure home prices directly?

No. The HPI does not report the median or average home price in dollars. Instead, it measures the percentage change in value between two transactions of the same property.

  • Example: If a home sold for $300,000 in 2015 and then $360,000 in 2025, the HPI records a 20% increase.
  • The index is built entirely from these changes, not from raw price levels. This makes the HPI excellent for tracking market movement, while MLS data is better for reporting actual price levels.

How does the repeat‑sales methodology work?

  • The index only includes properties with at least two transactions (purchase or refinance).
  • It measures the change in value between those two points, not the absolute level of prices.
  • This approach reduces noise from property differences and focuses on market movement.

What about new construction?

  • A new construction sale enters the dataset when financed with a conforming conventional mortgage.
  • However, it does not contribute to the repeat‑sales index until a subsequent transaction occurs (another sale or a refinance with an appraisal).
  • In other words, the first sale is logged, but the property only becomes “active” in the index once there’s a second data point.

What are the implications of this approach?

  • Coverage bias: The HPI does not immediately reflect brand‑new construction markets.
  • Lag effect: It takes time for new construction to show up in the index, often when owners refinance or resell.
  • Complementary data: FHFA also publishes purchase‑only indices (sales prices only) and expanded‑data indices (including FHA and county recorder data) to capture broader market activity.

Do refinances count in the FHFA HPI?

Yes. When a refinance includes an appraisal, the appraised value is used as the second transaction point. Automated Valuation Models (AVMs) are not used. This makes appraisers’ work central to the dataset.

Which counties are included in the Portland‑Vancouver‑Hillsboro MSA?

The FHFA defines the Portland MSA as seven counties:

  • Oregon: Clackamas, Columbia, Multnomah, Washington, Yamhill
  • Washington: Clark, Skamania

This differs from our six‑county Oregon‑only focus, which includes Hood River but excludes Clark and Skamania.

How does FHFA data differ from RMLS or local MLS data?

FHFA data is based on conforming conventional mortgage transactions purchased or guaranteed by Fannie Mae and Freddie Mac. It provides a broad index of price changes, useful for regional benchmarking.

By contrast, RMLS (and other local MLS systems) reflect all listing and sales activity, regardless of financing type. This includes transactions financed with FHA, VA, jumbo loans, private financing, and even cash sales. RMLS also reports granular metrics such as median prices, days on market, and sales volume.

👉 In short: FHFA offers a standardized, mortgage‑based view of price movement, while RMLS captures the full spectrum of market activity, making it indispensable for appraisers and analysts who need transaction‑level detail.

Sources & Further Reading

  • FHFA House Price Index Quarterly Report 2025Q3 (full report)
  • FHA All Transactions Quarterly Tables (Q3 2025)

For current market context on inventory and pricing trends in the Portland region, see our Q3 2025 Market Update.

Thanks for reading—I hope you found a useful insight or an unexpected nugget along the way. If you enjoyed the post, please consider subscribing for future updates.

Question: Do you think Q4 2025 will be flat in Oregon, or will see some significant price movement?

Coda

Are you an agent in Portland who wonders why appraisers always do “x”?

A homeowner with questions about appraiser methodology?

If so, feel free to reach out—I enjoy connecting with market participants across Portland and the surrounding counties, and am always happy to help where I can.

And if you’re in need of appraisal services in Portland or anywhere in the Portland Region, we’d be glad to assist.

About the Author — Abdur Abdul‑Malik, SRA, ASA

Abdur Abdul‑Malik is the founder, author, and publisher of the Portland Appraisal Blog, where he produces original regional and neighborhood‑level housing analytics for the Portland Region. He is a certified residential appraiser serving Oregon and Washington, drawing on RMLS transaction data, public records, and custom segmentation models he has built.

He developed the Portland Appraisal Blog Affordability Index (PABAI), a payment‑based affordability metric built from actual RMLS sales. PABAI incorporates weekly updates based on the prevailing 30‑year fixed mortgage rate, providing a locally grounded measure of housing affordability across the region.

Learn more → PABAI explainer • mortgage rate series • full author bio

Portland Real Estate Appraisal Brief – Thursday, November 27, 2025: $21M in Unspent Rental Fees Discovered

A recent city review found that Portland has accumulated approximately $21 million in rental-registry fees that were designated to support emergency rental assistance and eviction-prevention programs. During the period in which these funds remained unused, landlords in Multnomah County filed an estimated 800 to 1,200 eviction cases per month, though not all filings result in an eviction order.

Portland Oregon skyline at sunset with Mount Hood in the background and overlay text “$21 Million in Unspent Rental Assistance Funds,” illustrating the impact of housing policy and unspent rental-aid funds on the Portland metro real estate appraisal market.

The rental-registry program requires landlords to pay fees and register units, with the revenue earmarked specifically for tenant-support programs. Poor tracking and administrative delays left the money unspent, even as demand for rental aid remained elevated across the Portland metro area.

Leadership Change and Severance Package

The discovery coincided with the resignation of Portland Housing Bureau Director Helmi Hisserich. Following paid administrative leave, Hisserich received a severance package equal to her full annual salary of approximately $241,000. The city continues to examine how the funds went unused for an extended period.

Appraisal Implications in the Portland Region

Residential Properties (1–4 Units)

The unspent funds have no immediate direct effect on comparable sales selection or adjustment grids for typical single-family or small-multifamily appraisals in the Portland metro area. Broader affordability pressure and eviction volume remain relevant market-condition factors, but no abrupt shift in residential values is likely from this development alone.

Commercial Multifamily and Investor-Owned Properties

If the $21 million is successfully redeployed for rental assistance and eviction defense, occupancy stability in larger apartment properties (5+ units) could improve. Lower economic vacancy risk and reduced turnover expense represent positive influences on net operating income, which in turn support lower capitalization rates and higher valuations for income-producing assets across the region.

Appraisers working on commercial assignments in Multnomah County should monitor city council actions regarding reallocation of these funds in the coming weeks to months.

Homeowners, lenders, realtors, estate planners, and attorneys relying on accurate valuation of investment-grade multifamily residential properties will benefit from understanding how policy execution—or delays—can influence income metrics and risk adjustments in appraisal reports.

Sources & Further Reading

Thanks for reading—I hope you found a useful insight or an unexpected nugget along the way. If you enjoyed the post, please consider subscribing for future updates.

Question: Do you think the $21 million will be disbursed soon, or will it take months before the funds can be used for rental assistance?

Coda

Are you an agent in Portland who wonders why appraisers always do “x”?

A homeowner with questions about appraiser methodology?

If so, feel free to reach out—I enjoy connecting with market participants across Portland and the surrounding counties, and am always happy to help where I can.

And if you’re in need of appraisal services in Portland or anywhere in the Portland Region, we’d be glad to assist.

About the Author — Abdur Abdul‑Malik, SRA, ASA

Abdur Abdul‑Malik is the founder, author, and publisher of the Portland Appraisal Blog, where he produces original regional and neighborhood‑level housing analytics for the Portland Region. He is a certified residential appraiser serving Oregon and Washington, drawing on RMLS transaction data, public records, and custom segmentation models he has built.

He developed the Portland Appraisal Blog Affordability Index (PABAI), a payment‑based affordability metric built from actual RMLS sales. PABAI incorporates weekly updates based on the prevailing 30‑year fixed mortgage rate, providing a locally grounded measure of housing affordability across the region.

Learn more → PABAI explainer • mortgage rate series • full author bio

Portland Real Estate Appraisal Brief – Wednesday, November 26, 2025: Oregon’s New 7‑Hour Anti‑Bias CE Requirement Starts January 1, 2026

Appraisers don’t create the market—we measure it. Much like reporting the weather, our role is to analyze conditions, not control them. Oregon’s new 7‑hour anti‑bias CE requirement reinforces accountability, ensuring appraisal reports remain fair, transparent, and free from unintended influences.

Map of Oregon showing all counties and a banner at the top announcing new continuing education requirement in anti-bias training for appraisers.

Starting January 1, 2026, every licensed appraiser in Oregon must complete a 7‑hour course on Valuation Bias and Fair Housing Laws and Regulations, followed by at least 4 hours every subsequent two‑year renewal cycle. The mandate (OAR 161‑010‑0010, amended July 2025) does not increase total continuing education hours—Oregon still requires 28 hours per cycle—but carves out dedicated time for bias and fair‑housing training.

The goal is straightforward: strengthen appraisers’ ability to recognize and eliminate unconscious bias in comparable selection, adjustments, and reporting. For homeowners, realtors, attorneys, and lenders in the Portland metro, this means clearer documentation in appraisal reports, making it easier to understand and challenge valuation decisions.

Why This Training Matters for Everyday Appraisals

Bias most often shows up in the judgment calls appraisers make every day—choosing which sales to include or exclude, deciding whether an adjustment is warranted, or how large it should be.

Under USPAP, appraisers are not required to make any specific adjustment. What USPAP does require is that the analysis be credible, adequately supported, clearly explained, and never misleading. It also explicitly prohibits bias of any kind.

This new training reinforces those obligations with practical tools and case studies, so reports become even more transparent and defensible.

Practical Takeaways for Homeowners, Realtors, and Lenders

  • Expect slightly longer, more detailed appraisal reports starting in 2026—especially around comparable selection and adjustment rationale.
  • Over‑improved properties (e.g., high‑end renovations in modest subdivisions) will still be adjusted to market evidence, but the reasoning will be spelled out more explicitly.
  • Rebuttals and reconsideration of value requests should become easier to evaluate because the appraiser’s decision path will be clearer.

Appraisers don’t set market value—we measure it. Clearer documentation simply helps everyone see the measurement process more accurately.

Addressing Common Challenges

One frequent point of tension arises with over‑improved properties. Homeowners may expect comps from upscale areas, but market evidence must guide adjustments. Recent lawsuits have spotlighted these disconnects between owner expectations and data‑driven conclusions, underscoring the need for explicit explanations.

The training won’t alter core appraisal standards, but it will equip appraisers to better articulate their rationale, strengthening rebuttal packages and fostering trust.

The Bigger Picture for Portland Metro Professionals

Again, appraisers don’t create the market—we report it. We are a lot like Al Roker, who reports the weather, not make it! This new requirement promotes accountability, ensuring reports are fair, accurate, and free from unintended influences.

In a region like the Portland metro, where diverse neighborhoods drive varied valuation dynamics, clearer processes benefit everyone involved in transactions. For those who’ve navigated over‑improvement appraisals, the added transparency could smooth future interactions. Sharing experiences helps refine practices across the industry.

Sources & Further Reading

For current market context on inventory and pricing trends affecting comp selection in the Portland region, see our Q3 2025 Market Update.

Thanks for reading—I hope you found a useful insight or an unexpected nugget along the way. If you enjoyed the post, please consider subscribing for future updates.

Question: Do you think the new training requirement will have a material impact on valuation disputes?

Coda

Are you an agent in Portland who wonders why appraisers always do “x”?

A homeowner with questions about appraiser methodology?

If so, feel free to reach out—I enjoy connecting with market participants across Portland and the surrounding counties, and am always happy to help where I can.

And if you’re in need of appraisal services in Portland or anywhere in the Portland Region, we’d be glad to assist.

About the Author — Abdur Abdul‑Malik, SRA, ASA

Abdur Abdul‑Malik is the founder, author, and publisher of the Portland Appraisal Blog, where he produces original regional and neighborhood‑level housing analytics for the Portland Region. He is a certified residential appraiser serving Oregon and Washington, drawing on RMLS transaction data, public records, and custom segmentation models he has built.

He developed the Portland Appraisal Blog Affordability Index (PABAI), a payment‑based affordability metric built from actual RMLS sales. PABAI incorporates weekly updates based on the prevailing 30‑year fixed mortgage rate, providing a locally grounded measure of housing affordability across the region.

Learn more → PABAI explainer • mortgage rate series • full author bio

Portland Real Estate Appraisal Brief – Tuesday, November 25, 2025: Oregon Joins $7 Million Proposed Settlement with Greystar Over RealPage Rent-Setting Practices

Oregon and eight other states filed a proposed $7M settlement with Greystar, affecting ~19,000 Portland apartments. Appraisers and buyers are watching for 2026 rent softening and cap rate shifts.

A coalition of nine states led by Oregon and California has filed a proposed $7 million settlement with Greystar Management Services — the nation’s largest rental housing operator — over allegations that Greystar used RealPage software to illegally coordinate rent pricing across competing properties.

The settlement, if approved by a federal court, would permanently bar Greystar from sharing non-public rent and occupancy data with competitors and from using RealPage’s hyper-local pricing recommendations. A separate DOJ consent decree filed against RealPage itself imposes similar behavioral restrictions and a three-year independent monitor.

Greystar manages approximately 19,000 apartment units in the Portland metro area — roughly 10 % of the region’s multifamily inventory. State investigators have estimated that RealPage-enabled pricing affected roughly one in five multifamily units statewide.

Image of large apartment complex with a "For Rent" sign superimposed.

For homeowners, buyers, agents, and lenders, the most immediate question is whether these enforcement actions will translate into meaningful rent relief in 2026 and beyond.

The Direct Impact on Purchasing Power

A renter currently paying a $200 “algorithm premium” (the difference between market rent and coordinated rent loses $2,400 annually that could otherwise go toward a down payment.

Even a modest 5–8 % softening in rents after these settlements would return $110–$176 per month to the typical household, equating to $4,000–$10,600 in additional savings over three to five years.

What Appraisers Are Watching in 2026

  1. Cap rate movement on institutional-grade (50+ unit) apartment buildings
  2. Total scheduled gross revenue trends at properties previously managed with revenue-management software

If rents soften and risk premiums rise, cap rates will widen first on larger assets. That pressure eventually flows through to gross rent multipliers (GRMs) on 1–4 unit residential income properties — either compressing GRMs if sale prices adjust faster than rents, or temporarily expanding them if prices lag.

We likely won’t see clear signals until mid-2026, but the direction of travel will matter for every appraisal involving the income approach in the region.

Bottom Line

Combined with new multifamily supply now entering the pipeline, these twin enforcement actions represent the strongest downward pressure on algorithmic rent growth Portland has seen since the pandemic began.

Sources & Further Reading

For broader quarterly context on inventory, pricing, and market segmentation trends in the Portland region, see our most recent Q3 2025 Market Update.

Decorative text border banner before outro and coda.

Thanks for reading—I hope you found a useful insight or an unexpected nugget along the way. If you enjoyed the post, please consider subscribing for future updates.

Question: Do you think we’ll see any meaningful slowdown in rent increases in the Portland area?

Coda

Are you an agent in Portland who wonders why appraisers always do “x”?

A homeowner with questions about appraiser methodology?

If so, feel free to reach out—I enjoy connecting with market participants across Portland and the surrounding counties, and am always happy to help where I can.

And if you’re in need of appraisal services in Portland or anywhere in the Portland Region, we’d be glad to assist.

About the Author — Abdur Abdul‑Malik, SRA, ASA

Abdur Abdul‑Malik is the founder, author, and publisher of the Portland Appraisal Blog, where he produces original regional and neighborhood‑level housing analytics for the Portland Region. He is a certified residential appraiser serving Oregon and Washington, drawing on RMLS transaction data, public records, and custom segmentation models he has built.

He developed the Portland Appraisal Blog Affordability Index (PABAI), a payment‑based affordability metric built from actual RMLS sales. PABAI incorporates weekly updates based on the prevailing 30‑year fixed mortgage rate, providing a locally grounded measure of housing affordability across the region.

Learn more → PABAI explainer • mortgage rate series • full author bio

Portland Real Estate Appraisal Brief – Monday, November 24, 2025: NAR RCI Shows Rising First-Time Buyers Amid Cooling Confidence

NAR October 2025 RCI: First-time buyers at 32%, DOM at 34 days, and 19% waived appraisals in Portland metro. Insights for realtors and homeowners on comp stability and market shifts.

October 2025 NAR REALTORS® Confidence Index report cover with Portland Oregon skyline and Mount Hood – key market trends for Portland metro real estate appraisers


The National Association of REALTORS® (NAR) has released its October 2025 REALTORS® Confidence Index (RCI), revealing a market with subtle shifts that Portland metro real estate professionals should monitor closely. First-time buyers climbed to 32% of transactions, supported by growing inventory and modestly lower rates, though overall confidence dipped—with only 17% of REALTORS® expecting year-over-year buyer traffic increases in the next three months, and 16% for sellers. Cash sales remained steady at 29%, while homes received an average of 2.1 offers, and 19% sold above list price.

For appraisers in the Portland area, these trends suggest more stable comparable sales (comps), but they also highlight persistent risks from contingencies, with 19% of buyers waiving appraisals and 6% of delayed settlements linked to valuation issues. This creates opportunities for thorough, defensible reports that address local market segmentation.

The RCI: A National Pulse with Local Relevance

The RCI draws from a survey of approximately 1,800 REALTORS® conducted November 1–16, 2025, focusing on buyer and seller activity, financing, contingencies, and sentiment. Unlike local MLS data such as RMLS, which tracks completed transactions, the RCI captures forward-looking expectations. In the Portland metro, including Vancouver, WA, combining these insights ensures appraisals reflect both anticipated trends and on-the-ground realities, particularly in cross-border markets.

Key Market Indicators Shaping Appraisals

October’s data points to a gradual easing:

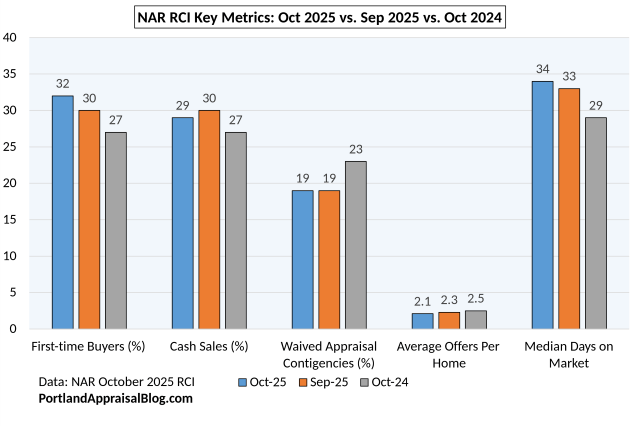
  • Median Days on Market (DOM): 34 days (up from 33 in September 2025 and 29 in October 2024).
  • First-Time Buyers: 32% of transactions (up from 30% in September 2025 and 27% in October 2024), signaling stronger entry-level demand.
  • Cash Sales: 29% (down slightly from 30% in September 2025, up from 27% in October 2024).
  • Distressed Sales: 2% (unchanged from prior months).

While days on market are up year over year, the time homes are spending on market is not excessive. There is a bit more time for negotiations. I go into detail about rising days on market in my Portland Region Q3 2025 Market Update.

Buyer Shifts and Contingency Considerations

Buyers are navigating a slightly less competitive landscape, which influences appraisal timelines and risks:

  • 20% waived inspection contingencies (flat from September 2025).
  • 19% waived appraisal contingencies (flat from September 2025, down from 23% in October 2024)—a trend that eases renegotiation pressures for Portland appraisers.
  • 5% completed purchases via virtual tours only (unchanged).
  • 82% of purchases occurred in suburban, small town, rural, or resort areas (down from 87% in September 2025).

In Multnomah County and Vancouver, WA, this suburban preference reshapes comp pools, emphasizing the need for carefully defined competitive areas—location matters!

Seller Dynamics: Fewer Offers, More Scrutiny

Sellers are adjusting to softer demand, with implications for pricing and close processes:

  • Average offers per home: 2.1 (down from 2.3 in September 2025 and 2.5 in October 2024).
  • 19% sold above list price (down from 21% in September 2025, flat from October 2024).
  • 2% sold to iBuyers (up from 1% in September 2025).
  • Median time to close: 30 days (unchanged).
  • 7% of contracts terminated (up from 6% in September 2025).
  • 14% experienced delayed settlements (unchanged).
NAR October 2025 REALTORS® Confidence Index Key Market Indicators table showing median days on market 34, first-time buyers 32%, cash sales 29%, and properties sold above list price 19% – critical data for Portland Oregon real estate appraisers

For realtors and lenders in the Portland metro, rising terminations underscore the importance of appraisals backed by solid, verifiable comps. As I detailed in my Portland Region Q3 2025 Market Update, the sales price to original list price ratio has been declining.

Outlook: Tempered Optimism and Suburban Focus

REALTOR® confidence softened amid these changes:

  • 17% anticipate buyer traffic growth year over year in the next three months (down from 20% in September 2025).
  • 16% expect seller traffic increases (down from 19% in September 2025).
  • 29% of buyers prioritized work-from-home features (down from 34% in September 2025).

This aligns with the Portland Region’s ongoing suburban migration, impacting comp selection in Clackamas and Washington Counties. Homeowners and attorneys preparing for transactions should carefully read reports to verify they incorporate these broader sentiment shifts.

Implications for Portland Metro Valuations

The RCI’s blend of buyer gains and fading enthusiasm points to a transitional market: enhanced first-time activity promotes equitable pricing, but elevated terminations (7%) reveal gaps in expectations. For further details, explore the full report here, the main RCI page, or the existing-home sales tie-in. See also my Portland Region Q3 2025 Market Update.

NAR REALTORS® Confidence Index bar chart comparing Oct 2025 vs Sep 2025 vs Oct 2024: first-time buyers 32%, cash sales 29%, waived appraisal contingencies 19%, average offers 2.1, median DOM 34 days – PortlandAppraisalBlog.com

Thanks for reading—I hope you found a useful insight or an unexpected nugget along the way. If you enjoyed the post, please consider subscribing for future updates.

Question: Do you think lower mortgage rates will propel the market to new heights?

Coda

Are you an agent in Portland who wonders why appraisers always do “x”?

A homeowner with questions about appraiser methodology?

If so, feel free to reach out—I enjoy connecting with market participants across Portland and the surrounding counties, and am always happy to help where I can.

And if you’re in need of appraisal services in Portland or anywhere in the Portland Region, we’d be glad to assist.

About the Author — Abdur Abdul‑Malik, SRA, ASA

Abdur Abdul‑Malik is the founder, author, and publisher of the Portland Appraisal Blog, where he produces original regional and neighborhood‑level housing analytics for the Portland Region. He is a certified residential appraiser serving Oregon and Washington, drawing on RMLS transaction data, public records, and custom segmentation models he has built.

He developed the Portland Appraisal Blog Affordability Index (PABAI), a payment‑based affordability metric built from actual RMLS sales. PABAI incorporates weekly updates based on the prevailing 30‑year fixed mortgage rate, providing a locally grounded measure of housing affordability across the region.

Learn more → PABAI explainer • mortgage rate series • full author bio