Intel cut over 4,400 jobs in Hillsboro from 2024–2025—mostly local. Headline prices looked stable, but condos, attached homes, and detached homes all fell when you strip out new construction. And days on market have jumped 36-63%! This shows external obsolescence hitting the Hillsboro market.
Are you an agent in Portland who wonders why appraisers always do “x”?
A homeowner with questions about appraiser methodology?
If so, feel free to reach out—I enjoy connecting with market participants across Portland and the surrounding counties, and am always happy to help where I can.
And if you’re in need of appraisal services in Portland or anywhere in the Portland Region, we’d be glad to assist.
hollywoodHUB delivers 126 family-sized affordable units—including 32 three-bedroom apartments—to Portland’s Hollywood Transit Center. Appraisal insights, market context, and what 30% AMI really means in a high-cost metro.
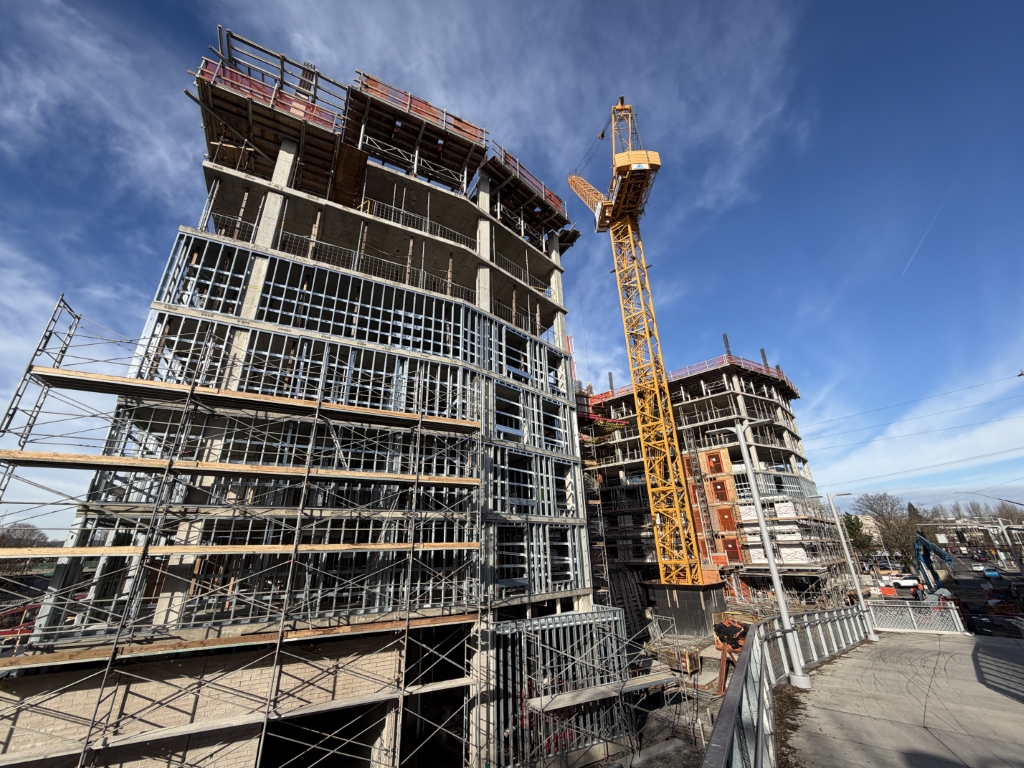
Wide view of hollywoodHUB construction at the Hollywood Transit Center, Northeast Portland – January 12, 2026. The full 12-story footprint and crane operations are visible on TriMet-owned land adjacent to the MAX station. Photo: Abdur Abdul-Malik, Portland Appraisal Blog (CC BY-SA 4.0)
If you’ve driven I-84 through Northeast Portland in recent months, you’ve almost certainly noticed the new 12-story tower rising directly above the Hollywood Transit Center. From the freeway, it’s impossible to miss—cranes swinging, floors stacking, the structure already reshaping the skyline. But what exactly is being built there?
The answer is hollywoodHUB, a 224-unit (222 regulated affordable + 2 manager) transit-oriented development that will deliver one of the largest blocks of permanently affordable family-sized housing in recent Portland history—including 32 three-bedroom apartments in a building designed for dignity, not just density.
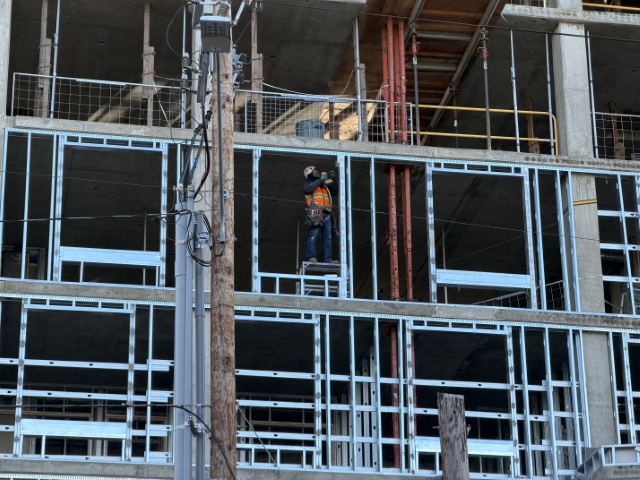
hollywoodHUB under construction at the Hollywood Transit Center, Northeast Portland – January 12, 2026. The 12-story structure towers over NE Halsey Street, with the crane lifting materials as work continues on TriMet land. Photo: Abdur Abdul-Malik, Portland Appraisal Blog (CC BY-SA 4.0)Construction worker drills steel framing on an upper level of hollywoodHUB at the Hollywood Transit Center, Northeast Portland – January 12, 2026. Skilled tradespeople drive the daily progress of the 12-story affordable housing project, set for completion in Spring 2027. Photo: Abdur Abdul-Malik, Portland Appraisal Blog (CC BY-SA 4.0)
Project Overview
hollywoodHUB is a 12-story building at 4110 NE Halsey St., directly integrated with the Hollywood Transit Center (MAX Red, Blue, and Green lines + multiple bus routes). Developed by BRIDGE Housing in partnership with TriMet (which owns the land via ground lease), the project broke ground in January 2025 and is targeted for completion in Spring 2027.
Total development cost is approximately $152 million—one of the largest single affordable housing investments by the Portland Housing Bureau (PHB) to date. PHB is contributing $45.4 million (from the 2016 Housing Bond and HOME-ARP funds), with additional support from Metro 2018 bond funds, Portland Clean Energy Community Benefits Fund (PCEF) grants for energy-efficient features (mini-splits, above-code insulation, EV charging), and $71.5 million in innovative tax-exempt bonds (a first for a nonprofit developer in this structure).
Unit mix (222 regulated affordable units):
43 studios
53 one-bedroom
94 two-bedroom
32 three-bedroom
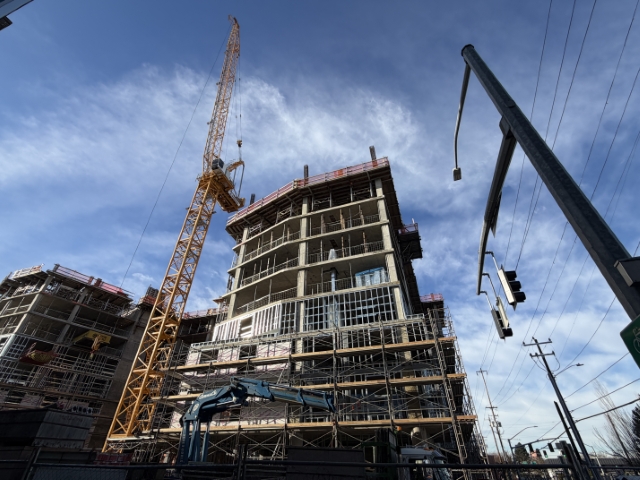
Low-angle view of hollywoodHUB’s rising facade at the Hollywood Transit Center – January 12, 2026. The curved corner and 12-story height highlight the project’s density and modern design. Photo: Abdur Abdul-Malik, Portland Appraisal Blog (CC BY-SA 4.0)
The number of two-bedroom units and three-bedroom units total 126; making “family-sized” units ~57% of the building. The emphasis on family-sized units—particularly the 32 three-bedroom apartments—is a standout feature. Three-bedroom apartments in new affordable housing are rare in Portland; most projects skew heavily toward studios and one-bedroom units, with two-bedroom sometimes reaching 20–30% and three-bedroom typically under 10%. hollywoodHUB delivers a meaningful block of larger units in a high-opportunity, transit-superior node.
Amenities and services include:
Onsite resident services by Impact NW
Indoor play area, teen lounge, community rooms
Courtyard/paseo, bike storage
Energy-efficient systems (PCEF-funded)
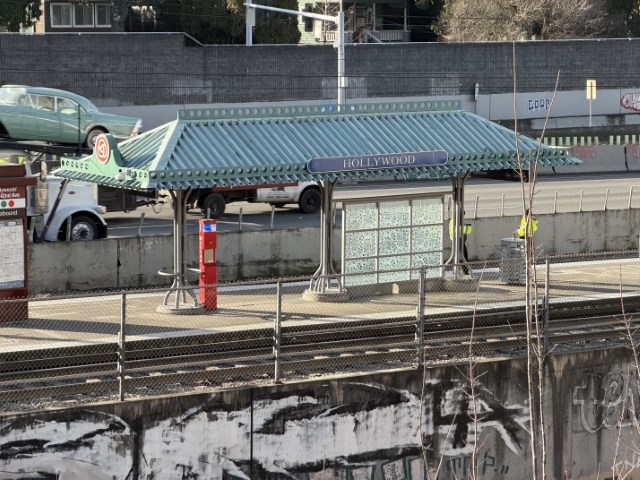
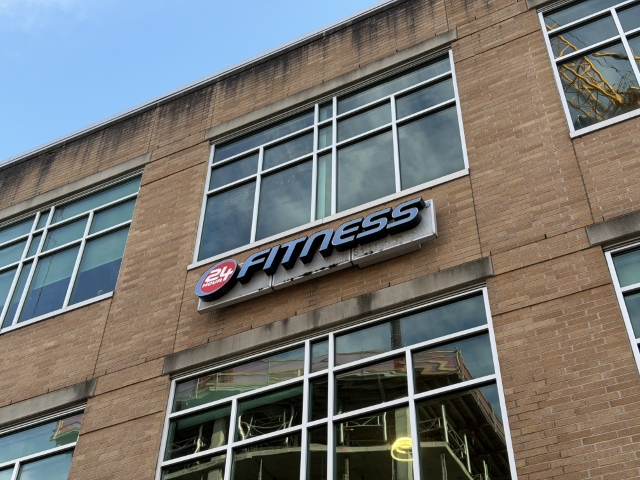
The location is a true walkability/transit paradise: no car needed. Trader Joe’s is directly across NE Halsey Street. 24 Hour Fitness is adjacent. Providence Portland Medical Center, Hollywood Library, Hollywood Theatre, Grant Park, schools, senior center, and restaurants/shops along Sandy Blvd are all within a 5–10 minute walk. Direct MAX and bus access connect to the entire metro.
The project provides no resident parking (only 9 spaces for staff and service vehicles), a deliberate design choice for transit-oriented development on public land. For any residents who retain car ownership, parking will likely require walking blocks away—Trader Joe’s small surface lot is frequently full during the day, and street parking near the transit center is limited and often restricted. While many households at 30–60% AMI are expected to be car-light or car-free, any higher-than-anticipated car retention could place modest additional pressure on nearby residential streets, many of which are already covered by Residential Parking Permit zones.
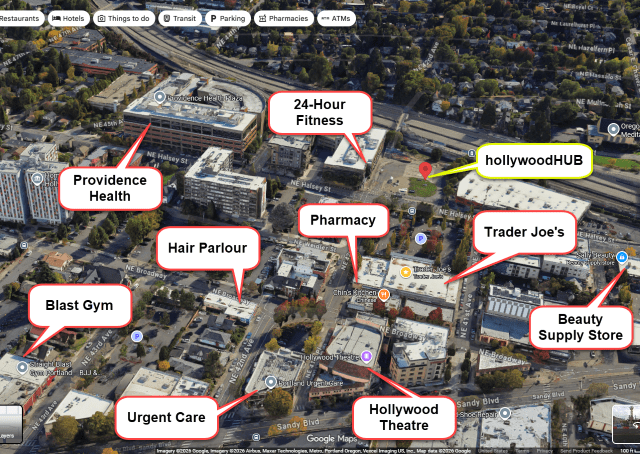
Aerial view of the hollywoodHUB construction site at the Hollywood Transit Center, Northeast Portland (January 2026). The building is steps from MAX lines, directly across from Trader Joe’s and 24 Hour Fitness, and within a 5–10 minute walk of Providence Health, the Hollywood Library, Hollywood Theatre, Grant Park, and other amenities. This transit-superior location enables true car-free living for residents. Via Google MapsThe existing Hollywood MAX station platform (Red, Blue, Green lines) directly adjacent to the hollywoodHUB site – January 12, 2026. The project’s location steps from high-frequency transit underscores its transit-oriented design. Photo: Abdur Abdul-Malik, Portland Appraisal Blog (CC BY-SA 4.0)
Appraisal Implications
hollywoodHUB is a classic special-purpose, restricted-use property. Valued primarily via the income capitalization approach, it uses income-based rents (capped at ~28.5–30% of tenant income), high occupancy from waiting lists/subsidies, and cap rates adjusted downward from market-rate multifamily for lower risk and volatility.
Comparable sales are limited to other Low-Income Housing Tax Credit (LIHTC) / regulated affordable projects (scarce in Northeast Portland). Market-rate comps require deep discounts for functional and economic obsolescence from long-term affordability covenants (30–99 years), subsidy dependence, and limited buyer pool.
Appraisals are required (Oregon Housing and Community Services (OHCS) for LIHTC, bond underwriters) but focus on restricted/investment value to the developer/investor, not open-market hypothetical. Highest and best use for the TriMet-owned site is clearly regulated affordable transit-oriented development (TOD)—subsidies and public land enable 12-story scale that private market assembly would struggle to achieve.
Land value escalation (assessor data from Portland Maps) reflects redevelopment premium: $2.01M in 2023 → $5.25M in 2025, even pre-construction.
Neighborhood Market Context
The immediate Hollywood neighborhood has very limited recent sales of detached 2–3BR homes (only 14 over the period)—a very low number that reflects limited detached housing stock in the transit-hub area. To provide a meaningful local picture, the analysis incorporates the immediately adjacent neighborhoods of Rose City Park and Grant Park, which share the same transit access, walkability, and overall market profile.
Detached 2–3BR Homes – Combined Hollywood Node
Neigh / Group
Avg Close Price
Avg PABAI (60% AMI)
Avg Total SF
# of Sales
Avg Beds
Rose City Park
$610,181
47.04
2,023
284
2.68
Grant Park
$785,177
36.35
2,382
91
2.82
Hollywood
$573,852
46.33
2,232
14
2.79
Combined
$649,811
44.51
2,114
389
2.72
Data from RMLS pivot (last four years), limited to detached homes with 2 or 3 bedrooms. Hollywood had only 14 sales; adjacent areas provide context. Avg Total SF includes basements (avg 669 sq ft across the node). PABAI uses Fiscal Year (FY) 2025 HUD AMI at 60% ($74,460 for 4-person household, effective April 1, 2025), matching hollywoodHUB’s upper cap.
The Portland Appraisal Blog Affordability Index (PABAI) measures how the average close price compares to what a household at a given income level can qualify for under standard lending assumptions (e.g., 20% down payment, 28% debt-to-income ratio for principal, interest, taxes, and insurance). A PABAI of 100 means the market is exactly affordable at that income level. Values above 100 indicate excess qualifying capacity (more affordable), while values below 100 indicate a shortfall (strained affordability). For full methodology and the interpretation scale, see the PABAI explainer page.
PABAI Range
Interpretation
120+
Strongly Affordable
100–119
Moderately Affordable
80–99
Strained
Below 80
Severely Constrained
The combined PABAI of 74.19 at 100% AMI ($124,100 median family income) indicates a shortfall—even median-income households would require roughly $167,000 annual income to qualify for the average $649,811 home. At 60% AMI ($74,460, hollywoodHUB’s upper cap), PABAI drops to 44.51—typical qualification falls to less than half the average price. Of the 389 sales, only 36 (~9.3%) had PABAI ≥ 100 (excess capacity at 100% AMI); at 60% AMI, that drops to just 2.
While condominiums exist as a smaller-share ownership option in the area, the three-neighborhood node has little condominium inventory and detached homes remain the dominant preference for family-sized living.
What $37,250 Really Means—and How hollywoodHUB Changes It
The 71 units at or below 30% AMI target households earning no more than approximately $37,250 annually for a family of four (FY 2025 HUD Portland MSA figure). The 2025 federal poverty guideline for a family of four is $32,150. These families are living just above the poverty line in one of the country’s higher-cost metros.
After essential non-housing expenses—food, childcare, transportation, healthcare, utilities—very little remains for rent. A sustainable 30% burden leaves roughly $900–$1,000 per month total (rent + utilities). Market-rate 2–3BR apartments in Northeast Portland often exceed $2,000–$3,000/month, and detached homes average $4,207/month in PITI costs.
The result is often overcrowding, instability, and loss of dignity: multiple families or unrelated adults sharing small units, children without private bedrooms, constant moves to avoid eviction, skipped medical care or school activities to make rent. Privacy, quiet study space, and a sense of home become luxuries.
hollywoodHUB changes that equation. This is not shoddy or bare-bones housing. The 12-story building by Holst Architecture features energy-efficient design (PCEF-funded), modern finishes, onsite resident services through Impact NW, indoor play areas, teen lounge, courtyard, bike storage—and direct integration with the Hollywood MAX station.
Most powerfully, families in these units will live across the street from Trader Joe’s and a 24 Hour Fitness, steps from the MAX Red/Blue/Green lines, blocks from Providence Hospital, the Hollywood Library, and the historic Hollywood Theatre. For a family earning $37,250, this level of access—to fresh groceries, fitness, healthcare, education, culture, and transit—is nearly incomprehensible in Portland’s current market.
The 32 three-bedroom units (plus 94 two-bedroom) provide real space—likely 1,000–1,300 sq ft, private bedrooms, separate living/kitchen areas—at rents families can actually pay. This isn’t just shelter; it’s the restoration of dignity, stability, and opportunity for larger families who have been priced out of the city they call home.
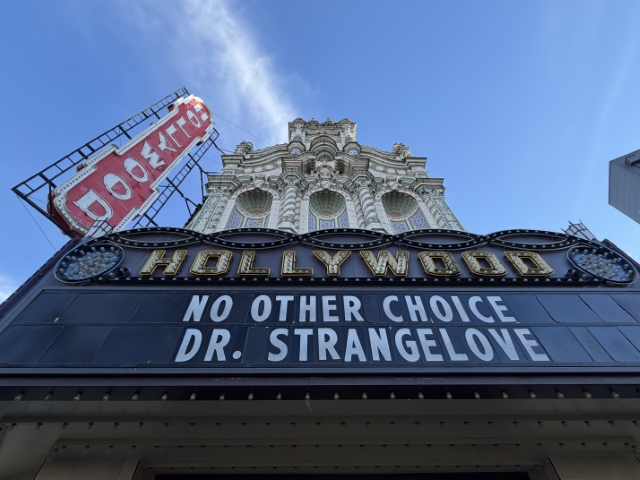
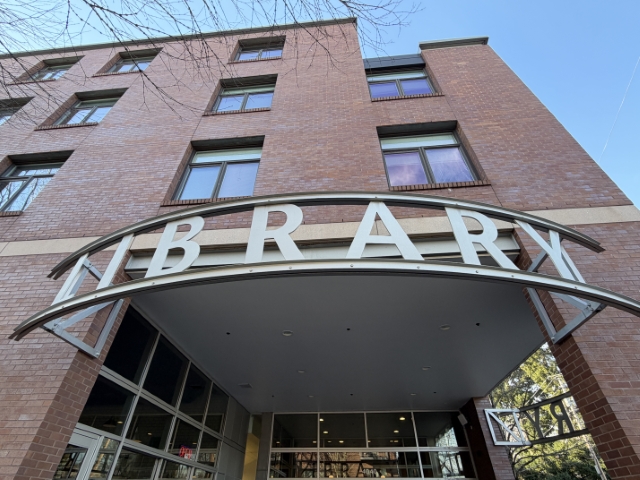
24 Hour Fitness directly across the hollywoodHUB construction site – January 12, 2026. This major amenity, along with Trader Joe’s and other nearby services, exemplifies the opportunity-rich environment for residents. Photo: Abdur Abdul-Malik, Portland Appraisal BlogThe historic Hollywood Theatre (1926), just a short walk from hollywoodHUB along NE Sandy Blvd – January 12, 2026. This landmark cultural hub adds to the walkable, amenity-rich environment for residents. Photo: Abdur Abdul-Malik, Portland Appraisal Blog (CC BY-SA 4.0) The Hollywood Library, a central community resource just a short walk from hollywoodHUB – January 12, 2026. This modern branch offers books, programs, and gathering spaces for residents and families. Photo: Abdur Abdul-Malik, Portland Appraisal Blog (CC BY-SA 4.0)
Income Restrictions, Rent Mechanics, & Broader Implications
hollywoodHUB caps all 222 regulated units at 60% AMI ($74,460 for a 4-person household), with 71 units at ≤30% AMI ( $37,250). Rents are income-based (~28.5–30% of adjusted gross income + utilities allowance). A family of four at 30% AMI pays roughly $900–$1,000/month total.
The 55 units with Project-Based Section 8 vouchers (PBV) are especially significant. These federal subsidies are tied directly to the units—the Portland Housing Authority pays most of the rent directly to BRIDGE Housing, allowing families with very low or no income to live there while paying only ~28.5–30% of their adjusted gross income. This removes the risk of rent burden exceeding income and ensures stability even for the most vulnerable households. Other units may qualify for additional supports (e.g., state LIFT program, PHB incentives), but PBV is the backbone for the deepest affordability tier.
The generous public investment—including $45.4 million from the Portland Housing Bureau—funds high-quality construction, energy-efficient systems, and resident services that create a stable, dignified home environment for families who would otherwise face overcrowding or displacement.
Takeaway
hollywoodHUB is one of several significant affordable housing projects currently under construction or recently completed in the Portland Region as the city works to counter the inherent unaffordability of traditional detached homeownership for moderate- and lower-income households.
Even at the full area median income of $124,100 (FY 2025, 4-person household), the average detached 2–3BR home in the Hollywood node requires roughly $167,000 in annual income to qualify—well beyond what most families can sustain. At 60% AMI ($74,460, hollywoodHUB’s upper cap), the gap widens dramatically (PABAI 44.51), and at 30% AMI ($37,250), market ownership is simply out of reach.
Projects like hollywoodHUB, with its 126 family-sized units (including 32 three-bedroom apartments), layered subsidies, and transit-superior location, represent a deliberate policy response to this reality. Similar efforts include:
The Julia West House supportive housing tower, which recently opened to provide deeply affordable units with onsite services.
The Alberta Alive townhomes, rising opposite the historic Alberta Abbey as infill in a culturally rich corridor.
The Barbur Apartments groundbreaking, which highlighted plottage value in redevelopment along a key transit corridor.
These initiatives—while different in scale, target population, and financing—share a common thread: using public or acquired land, incentives, and creative partnerships to deliver housing that the private market alone cannot produce at accessible price points. As more projects come online, they will continue to reshape affordability, highest and best use assumptions, and neighborhood stability in the Portland metro area.
Thanks for reading—I hope you found a useful insight or an unexpected nugget along the way. If you enjoyed the post, please consider subscribing for future updates.
CODA
Are you an agent in Portland who wonders why appraisers always do “x”?
A homeowner with questions about appraiser methodology?
If so, feel free to reach out—I enjoy connecting with market participants across Portland and the surrounding counties, and am always happy to help where I can.
And if you’re in need of appraisal services in Portland or anywhere in the Portland Region, we’d be glad to assist.
Coyotes are thriving in Portland! While out doing appraisal work, I spotted this one casually strolling through the Grant Park neighborhood.
The Portland Urban Coyote Project tracks thousands of sightings across the metro area—check their interactive map to see how widespread they are. Coyotes even pop up in real estate listings sometimes (usually as a wildlife bonus or pet-safety note).
They rarely approach people, but always observe from a distance. Spot one? Snap a photo and report it at portlandcoyote.com!
CODA
Are you an agent in Portland who wonders why appraisers always do “x”?
A homeowner with questions about appraiser methodology?
If so, feel free to reach out—I enjoy connecting with market participants across Portland and the surrounding counties, and am always happy to help where I can.
And if you’re in need of appraisal services in Portland or anywhere in the Portland Region, we’d be glad to assist.
Mandatory valuation bias & fair housing training is now required for all appraisers as of January 1, 2026. Quick breakdown of the AQB’s 7-hour CE requirement (4-hour refreshers after), plus the recent scrutiny and mixed outcomes driving it. Most appraisers deliver fair, data-driven valuations daily—this reinforces transparency and trust.
Are you an agent in Portland who wonders why appraisers always do “x”?
A homeowner with questions about appraiser methodology?
If so, feel free to reach out—I enjoy connecting with market participants across Portland and the surrounding counties, and am always happy to help where I can.
And if you’re in need of appraisal services in Portland or anywhere in the Portland Region, we’d be glad to assist.


.jpg)
.jpg)
.jpg)