

This week brought a mix of developments in the Portland region’s housing landscape, from persistent vacancies in affordable units to new grants aimed at community outreach, transit adjustments, cost-relief measures for developers, and a modest expansion in FHA financing options. While no single overriding theme tied every story together, the updates highlighted ongoing efforts to address supply barriers and accessibility—whether through administrative support, infrastructure trade-offs, or buyer eligibility—against a backdrop of stubborn affordability pressures in the metro area. Appraisers tracking these shifts see subtle influences on valuation approaches, particularly in multifamily stability and development feasibility.
Table of Contents
- Sunday, December 7: Affordable Housing Vacancy Paradox
- Monday, December 8: East Portland Housing Capacity Grants
- Tuesday, December 9: Oregon DOJ Settlement on Home Liens
- Wednesday, December 10: TriMet Evening Bus Reductions
- Thursday, December 11: Temporary SDC Exemptions for New Housing
- Friday, December 12: RSO Reallocation and HUD Policy Updates
- Saturday, December 13: 2026 FHA Loan Limits in Portland Metro
Sunday, December 7: Affordable Housing Vacancy Paradox
Via Canva Pro
Portland’s affordable housing efforts face a stark contradiction: despite progress in producing income-restricted units through inclusionary zoning, 1,863 apartments remain vacant across the region’s subsidized stock—a 7.4% vacancy rate in a portfolio of over 25,000 units. Funding shortfalls at Home Forward, including deep federal voucher cuts, combined with administrative delays and rising costs, have paused voucher issuances and extended waitlists, leaving units unoccupied even as homelessness climbs.
This bottleneck undermines the pipeline from new construction to actual occupancy, with broader implications for market stability. In the Portland–Vancouver–Hillsboro MSA, where the FY 2025 median family income stands at $124,100 for a four-person household, these vacancies highlight how policy successes in unit creation can falter at the activation stage.
Appraisers encounter direct risks here, particularly in multifamily and mixed-income assignments. Vacancies exert downward pressure on potential gross income and net operating income, necessitating careful adjustments in the income approach—longer projected absorption periods, elevated vacancy allowances, and potentially higher capitalization rates to account for stabilization delays. For highest and best use analyses, extended lease-up timelines due to voucher bottlenecks may shift underwriting assumptions toward more conservative horizons.
Certified General appraisers handling investment-grade properties must segregate deed-restricted comparables rigorously from market-rate sales, as the growing inventory of restricted units introduces pricing disparities that could lead to incomplete analyses if not addressed. In submarkets with concentrated affordable projects, these factors amplify risks of overvaluation if administrative hurdles are overlooked.
Monday, December 8: East Portland Housing Capacity Grants

Building on the challenges of vacant affordable units, the Portland Housing Bureau opened a new RFP for $180,000 in grants targeted at building community and housing capacity in East Portland—areas east of I-205 that often face higher displacement risks and outreach gaps. Up to two nonprofits could receive $90,000 each for activities like resident education, leadership development, and engagement in housing planning processes.
This funding emphasizes flexible support for organizations already working in underserved submarkets, aiming to improve access to existing resources rather than fund large-scale development. By strengthening nonprofit infrastructure, the initiative seeks to bridge administrative and informational barriers that contribute to underutilized housing stock.
For appraisers, these grants signal potential enhancements in neighborhood stability over time. Improved outreach could gradually reduce vacancies in income-restricted units by facilitating better matches between households and available programs, indirectly supporting occupancy assumptions in multifamily valuations.
In highest and best use considerations for properties in East Portland, heightened community engagement may bolster arguments for resilient, accessible residential uses. However, appraisers should remain cautious of persistent displacement pressures; overlooking outreach deficiencies could lead to overly optimistic projections in market stability analyses for transit-oriented or affordable-focused submarkets.
Tuesday, December 9: Oregon DOJ Settlement on Home Liens

The Oregon Department of Justice reached a settlement resolving liens placed by MV Realty on hundreds of Oregon homes, clearing title encumbrances for affected properties across the state, including the Portland region. The agreement removes restrictions that had clouded marketability for homeowners who entered long-term listing agreements.
This resolution restores clear title for participants, eliminating potential barriers to sale or refinancing. In a market where title issues can delay transactions or affect perceived value, the settlement provides relief for individual residential properties previously impacted.
Appraisers reviewing assignments involving formerly encumbered homes must verify the settlement’s application to ensure no lingering clouds on title, as unresolved liens could otherwise trigger scope limitations or require extraordinary assumptions. For broader market analyses, the clearance reduces minor frictional risks in the sales comparison approach, though the overall impact remains limited given the settlement’s scope.
Wednesday, December 10: TriMet Evening Bus Reductions
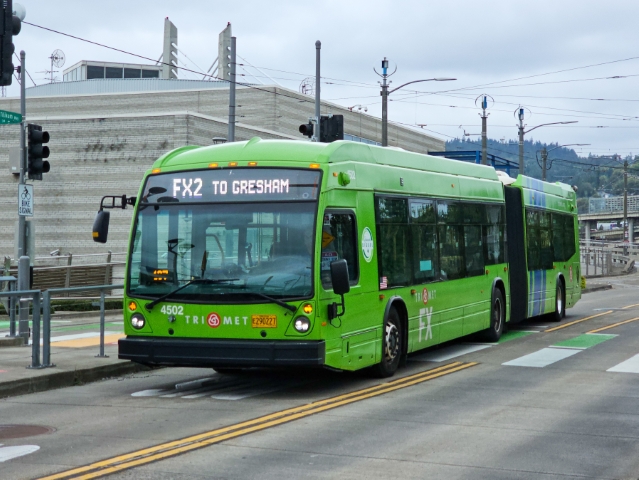
Photo: Truflip99 via Wikimedia Commons (CC BY 4.0)
TriMet rolled out the first phase of targeted evening service cuts on several bus lines, responding to a projected $300 million budget shortfall as operating costs have surged over 50% since 2019 while ridership lingers at roughly two-thirds of pre-pandemic levels. Reductions affect low-ridership hours on routes like FX2–Division and others, shifting frequencies to hourly in many cases.
These changes introduce subtle frictions for transit-dependent residents, particularly evening-shift workers or families in outer submarkets, potentially influencing tenant preferences and renewal patterns.
Appraisers focused on multifamily properties should monitor for emerging effects in affected corridors. Reduced evening access could translate to minor softness in occupancy or rents for assets serving low-vehicle households, warranting adjustments to income projections or closer scrutiny of location amenities.
In highest and best use evaluations for transit-oriented developments, ongoing fiscal pressures on public transportation raise risks of diminished connectivity advantages, potentially favoring car-oriented alternatives in certain submarkets and complicating long-term valuation stability.
Thursday, December 11: Temporary SDC Exemptions for New Housing

Portland implemented a temporary waiver of system development charges (SDCs) for most new residential units through 2028, foregoing an estimated $63 million in revenue to spur production of around 5,000 additional homes. Average per-unit fees often exceed $20,000—sometimes reaching $35,000 for single-family—representing a meaningful slice of development costs.
The exemption applies automatically to eligible permits, with early indicators showing strong developer interest, including hundreds of inquiries skewed toward single-family projects alongside larger multifamily proposals.
This policy directly lowers barriers to new supply in a region where new construction sales have lagged. Savings scale with project size, offering substantial relief for multifamily developers and potentially accelerating inventory in constrained submarkets.
Appraisers benefit from adjusted cost approach inputs: lower replacement costs for under-construction or proposed residential properties can support higher feasibility conclusions, particularly in marginal locations. The waiver strengthens highest and best use arguments for residential redevelopment, improving projected returns.
Yet trade-offs merit attention—foregone funds delay infrastructure upgrades, including transportation improvements that intersect with transit challenges. The waiver introduces long-term risks against near-term production gains.
Friday, December 12: RSO Reallocation and HUD Policy Updates

Via Canva Pro
A significant $20.7 million reallocation emerged in the context of local rental assistance and stabilization programs, accompanied by reversals of previously approved rent increases for certain covered properties and a temporary pause in new HUD policy implementation that impacts subsidized housing operations in the Portland area.
These adjustments reflect responsive shifts in funding priorities and regulatory oversight, potentially stabilizing expenses for tenants in assisted units while altering short-term revenue projections for landlords and investors in affected multifamily assets.
The reallocation redirects resources toward immediate rental support needs, while the reversal of rent hikes—tied to earlier administrative approvals—restores lower allowable increases, providing relief amid ongoing affordability strains but introducing uncertainty in cash flow forecasting.
A HUD policy pause further delays changes that could have influenced contract renewals or compliance requirements for project-based Section 8 and similar programs, giving operators additional time to adapt but prolonging ambiguity in long-term planning.
For appraisers valuing rent-stabilized or subsidized multifamily properties, these developments demand heightened vigilance in the income approach. Sudden reversals in allowable rents necessitate conservative growth assumptions and thorough verification of current versus projected expense ratios, as policy volatility can elevate perceived risk.
Certified General appraisers must incorporate these pauses and reallocations into capitalization rate selections—potentially justifying higher rates to reflect regulatory uncertainty—or risk overvaluation in assets reliant on public funding streams. In highest and best use analyses, frequent policy shifts underscore the importance of stressing scenarios that account for administrative reversals, ensuring robust support for conclusions in a regulated environment.
Saturday, December 13: 2026 FHA Loan Limits in Portland Metro

Via Canva Pro
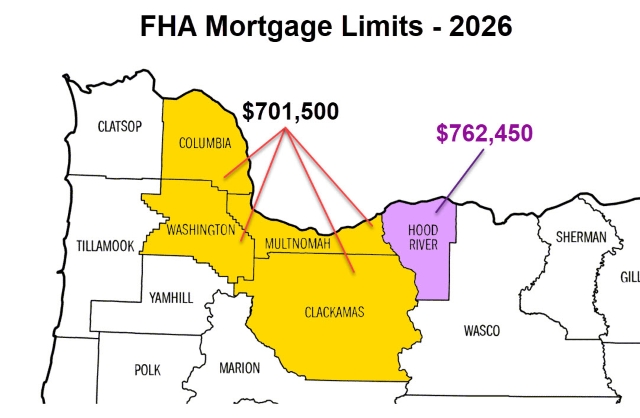
The FHA announced its 2026 loan limits, raising the one-unit ceiling in the Portland–Vancouver–Hillsboro MSA to $701,500—a modest $5,750 increase from 2025. This adjustment expands low-down-payment eligibility to roughly 48 additional detached homes sold in recent quarters that previously sat just above the prior threshold.
While the bump is small, it broadens 3.5% down-payment options for mid-range buyers in core metro counties, with minimal change for higher-priced segments where FHA usage remains low.
In addition to developing an opinion of value, appraisers on FHA assignments focus primarily on identifying property deficiencies or conditions that could render a home ineligible for financing—lenders handle the loan-to-value calculations against the limit using the appraised value alongside borrower qualifications. Lenders handling FHA assignments with case numbers assigned on or after January 1, 2026, will apply the new $701,500 ceiling across the core Portland metro counties.
Week’s Blog Posts & Further Reading Links
- Sunday’s Brief (12/7): Affordable Housing Vacancy Paradox
- Monday’s Brief (12/8): East Portland Housing Capacity Grants
- Tuesday’s Brief (12/9): Oregon DOJ Settlement on Home Liens
- Wednesday’s Brief (12/10): TriMet Evening Bus Reductions
- Thursday’s Brief (12/11): Temporary SDC Exemptions for New Housing
- Friday’s Brief (12/12): RSO Reallocation and HUD Policy Updates
- Saturday’s Brief (12/13):2026 FHA Loan Limits in Portland Metro
- The Portland Region Q3 2025 Market Update: Portland Appraisal Blog
Closing Remarks
Taken together, the week’s stories paint a picture of incremental policy responses to Portland’s entrenched housing challenges—vacancies despite production gains, targeted grants to improve access, cost relief to boost supply, and financing tweaks to aid buyers—all while navigating fiscal constraints in transit and infrastructure. Appraisers see recurring themes of administrative and funding hurdles that demand careful risk adjustments in income and cost approaches.
These developments underscore the need for nuanced analyses that account for policy-induced variables, from vacancy drags in affordable segments to feasibility boosts via fee waivers. In a market still grappling with supply shortages, such measures offer guarded optimism for added inventory and stability.

Thanks for reading—I hope you found a useful insight or an unexpected nugget along the way. If you enjoyed the post, please consider subscribing for future updates.
Question: Which of this week’s updates—whether the SDC waivers, FHA limit adjustment, or affordable vacancy insights—do you see having the biggest impact on your next appraisal assignment or investment decision in the Portland region?
CODA
Are you an agent in Portland and wonder why appraisers always do “x”?
A homeowner with questions about appraiser methodology?
If so, feel free to reach out—I enjoy connecting with market participants across Portland and the surrounding counties, and am always happy to help where I can.
And if you’re in need of appraisal services in Portland or anywhere in the Portland Region, we’d be glad to assist.


