

Via Canva Pro
The Portland Appraisal Blog Affordability Index (PABAI) is an appraiser-developed metric designed to measure realistic housing qualification across single-family residential segments in the Portland Region’s six-county market (Columbia, Clackamas, Hood River, Multnomah, Washington, and Yamhill counties in Oregon).
Built entirely from local closed-sale data and actual carrying costs, the PABAI provides lenders, realtors, homeowners, estate planners, and attorneys with a transparent view of affordability grounded in daily valuation and underwriting practice.
Purpose and Distinction
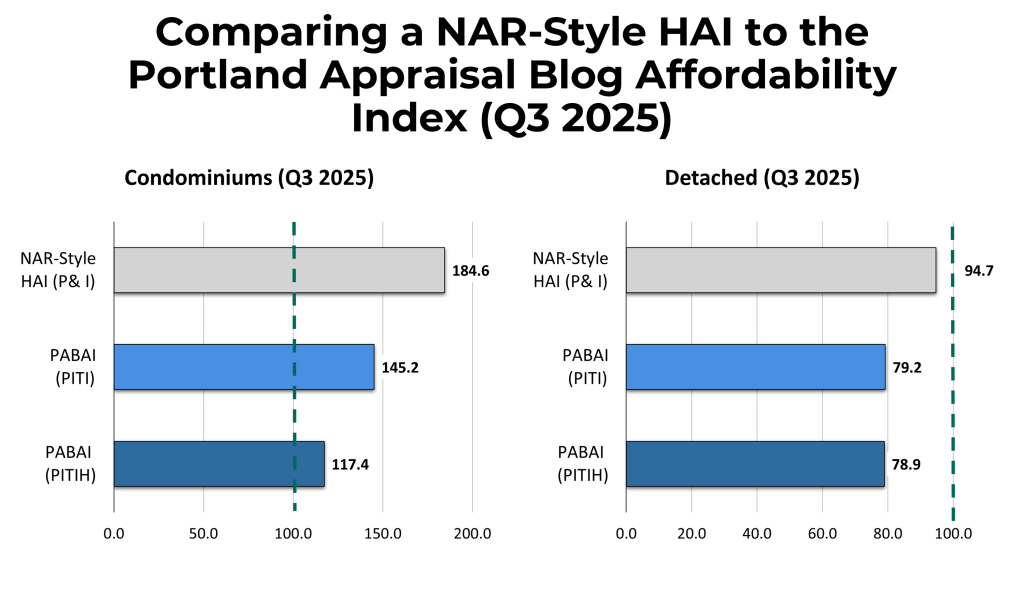
National affordability indices serve a useful broad purpose but frequently rely on principal-and-interest-only calculations, national assumptions, and simplified cost inputs. The PABAI takes a different approach by incorporating full monthly housing expenses specific to the Portland Region—revealing local qualification realities that generic metrics often overlook.
The index is expressed on a scale where a value of 100 indicates that typical household qualification exactly aligns with the average home evaluated by the model. Values above 100 suggest greater affordability, while values below 100 highlight constraints.
Interpreting PABAI Values
The following bands offer practical context for segment-level readings:
| PABAI Range | Interpretation | Practical Implications |
|---|---|---|
| 120+ | Strongly Affordable | Typical qualifying power provides a meaningful buffer against the Portland Region’s elevated utility, maintenance, hazard insurance, and (where applicable) HOA costs. |
| 100–119 | Moderately Affordable | Accessible market—household income aligns with or exceeds full PITI costs, including property taxes, homeowners insurance, and HOA dues where applicable. |
| 80–99 | Strained | Qualification constraints emerge; buyers often need larger down payments, dual high incomes, rate concessions, or removable mortgage insurance to bridge the gap. |
| Below 80 | Severely Constrained | Significant affordability barrier—median household falls short of qualifying for typical sale prices under standard underwriting, particularly when mortgage insurance is required for low-down-payment scenarios. |
Methodology
The PABAI derives from Regional Multiple Listing Service (RMLS) closed sales of single-family residential properties—detached homes, attached homes, condominiums, and manufactured homes on owned land—within the Portland Region.
Extensive quarterly cleanup corrects widespread misclassifications in raw data, especially condominiums incorrectly listed as attached or detached properties. This step ensures accurate segment separation critical to valuation and lending differences.
Core elements include:
- Income basis derived from U.S. Department of Housing and Urban Development (HUD) area median income tables and U.S. Census Bureau American Community Survey (ACS) data, with cohort-specific adjustments where applied.
- Full Principal and Interest (PI) calculation, using interest rates matched to each sale’s close date via Freddie Mac Primary Mortgage Market Survey data.
- Taxes—actual property taxes reported for each sold property.
- Insurance—homeowners insurance estimated using trusted Oregon-specific regional averages.
- HOA dues (PITIH)—reported Homeowners Association dues added where applicable (dues are included exactly as reported for the specific property; no estimates, averages, or omissions are applied).
- Mortgage Insurance (PITIHM)—not included in the default PABAI calculation (which assumes 20% down payment and eliminates PMI); PMI can be modeled separately for low-down-payment scenarios.
- Default qualification at 28% front-end debt-to-income ratio and 20% down payment.
Formula
The Maximum Qualifying Price (MQP) is the highest home price a typical household can afford under the modeled assumptions, calculated from the reference household income, the 28% front-end debt-to-income ratio, the interest rate applicable on the closing date, and the full monthly housing expenses (PITI(H)) for that specific property.
For each individual sold property, an affordability ratio is calculated:
The PABAI for a segment or the region is the arithmetic mean of these individual ratios across all qualifying sales in the period, scaled by multiplying by 100:
where n is the number of qualifying sales.
A value of 100 means the average of the individual affordability ratios across all transactions equals 1.0—the homes in the segment were, on average, exactly affordable to the reference household under the modeled assumptions. Values above 100 reflect excess qualifying power (homes sold, on average, below what the household could afford, providing buffer). Values below 100 indicate a shortfall (homes sold, on average, above what the household could afford, requiring additional income or down payment).
Why the PABAI Uses Every Transaction (and Why That Matters)
Most affordability indices rely on a single reference point—usually the median sale price—and then build the entire model around that one number. The problem is that a median price compresses thousands of transactions into a single value, erasing the actual distribution of costs buyers face in the real world.
The PABAI takes a fundamentally different approach. Instead of anchoring the index to one “representative” home, the model calculates an affordability ratio for every individual sale in the dataset. Each transaction carries its own tax burden, HOA dues, insurance estimate, and financing cost. These ratios are then averaged across the entire market, producing an index that reflects the full distribution of affordability rather than a single price point.
This structure makes the PABAI highly resistant to distortion from outliers. For example, removing all sales above $1M—roughly 9% of quarterly transactions—shifts the regional PABAI by only a few points. Luxury sales may influence median prices, but they barely move the PABAI because they represent only a handful of ratios within a much larger distribution. The result is an index that captures the lived affordability conditions of the market, not the noise at the top of the price spectrum.
How Individual Ratios Become a Meaningful Index
The PABAI is built from thousands of individual affordability ratios, but the published index value is never a single ratio. Instead, it is always the arithmetic mean of all qualifying transactions within the defined region or segment. Each sale produces its own precise affordability ratio—a factual measure of how affordable that specific home was to the reference household under the modeled assumptions. But the reported PABAI reflects the typical experience across the entire group of sales, not any one transaction.
To ensure the index remains representative, PABAI values are only published for segments with sufficient sales volume—generally at least 20–30 transactions. This prevents the average from being distorted by outliers or one‑off sales in thin markets. All qualifying sales are always included in the broader regional PABAI, even if certain sub‑areas do not meet the minimum threshold for standalone reporting. For the Portland Region as a whole, the quarterly detached‑home PABAI typically reflects 4,000–5,000 transactions, providing a stable and statistically meaningful measure of affordability conditions.
Model Flexibility and Scenario Analysis
All assumptions remain modular, allowing granular simulations such as:
- Alternative down-payment levels (e.g., 3.5% FHA, 0% VA, 5–10% conventional).
- Mortgage insurance (PMI/MI)—not included in the default PABAI (which assumes 20% down payment and eliminates PMI); can be added as a scenario for lower-down-payment cases using estimated PMI rates based on loan-to-value ratio, credit score assumptions, and current market guidelines.
- Varied debt-to-income ratios or other qualification guidelines.
- Specific buyer cohorts (e.g., households headed by individuals aged 25–44, seniors, first-time buyers, dual-income households).
- Elevated carrying costs from hazard insurance, special assessments, or other property-specific expenses.
- Geographic breakdowns at the county, city, ZIP code, or submarket level.
This flexibility supports targeted analyses of financing program effects, buyer pool depth, external obsolescence driven by persistent monthly expenses, and how different assumptions shift affordability outcomes across the market.
Current Readings
PABAI values are updated quarterly. Detailed regional and segment readings appear in the latest reports listed below.
Calculated at the individual transaction level and averaged across all sales in each segment for equal weighting. This provides greater accuracy than median-price methods.
Important note: The PABAI is never calculated as a blend of different housing segments. The PABAI for detached homes does not include condominium sales or vice versa. Each segment stands on its own.
Detached Single-Family Homes
| Current Detached Market Affordability Status |
|---|
| SEVERELY CONSTRAINED |
| Metric | Q4 2025 Value | Explanation |
|---|---|---|
| Average PABAI | 79.20 | Average across 4,243 individual Q4 2025 transactions; <100 = reduced affordability for median HUD household ($124,100) |
| Required Household Income | ~$156,700 | At 28% qualifying ratio based on the calculated average PABAI for 4,243 sales |
| Income Shortfall | ~26.3% | Additional income median household needs |
| Housing Burden for Median Household | ~35.3% | % of gross monthly income required |
Note:
- The Portland Region remains highly unaffordable for detached homes. An average PABAI of 79.20 indicates the median HUD-income household ($124,100) falls substantially short of qualifying for the average detached sale, requiring roughly 26% more income or devoting over 35% of gross monthly income to housing—well above sustainable levels.
PABAI Publications and Reports
Quarterly analyses and annual PDF reports will be added as published.
Latest PABAI Posts
Data Sources
The PABAI draws exclusively from primary sources, including Regional Multiple Listing Service (RMLS) closed-sale records, U.S. Department of Housing and Urban Development area median income tables, Freddie Mac rate data, and U.S. Census Bureau inputs.
The index is provided for informational purposes only. Individual qualification and valuation decisions should involve qualified professionals.
Contact
Need a custom PABAI analysis or tailored affordability report for your Portland-Vancouver portfolio? Contact for institutional-grade intelligence built from cleaned RMLS data.
