Appraisal Video Short: Portland’s Ritz-Carlton Luxury Tower – Huge Price Cuts After Slow Sales

Portland’s Ritz-Carlton Residences: Luxury tower with stunning views and hotel perks…but only 11 of 132 units sold through 2025, with buyers demanding massive discounts averaging $274,000 off original prices. Cuts starting at 50% are anticipated as major repositioning rolls out in 2026.

This is a classic case of location, location, location—the developers priced it like the Pearl District, but Portland Downtown’s condo market had other ideas.

Full in-depth analysis, charts, sales data, and what it means for buyers/lenders/developers in my latest blog post:

CODA

Are you an agent in Portland who wonders why appraisers always do “x”?

A homeowner with questions about appraiser methodology?

If so, feel free to reach out—I enjoy connecting with market participants across Portland and the surrounding counties, and am always happy to help where I can.

And if you’re in need of appraisal services in Portland or anywhere in the Portland Region, we’d be glad to assist.

Portland Real Estate Appraisal Brief – Portland’s Title 11 Tree Code — Benefits, Burdens, and Property Value Impacts

Portland’s Title 11 Tree Code protects urban canopy but imposes mitigation fees ($472/inch), penalties ($1,000/day), and Heritage deed restrictions. This brief explores resale amenity value vs. redevelopment burdens for property owners.

Portland Oregon Arbor Lodge neighborhood street with mature tree canopy forming a shaded tunnel over the road.
Mature tree canopy arching over a residential street in Portland’s Arbor Lodge neighborhood (September 2025). This type of shaded, park-like setting is frequently marketed as an amenity in resale listings.
Photo: Abdur Abdul-Malik, Portland Appraisal Blog

Trees define Portland’s character—from tree-lined residential streets to the vast canopies of Forest Park and Mt. Tabor. The City of Portland’s Title 11 Tree Code establishes comprehensive regulations for tree preservation on private property within city limits.

Portland City Code Chapter 11.00.010 outlines the code’s purpose:

Trees are a fundamental component of the City’s green infrastructure. The chapters within this Title address trees in both development and nondevelopment situations and seek to enhance the quality of the urban forest and optimize the benefits that trees provide. Desired tree benefits include:

1. Providing oxygen and capturing air pollutants and carbon dioxide;
2. Maintaining slope stability and preventing erosion;
3. Filtering stormwater and reducing stormwater runoff;
4. Reducing energy demand and urban heat island through shading of buildings and impervious areas;
5. Providing visual screening and buffering from wind, storms and noise;
6. Sustaining habitat for birds and other wildlife;
7. Providing a source of food for wildlife and people;
8. Maintaining property values and the beauty, character and natural heritage of the City; and
9. Meeting the multi-purposed objectives of the Urban Forest Plan, including reaching and sustaining canopy targets for various urban land environments.

These goals are laudable and align with Portland’s identity as a tree-rich city. Yet real-world implementation has generated significant friction for property owners—permit requirements, mitigation costs, enforcement actions, and occasional liability when protected trees fail.

In Q3 2025 closed detached single-family sales within the City of Portland, “tree” or “trees” appeared in listing remarks for 660 of 1,519 transactions (43%). Properties marketed with tree mentions averaged $678,689—$51,371 higher than those without. After regression-based adjustments for differences in living area ($267.72 per Total SF) and lot acreage ($347,496 per acre), an approximate $23,500 difference remained in favor of the tree-mention cohort. This observational finding—not a controlled paired-sales analysis—suggests the market may reward mature canopy as a contributory amenity in established resale properties. Because listing photographs frequently communicate tree presence more effectively than remarks, and because other influential variables (such as neighborhood, condition, and level of updating) are not controlled for here, the remaining price difference should be viewed as a general market indicator rather than a precise contributory estimate.

Ironically, the same trees that appear to support resale premiums can impose substantial constraints during redevelopment, additions, or even routine ownership.

Trees as Amenity: The Resale Perspective

Mature trees provide shade, privacy, and aesthetic appeal that buyers prize in Portland’s established neighborhoods. The high frequency of tree mentions in marketing remarks (43% in Q3 2025) reflects agent confidence in canopy as a selling point.

Since July 1, 2025, most non-development tree permit applications (routine pruning, removal, or replanting on existing homes) carry no charge—thanks to Portland Climate Emergency Fund support. This relief reduces ongoing maintenance costs for homeowners and reinforces the perceived contributory value of large trees in resale transactions.

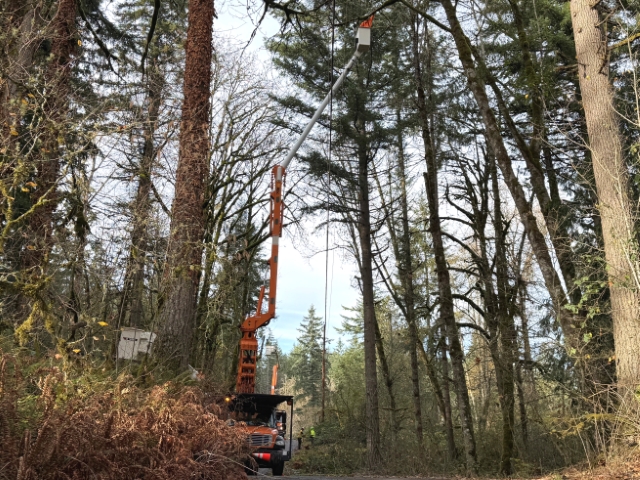
Professional care is often required for large specimens to avoid safety issues or violations.

Portland metro area arborist in bucket truck pruning large tree branches.
Professional arborist pruning a large tree using a bucket truck in the Portland metro area—illustrating the specialized care often needed for mature canopy under Title 11 regulations.
Photo: Abdur Abdul-Malik, Portland Appraisal Blog

Trees as Burden: Real-World Homeowner Experiences

While the code’s environmental intent is clear, enforcement and preservation mandates have created documented challenges for property owners.

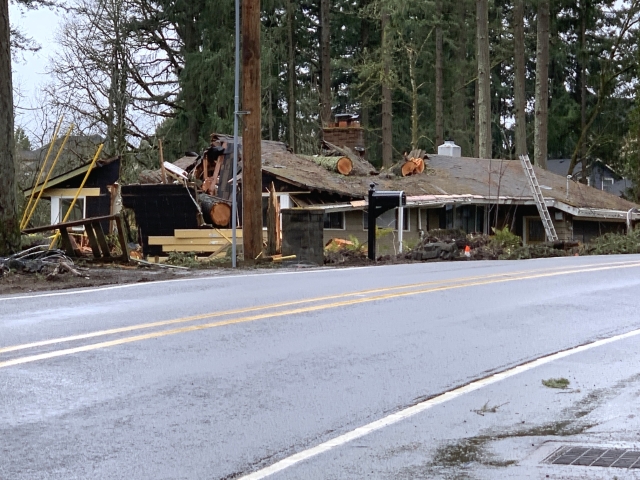
In one prominent case, a Southwest Portland family sought removal of a leaning Douglas-fir they considered hazardous. Urban Forestry denied the permit. During the January 2024 ice storm, the tree collapsed onto their home—narrowly missing their young daughter. The family filed suit in April 2025, seeking $4.7 million in damages; the lawsuit remains ongoing as of January 2026.

Similar frustration appears in other accounts: unexpected violation notices and restoration bills, rigid enforcement described as a “nightmare” for residents, and ombudsman investigations into abatement costs shifted to homeowners for trees located far from their property line.

These incidents illustrate the liability risk when protected trees become dangerous—yet removal options remain restricted. Reports nationwide echo warnings: unauthorized tree cutting has led some property owners to severe financial consequences, including liens or loss of equity.

Portland metro area home damaged by fallen tree during 2024 ice storm, showing risks of large tree failure on residential properties.
Illustrative example of tree-failure damage to a single-family home during the January 2024 ice storm in the Portland metro area (Bethany neighborhood, Washington County)—unrelated to the Bond family lawsuit but demonstrating the severity of ice storm impacts and risks posed by large, vulnerable trees.
Photo: Abdur Abdul-Malik, Portland Appraisal Blog

Title 11 Fundamentals: Tree Removal Permits and Notice Requirements

Title 11 protects private trees 12 inches or larger in diameter at breast height (DBH—measured 4.5 feet above ground). Lower thresholds (6 inches DBH) apply in environmental overlay zones.

Tree removal permits fall into two categories: Type A (simpler, no public notice) and Type B (public notice and appeal opportunity). Type A covers smaller trees, limited numbers of healthy trees, dead/dying/hazardous trees, and one large healthy non-nuisance tree per residential lot per year.

Permit TypeProposalCity/Street
or Private
Public Notice/Appeal
AAny Type A request1City/street/
Private
No
AUp to four healthy <20″ diameter nuisance and non-nuisance species treesCity/streetNo
A≥20″ diameter, healthy nuisance or non-nuisance species treeCity/streetNo
BMore than four healthy >12″ diameter nuisance and non-nuisance species treesCity/streetYes
B≥20″ diameter, healthy non-nuisance species treePrivateYes2
BMore than four healthy ≥12″ diameter non-nuisance species treesPrivateYes
Table 30-1 from Portland City Code Title 11, summarizing public notice and appeal requirements for tree removal permits. Type B permits—required for most removals of large healthy private trees—trigger neighbor notification and potential appeals.
  • Note 1: The applicant may appeal any Type A or B permit decision.
  • Note 2: No public notice or opportunity for public appeal is required for removal of one healthy non-nuisance species tree ≥20″ diameter per lot per calendar year in any residential zone.

Root Protection Zones and Buildable Area Constraints

During construction, root protection zones (RPZ) extend roughly one foot of radius per inch of trunk diameter. Encroachment is limited, and fencing plus arborist oversight are mandatory.

On typical R-5 or R-2.5 lots, multiple large trees can shrink buildable area by 20–40%, forcing smaller footprints or eliminating partition potential—directly affecting highest and best use for infill or teardown sites.


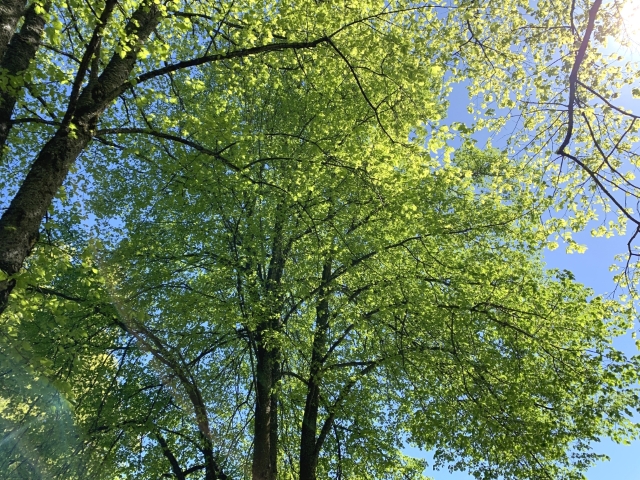
Summer foliage on a tree in a Portland neighborhood.
Photo: Abdur Abdul-Malik, Portland Appraisal Blog

Mitigation and In-Lieu Fees: The Primary Development Cost

When preservation standards are not met (generally one-third of regulated trees), options include on-site replanting or payment into the Tree Planting and Preservation Fund.

The primary development mitigation is the per-inch fee paid to the fund for off-site planting and 5-year establishment. An alternative flat fee per on-site tree applies when partial retention or replanting occurs but full density is not achieved—often used when site constraints limit complete preservation.

Per City Code 11.10.070:

Where allowed by other provisions of this Title, a fee may be paid into the Tree Planting and Preservation Fund in lieu of planting or preserving trees. The fee per tree is the entire cost of establishing a new tree in accordance with standards described by the City Administrator. The cost includes materials and labor necessary to plant the tree, and to maintain it for five years. The fee will be reviewed annually and, if necessary, adjusted to reflect current costs.

Current FY 2025–26 rates (effective July 1, 2025):

CategoryFee
Planting and Establishment Fee in Lieu (primary development mitigation)$472.00 per DBH inch
Planting and Establishment Fee in Lieu (per on-site tree alternative)$712.00 flat
Preservation Fee in Lieu (Private Trees ≥12″ and <20″ DBH)$1,888.00 per tree
Preservation Fee in Lieu (Private Trees ≥20″ DBH)$472.00 per DBH inch
Most non-development applications (removal, replanting, pruning, etc.)No charge
Selected fees from the FY 2025–26 Title 11 Trees Fee Schedule, highlighting the primary development mitigation rate ($472 per DBH inch) and non-development relief (most applications no charge).

A single 24-inch tree removed during development triggers approximately $11,328 in-lieu ($472 × 24). Multiple trees on infill lots commonly total $20,000–$50,000 or more.

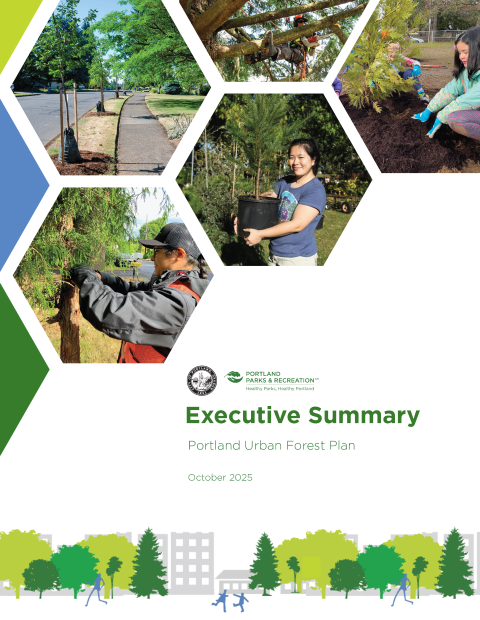
These funds support equity-focused plantings—thousands of free yard and street trees in priority neighborhoods, as detailed in the FY 2023 Fund Report.

Portland Urban Forest Plan Executive Summary cover featuring diverse community members planting and caring for trees in Portland neighborhoods.
Cover of the Portland Urban Forest Plan Executive Summary (October 2025)—a vibrant collage highlighting community planting events, equity-focused tree giveaways, and the joyful stewardship that in-lieu mitigation fees help fund across Portland.

Enforcement and Penalties

Civil penalties reach $1,000 per tree per day, with restoration fees up to $944 per DBH inch for Heritage Trees (doubled for removal). Liens may be placed on the property.

For example, unauthorized removal of a typical 24-inch Heritage Tree could trigger restoration fees of approximately $22,656 ($944 × 24) plus daily penalties up to $30,000 over 30 days—potentially $50,000 or more in total liability.

Undisclosed prior violations—discoverable via Bureau of Development Services history—can impair marketability and would likely require an adjustment in appraised value.

Heritage Trees: Permanent Deed Encumbrance

Heritage Trees receive elevated protection due to age, size, historical association, or horticultural value. Common designations include Oregon white oaks, European beeches, London planes, and legacy Douglas-firs.

Private trees require owner consent for designation, but once recorded on the deed, the restriction binds all future owners. Removal or significant pruning typically requires City Council approval—a major encumbrance on development feasibility.

Nuisance Trees and Exemptions

Dead, dying, or officially listed nuisance species receive streamlined removal pathways. Certain small lots (<5,000 sq ft) and high-site-coverage scenarios carry lighter standards.

The 2025 Urban Forest Plan: Looking Ahead

Adopted October 22, 2025, the Plan sets ambitious canopy targets (citywide 45% in 40 years; every neighborhood ≥25%) and prioritizes equity in low-canopy areas. Community input emphasized preserving large trees while acknowledging burdens and calling for greater owner rights.

Recommendation #7 explicitly calls for improving City codes to support resilience and urban forest health—signaling Phase 3 Title 11 amendments may adjust preservation standards, mitigation, or incentives in coming years.

Takeaway: Navigating Portland’s Tree Code in Property Valuation

Portland’s urban forest remains one of its greatest assets—delivering shade, beauty, wildlife habitat, and environmental benefits across tree-lined neighborhoods and iconic parks like Forest Park and Mt. Tabor. Title 11’s preservation framework helps sustain this legacy, while mitigation fees fund equity-focused plantings that expand canopy in historically underserved areas.

Yet the code creates meaningful trade-offs for property owners. In resale transactions, mature trees often enhance market appeal and may support modest contributory value—evident in marketing frequency and observational signals from recent sales data. In redevelopment or major improvement scenarios, however, the same trees trigger mitigation costs, root protection constraints, and potential permanent encumbrances—shifting highest and best use and reducing land residual value.

Appraisers reconcile these dual realities through targeted due diligence. Portland Maps provides the tree inventory and Heritage layer for initial screening. Title reports (when available from lenders on purchase transactions) flag recorded Heritage designations. Bureau of Development Services permit history may require direct inquiry if redevelopment potential raises red flags—particularly on infill or teardown lots where prior violations or approved removals can materially affect feasibility. The free PDX Tree Map offers a quick view of city-managed street and park trees for neighborhood context, though private trees (the main Title 11 focus) are not included.

As the 2025 Urban Forest Plan unfolds—with its emphasis on preserving mature trees alongside calls for greater resident cost relief and owner rights—Phase 3 code amendments may refine these balances in coming years. Monitoring regulatory evolution will remain essential for accurate valuation in Portland’s tree-rich market.

Portland Oregon park with vibrant autumn tree foliage and winding path.
Autumn foliage in a Portland park, exemplifying the seasonal beauty and character that mature trees contribute to the city’s residential and public spaces.
Via Canva Pro.

Sources & Further Reading

Decorative text divider.

Thanks for reading—I hope you found a useful insight or an unexpected nugget along the way. If you enjoyed the post, please consider subscribing for future updates.

CODA

Are you an agent in Portland who wonders why appraisers always do “x”?

A homeowner with questions about appraiser methodology?

If so, feel free to reach out—I enjoy connecting with market participants across Portland and the surrounding counties, and am always happy to help where I can.

And if you’re in need of appraisal services in Portland or anywhere in the Portland Region, we’d be glad to assist.

Portland Real Estate Appraisal Brief – Thursday, January 8, 2026: Investment Value and Value-in-Use at Willamette Falls — The Tumwata Village Acquisition

The Confederated Tribes of Grand Ronde’s $15.25 million 2019 acquisition of the contaminated former Blue Heron mill site at Willamette Falls exemplifies investment value and value-in-use, enabling a highest and best use shift stalled under prior ownership.

Willamette Falls viewed from the former Blue Heron Paper Mill site in Oregon City, Oregon, showing cascading waters and obsolete industrial structures along the riverfront.
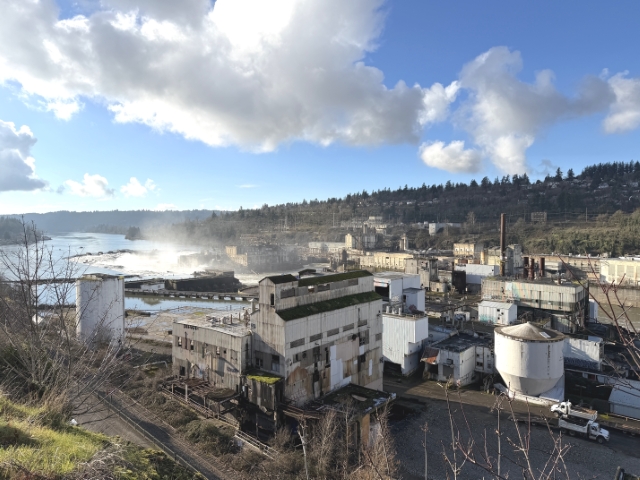
Willamette Falls in full cascade, with the former Blue Heron Paper Mill site in the midground. The dramatic natural setting contrasts sharply with decades of industrial obsolescence on the ~22-acre riverfront parcel.
Photo: Abdur Abdul-Malik, Portland Appraisal Blog (CC BY-SA 4.0)

The former Blue Heron Paper Mill site at Willamette Falls in Oregon City has long exemplified the valuation challenges posed by contaminated industrial brownfields. After the mill’s 2011 closure and subsequent bankruptcy, the ~22-acre riverfront parcel endured years of vacancy, burdened by functional obsolescence, deferred maintenance, and significant environmental liabilities that deterred conventional market participants.

In August 2019, the Confederated Tribes of Grand Ronde acquired the property for a recorded $15.25 million. This transaction stands out for appraisers as a clear illustration of investment value—the worth of a property to a particular purchaser based on individual motivations—and value-in-use, where non-economic factors such as cultural and ancestral significance justify a substantial premium over typical market indicators.

Wide view of the obsolete Blue Heron Paper Mill buildings at Willamette Falls in Oregon City, highlighting industrial decay against the natural river setting.
Panoramic view of the former Blue Heron mill complex along the Willamette River, with falls mist visible on the left. The sprawling structures illustrate extensive functional and external obsolescence following more than a decade of vacancy.
Photo: Abdur Abdul-Malik, Portland Appraisal Blog (CC BY-SA 4.0)

Site History and Market Perception

The property’s ownership and valuation history underscores the stagnation under conventional private ownership:

YearEventRecorded Price / RMV
2000Acquired by Blue Heron Paper Company from Smurfit Newsprint Corp.$2.5 million
2011Mill closure and Chapter 11 bankruptcy filing
2014Bankruptcy court sale to private developer (Falls Legacy LLC)$2.2 million
2018–2019Clackamas County Real Market Value (pre-sale, per contemporaneous reporting)~$2.9 million (improvements minimal)
August 2019Acquired by Confederated Tribes of Grand Ronde$15.25 million
Recent yearsClackamas County Real Market Value (post-acquisition)~$3.6–$4.3 million (land-focused)
2021–2024Phased demolition and remediation (approximately 40% of structures removed by 2024)
RecentOregon City master plan approval (GLUA240002)
Key ownership and valuation milestones for the ~22-acre former Blue Heron mill site, derived from Clackamas County public records and contemporaneous reporting. The lack of nominal appreciation from 2000 to 2014, followed by the substantial premium in 2019, highlights the impact of buyer-specific motivations.
Graffiti-covered rail barrier framing contaminated and obsolete waterfront infrastructure at the former Blue Heron mill site in Oregon City.
Foreground view across derelict waterfront infrastructure at the former Blue Heron site, framed by graffiti-covered rail elements. The image captures visible signs of prolonged obsolescence and inaccessibility.
Photo: Abdur Abdul-Malik, Portland Appraisal Blog (CC BY-SA 4.0)
Close-up of contaminated concrete infrastructure at the former Blue Heron Paper Mill brownfield site near Willamette Falls, Oregon City.
Detailed view of cracked concrete pads and obsolete industrial remnants in the site’s foreground basin area. Such conditions exemplify brownfield liabilities common in post-industrial valuation.
Photo: Abdur Abdul-Malik, Portland Appraisal Blog (CC BY-SA 4.0)

Appraisal Implications—Investment Value and Value-in-Use

The $15.25 million purchase price—nearly seven times the 2014 bankruptcy sale and well above the assessor’s reported Real Market Value immediately preceding the transaction—reflects investment value driven by the Tribe’s profound cultural connection to Willamette Falls, a sacred ancestral homeland and traditional fishing ground. This non-economic value-in-use enabled the Tribe to overcome remediation and holding-cost barriers that had stalled private redevelopment efforts for years.

Appraisers reconciling such sales must distinguish investment value (or value-in-use) from market value derived from arms-length transactions among typical participants. Limited comparable sales for culturally significant or heavily contaminated riverfront parcels often require significant adjustments for buyer motivation, extraordinary assumptions regarding cleanup feasibility, and bracketing with more conventional industrial land comps.

This situation parallels a more recent Portland case explored on this blog: the 1803 Fund’s adaptive reuse plans for historic grain silos along the Willamette River. In both instances, a buyer with specific motivation recognized potential in a functionally obsolete industrial asset that had deterred conventional market participants—ultimately enabling a highest and best use shift through targeted redevelopment.

Close-up of decayed industrial buildings with graffiti and moss at the former Blue Heron site in Oregon City, illustrating functional obsolescence.
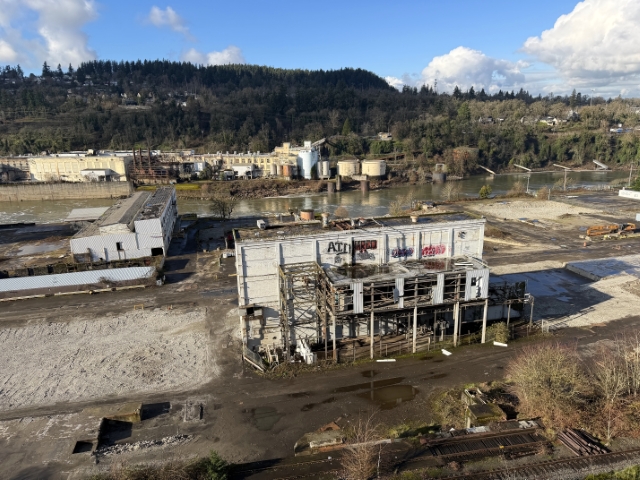
Intimate perspective on remaining mill buildings, showing moss-covered roofs, rust, broken windows, and heavy graffiti—clear evidence of functional obsolescence after years of vacancy.
Photo: Abdur Abdul-Malik, Portland Appraisal Blog (CC BY-SA 4.0)

Current Progress and the Tumwata Village Vision

Recent site visits confirm active transformation: demolition equipment, including excavators, is visibly engaged in clearing remaining structures.

Phased demolition began in 2021, with multiple rounds completed by 2024 removing approximately 40% of the former mill buildings. Remediation continues in coordination with state and federal environmental agencies.

A major fire in January 2025 destroyed one of the larger remaining buildings on the site (the former mill’s three-story structure). The incident, ruled arson and unrelated to demolition activities, did not delay the overall redevelopment timeline. Progress has continued steadily, as evidenced by recent infrastructure planning and the current state of the property.

Renamed Tumwata Village, the redevelopment proposes a mixed‑use cultural district that weaves together public access trails, ecological restoration of the riverbank and lagoon, tribal gathering spaces, and a modest mix of commercial and hospitality uses—all grounded in the site’s ancestral significance. By prioritizing riverfront restoration and new trail connections, the plan could open up rare land‑based vantage points of Willamette Falls, a natural landmark that today is mostly viewed from commercial boat tours or distant overlooks. If fully realized, the transformation would support the Confederated Tribes of Grand Ronde in cultural reclamation and long‑term stewardship, while giving Oregon City and the broader public renewed access to a stretch of the falls long closed off by industrial operations.

Oregon City’s recent approval of the master plan (GLUA240002) formalizes this highest and best use shift from interim speculative hold to culturally driven redevelopment.

Readers interested in detailed conceptual plans and site renderings can review the Tribe’s 2022 design report.

Active demolition and site clearance with excavator at the former Blue Heron mill property in Oregon City, showing progress toward redevelopment.
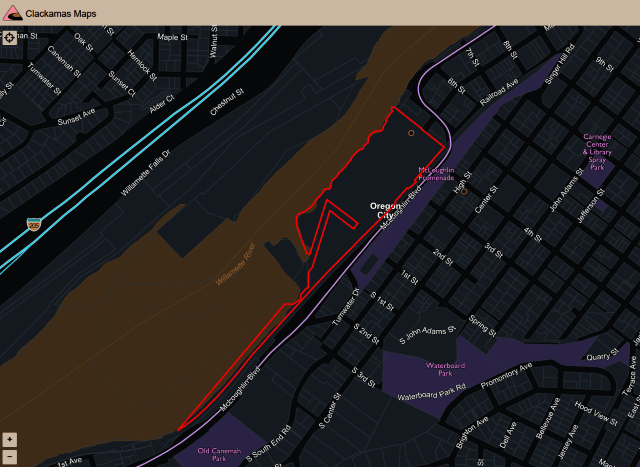
Mid-demolition scene at the site, with construction equipment including an excavator and partially cleared areas visible. Ongoing remediation phases demonstrate the reversal of obsolescence through active transformation.
Photo: Abdur Abdul-Malik, Portland Appraisal Blog (CC BY-SA 4.0)
Clackamas County GIS map showing the ~22-acre riverfront parcel of the former Blue Heron Paper Mill site at Willamette Falls in Oregon City.
Clackamas County GIS overview of the ~22-acre former Blue Heron mill site (red outline), illustrating its extensive Willamette River frontage and proximity to the falls. The contiguous parcel configuration supports comprehensive redevelopment potential.
Source: Clackamas County Maps.

Takeaway

The Tumwata Village acquisition serves as a compelling case study in investment value and value-in-use. When a purchaser’s motivations—here rooted in cultural reclamation—align with a property’s unique attributes, transaction prices can far exceed indicators derived from conventional market behavior. Appraisers must remain alert to these distinctions, employing careful reconciliation techniques and appropriate adjustments when comparable data is limited.

Ultimately, the project illustrates how buyer-specific utility can reverse long-standing obsolescence, shifting a site’s highest and best use in ways the open market alone could not achieve. If realized, the vision promises not only tribal stewardship of ancestral lands but also broader public access to one of Oregon’s most iconic natural features—offering land-based and proximate views of Willamette Falls where few currently exist.

Sources & Further Reading

Decorative text divider

Thanks for reading—I hope you found a useful insight or an unexpected nugget along the way. If you enjoyed the post, please consider subscribing for future updates.

CODA

Are you an agent in Portland who wonders why appraisers always do “x”?

A homeowner with questions about appraiser methodology?

If so, feel free to reach out—I enjoy connecting with market participants across Portland and the surrounding counties, and am always happy to help where I can.

And if you’re in need of appraisal services in Portland or anywhere in the Portland Region, we’d be glad to assist.

Portland Real Estate Weekly Appraisal Digest – December 21st – December 27th, 2025: Affordability Barriers and Tax Shifts

A vibrant sunset casts warm orange and pink hues over the Willamette River in downtown Portland, Oregon. In the foreground, the green steel arches of the Hawthorne Bridge span the calm water, while the city's skyline—featuring prominent high-rise buildings with distinctive architectural elements—rises against the colorful sky. Trees line the riverbank, adding a touch of greenery to the urban scene.

The final full week of 2025 sharpened focus on the deep affordability barriers defining the Portland Region’s housing market, while also spotlighting regulatory and tax issues with real consequences for homeowners—especially veterans. A closer look at the 2024 MAV Reset Clarification revealed how the loss of a disabled veteran exemption can trigger a permanent upward reset in maximum assessed value, locking in higher property taxes even if the exemption is later restored. Meanwhile, groundbreaking on a major apartment project pushed forward despite tight financing, and fresh Q3 data underscored why most first-time buyers must now wait until age 40 to enter the detached single-family market.

That Q3 analysis, powered by the new Portland Appraisal Blog Affordability Index (PABAI), showed that fewer than 10% of recent detached sales were realistically within reach for households aged 25–44 once full PITI costs are considered. A separate deep dive into today’s typical $600,000 home purchase laid out the household income actually required—far above median levels for younger buyers. Together, these pieces highlight a region where entry-level detached ownership remains elusive without substantial down-payment help, outlier earnings, or delayed timelines.

At the same time, multifamily development continues as one of the brighter spots, with projects like the Barbur Apartments aiming to deliver more rental options amid high construction costs and steep financing hurdles. These efforts reflect broader attempts to ease the overall supply crunch, even as single-family affordability stays structurally constrained.

Table of Contents

Sunday, December 21: Barbur Apartments Groundbreaking Highlights Plottage Value

The Barbur Apartments site sits at the prominent intersection of SW Barbur Blvd and SW Capitol Hill Rd.
Photo: Portland Appraisal Blog

Groundbreaking commenced in mid-December 2025 on the Barbur Apartments, a 150-unit affordable family housing project located at the corner of SW Barbur Blvd and SW Capitol Hill Rd in Portland’s Hillsdale/Multnomah Village area. Developed by Innovative Housing, Inc., the complex will feature one three-story building and two four-story buildings, delivering 149 income-restricted units (one reserved for an onsite manager) with many larger two- to four-bedroom layouts targeted at immigrant and refugee families. Amenities include a courtyard and community spaces, with completion expected in Fall 2027.

The project carries an estimated total development cost of approximately $79.4 million, supported by about $27.3 million from the Portland Housing Bureau alongside regional Metro Housing Bond funds, federal sources, and Portland Clean Energy Community Benefits Fund contributions for energy efficiency. It emphasizes transit access along the Barbur corridor, with approved plans providing roughly 45 on-site parking spaces—a ratio of about 0.3 spaces per unit reflecting the transit-oriented design.

From an appraisal perspective, the redevelopment exemplifies plottage, the incremental value gained by assembling contiguous parcels into a larger, more developable site. Four tax lots totaling around 2.19 acres were purchased together in February 2025 for just under $6 million. Individually constrained by size, zoning, and existing improvements, the parcels supported only lower-intensity uses.

One parcel formerly held a 1927-built single-family home of approximately 2,336 square feet that was never listed on the open market and quickly demolished, demonstrating clear functional obsolescence as the corridor evolves. An adjacent former commercial strip—Barbur Blvd Rentals—remains standing but fenced within the construction zone. Together, these lots enable a density and scale unattainable separately, illustrating classic plottage and a shift to higher-density residential as the highest and best use.

Directly across Barbur Blvd sits a large Safeway complex with extensive covered and surface parking, a significant amenity for future residents. However, with the project’s limited on-site parking space and family-oriented unit mix, residents and guests may increasingly rely on this private lot for overflow. A mid-morning site visit revealed a nearly full garage, suggesting potential increased daytime use once occupied—a dynamic worth monitoring.

Local market data from 2024–2025 closed sales in Hillsdale and Multnomah Village underscores limited affordability. Detached homes led with 351 sales averaging $750,000 and 50 days on market. Condominiums, the most accessible ownership segment by volume, averaged $445,000 across 78 sales with longer 68-day absorption. Attached homes, a small segment of just 13 transactions, averaged $581,000—likely due to more recent construction (average year built 2010) and associated premiums. Overall averages reached $691,000, highlighting ownership barriers and the critical role of regulated rentals like Barbur Apartments for lower-income and larger households.

This assemblage aligns with broader city efforts to expand housing through density and public investment, including recent regulatory reforms aimed at reviving Portland development.

Tuesday, December 23: The Measure 50 Compression Trap and the 2024 MAV Reset Clarification

A classic pre-1940 home in the Portland Region – the type of property often benefiting from deep Measure 50 tax compression.
Photo: Abdur Abdul-Malik, Portland Appraisal Blog

In Oregon’s property tax system, established by Measure 50 in 1997, a common pitfall has emerged for buyers of older homes: unexpectedly high tax bills following the loss of certain partial exemptions. This occurs when a veteran or active-duty partial exemption ends—often upon sale or the owner’s passing without a qualifying successor—triggering a reset of the property’s Maximum Assessed Value (MAV) closer to current market reality. Previously, counties preserved the low MAV after removing the exemption, but updated 2024 guidance from the Oregon Department of Revenue now enforces a constitutional recalculation, potentially adding $2,000–$6,000 annually to taxes for pre-1997 properties with deep compression.

Measure 50 created two key values: Real Market Value (RMV), reflecting current market conditions, and MAV, initially set below 1995–1997 RMV and capped at 3% annual growth thereafter (with exceptions). The Assessed Value (AV) is the lesser of the two, leading to substantial compression in high-appreciation areas like Portland, where older homes often have MAV far below RMV. When a partial exemption disqualifies, the new guidance applies the Changed Property Ratio (CPR)—around 0.54 for residential properties in Portland Region counties for 2025–2026—to reset MAV to current RMV multiplied by CPR, aligning taxes more closely with newer homes.

Q3 2025 sales data for detached single-family residences in the Portland Region highlights this compression. Pre-1940 homes averaged $671,295 in sale price but only $6,396 in annual taxes, while 1940–1959 properties averaged $607,466 with $5,766 in taxes. In contrast, 2000–2019 homes averaged $761,061 with $7,685 in taxes. Effective tax burdens remained consistent at ~$9–$10 per $1,000 of sale price across eras, showing the market prices properties assuming similar overall loads. However, absolute taxes rise with newer construction due to less historical compression, and pre-1940 homes often command premiums despite lower taxes—creating vulnerability when resets occur.

The veteran (ORS 307.250) and active-duty (ORS 307.286) exemptions provide modest reductions—up to $31,565 or $108,366 for 2025–2026, worth $400–$700 annually in savings—but their disqualification now triggers the full MAV reset. With over 114,000 veterans in the metro area, affected transactions can see increases of $1,500–$4,000 yearly in typical cases, or $4,000+ in deeper-compression scenarios. This translates to $125–$333 monthly, comparable to a car payment, potentially straining affordability and prompting renegotiations.

For market participants, the reset introduces friction: buyers may demand concessions, sellers (including veterans or surviving spouses) face lower net proceeds, and properties can linger on the market if low current taxes mask future costs. Outliers with unusually low taxes may reflect active exemptions or compression soon to erode.

Appraisers should verify exemption status via county records, estimate post-reset taxes, and comment on marketability when material. Low-tax comparables warrant scrutiny—effective rates of 0.6–0.8% may signal compression, better aligned post-reset at 1.1–1.3%. Providing dual tax scenarios aids informed valuation. As resets appear in more closed sales from 2026 onward, this factor will increasingly explain pricing anomalies in Oregon’s older housing stock.

Thursday, December 25: Portland’s Starter Home Market (Q3 2025) — What $469k Really Buys

A classic early-20th-century bungalow in the Portland area—the type of modest, well-loved home that dominates today’s starter-tier inventory.
Via Canva Pro

In another Appraisal Deep Dive, we examine Portland’s starter-home market using Q3 2025 RMLS data for detached single-family residences in the 5th–35th percentile by price—the same convention Redfin used in its October report highlighting Portland’s strong starter activity.

Redfin’s reported median of approximately $420,000 includes all property types, but focusing solely on detached homes—a popular choice across the metro, including for urban buyers seeking yard space and privacy—yields an average close price of $469,000. Local buyers want to know how much home this budget actually buys, and the data reveals a market overwhelmingly dominated by mid-century inventory, with stark county differences and only a modest presence of brand-new construction.

Across the core counties, Multnomah drives nearly half the volume with the oldest average build year (1951), while Washington posts the highest prices and hosts the most new homes. Outer counties like Columbia and Yamhill offer newer builds on larger parcels but far fewer sales. Square footage emerges as one of the stronger (though still modest) drivers of price, with most sales clustering between 1,200 and 2,000 square feet. Lot size patterns show a clear historical shift: post-war boom homes (1940s–1950s) typically enjoy generous parcels, while newer construction relies on much smaller lots—often the result of infill and divisions.

New homes account for just 4.2% of starter-tier sales (versus 9.1% market-wide), yet their presence remains noteworthy in a high-cost building environment. They sell for only about 3% more than existing homes despite brand-new condition but deliver less interior space and roughly half the land. For buyers, this creates a clear trade-off: modern efficiency and low maintenance on a very small lot (often minimal usable yard, especially in Multnomah and Washington) versus an older mid-century home with significantly more outdoor space, albeit with potential challenges in systems and layout—a choice particularly relevant for growing families prioritizing play areas or privacy.

Appraisal insights reveal that chronological age correlates weakly with both sales price and price per square foot. Effective age, condition, and site utility drive value far more, with lot size advantages in older homes often offsetting credits for new condition. When appraising the limited new-construction sales (down ~25% YoY overall, 48% in Multnomah), appraisers typically rely on other recent builds and adjust heavily for quality of upgrades and site characteristics.

Overall, Portland’s starter segment continues heavy reliance on mid-century stock on larger lots—a pattern unlikely to change dramatically in 2026 without major supply shifts, though the City of Portland is attempting to incentivize new projects via SDC waivers. The modest new-construction foothold demonstrates builder adaptation, but at the clear cost of site size and outdoor space.

Saturday, December 27: Portland’s First-Time Buyers Have No Choice But to Wait Until 40 — Q3 2025 Data Explains Why

Classic Craftsman bungalows homes in a Portland neighborhood. While older detached stock like this offered relatively better access for younger buyers in Q3 2025 (15% affordable in Multnomah County under realistic PITI assumptions), many close-in properties commanded premium prices—this example on the right sold for $1.1 million.
Photo: Abdur Abdul-Malik, Portland Appraisal Blog

Recent Q3 2025 data reveals that only about 10% of detached single-family homes in the Portland Region were affordable to typical households aged 25–44 under realistic payment assumptions, highlighting why first-time buyers are increasingly delayed until reaching age 40. Nationally, the median age of first-time buyers has hit a record 40, with their share of purchases at a historic low, driven by persistent affordability barriers.

Traditional measures, such as the National Association of Realtors’ Housing Affordability Index—which considers only principal and interest with a 25% qualifying ratio—suggest that roughly 28% of Q3 2025 detached sales in the six-county Portland Region were affordable to a household at the area median income of $124,100. However, incorporating actual property taxes and a conservative homeowners insurance estimate into the full PITI payment drops this to 20% for the same benchmark.

This analysis introduces the new Portland Appraisal Blog Affordability Index (PABAI)—a more accurate, PITI-based metric tailored to the Portland Region’s market. The PABAI expresses affordability as an index value (100 indicating exact qualification for the typical home) and derives the percentage of sales affordable to reference households. For the regional benchmark using HUD’s $124,100 area median income, the PABAI stood at approximately 78. For younger 25–44 households with a median income of about $110,000, it fell to 69—meaning only 9.8% of Q3 detached sales (460 out of 4,682) were within reach. The typical $600,000 detached home required roughly $159,000 in household income—45% above this cohort’s median.

County-level variation underscores geographic disparities for 25–44 buyers. Outer areas like Columbia County (34% affordable) and Yamhill County (23%) provided the most options, though often at the cost of longer commutes to urban centers. Multnomah County outperformed at 15%, benefiting from denser, older stock, while suburban Washington (3%) and Clackamas (5%) counties lagged due to larger lots and higher-priced inventory. Hood River registered just 3%.

In Q3 2025, younger buyers seeking detached homes typically needed substantial family assistance, extreme lifestyle sacrifices for larger down payments, or outlier incomes well above cohort medians to gain entry. Without these, most were effectively priced out until accumulating higher earnings in their late 30s or early 40s—or forced into alternatives like condominiums.

The PABAI models affordability with a 20% down payment, 28% front-end ratio, actual rates, listing taxes, and a 0.40% insurance rate, offering granular insights beyond national indices that overlook taxes and insurance. This realistic approach confirms the structural challenges pushing first-time buyer ages upward in the Portland Region.

Week’s Blog Posts & Further Reading Links

Closing Remarks

Taken together, this week’s coverage paints a picture of a Portland metro market where structural barriers—high prices, elevated property taxes, and insurance costs—continue to sideline younger households from detached homeownership. The introduction of the Portland Appraisal Blog Affordability Index offers a clearer, more localized tool for understanding these gaps, showing that realistic PITI-based qualifying leaves fewer than 10% of recent sales within reach for 25–44-year-olds.

Regulatory and measurement topics add another layer of complexity for industry professionals. Clarifications around the 2024 MAV Reset and the accompanying tax implications serve as reminders that appraisal assignments increasingly demand careful awareness of tax policy and its effects on value and marketability.

The common thread remains one of constrained supply at affordable price points, driving both multifamily investment and prolonged timelines for single-family entry. These dynamics suggest the region will continue favoring those with established equity or higher earnings, while first-time buyers face extended waits or alternative paths like condominiums.

Decorative text divider.

Thanks for reading—I hope you found a useful insight or an unexpected nugget along the way. If you enjoyed the post, please consider subscribing for future updates.

Question: With first-time buyers now commonly having to wait until 40 to purchase a detached home in the Portland Region, what trade-offs are younger households making today to eventually break into ownership?

CODA

Are you an agent in Portland who wonders why appraisers always do “x”?

A homeowner with questions about appraiser methodology?

If so, feel free to reach out—I enjoy connecting with market participants across Portland and the surrounding counties, and am always happy to help where I can.

And if you’re in need of appraisal services in Portland or anywhere in the Portland Region, we’d be glad to assist.

Appraisal Deep Dive: The Measure 50 Compression Trap and the 2024 MAV Reset Clarification

How pre-1997 Portland metro homes—especially those with veteran or active-duty exemptions—are facing sudden property tax jumps on sale or disqualification.

Exterior view of a well-maintained pre-1940 Colonial-style home in Portland, featuring a symmetrical facade, dormer windows, columns, red front door with wreath, and landscaped yard with steps leading to the entrance on an overcast day.
A classic pre-1940 home in the Portland Region – the type of property often benefiting from deep Measure 50 tax compression.
Photo: Portland Appraisal Blog

Table of Contents

  1. Introduction
  2. Understanding Measure 50: The Foundation of Tax Compression
  3. The Data: Tax Compression in the Portland Metro Market
  4. The Veteran and Active-Duty Exemptions
  5. The 2024 Rule Change
  6. Real-World Implications
  7. What Appraisers Should Do
  8. Closing Thoughts

Introduction

Imagine closing on a well-maintained pre-1940 Craftsman in an established close-in Portland neighborhood. The sale price felt fair, the taxes shown on the listing and county statement appeared reasonable, and the transaction cleared due diligence without issue. Then the next year’s tax bill arrives—$2,000 to $6,000 higher than anticipated. The increase isn’t due to a sudden spike in market value, but to a change in how Oregon counties now calculate Maximum Assessed Value (MAV) when certain partial property tax exemptions end.

This situation is no longer hypothetical. Oregon REALTORS first highlighted the risk in a December 12th, 2025 internal “Forms Tip of the Week” communication, alerting members that the loss of veteran or active-duty partial exemptions—commonly triggered when a qualifying veteran or surviving spouse sells the home or passes away without a qualifying successor—can lead to significant tax increases under updated guidance from the Oregon Department of Revenue.

While the veteran and active-duty exemptions (ORS 307.250 and 307.286) have drawn attention to the issue, the underlying driver is broader: the substantial tax compression created by Measure 50 for properties built or long-held before 1997.

Historically, when these modest partial exemptions ended, counties simply removed the discount and allowed the low underlying MAV to continue. The 2024 guidance change now enforces a constitutional requirement to reset MAV closer to current market reality upon disqualification.

The outcome: buyers may face permanently higher carrying costs they did not expect, sellers (including veterans and surviving spouses) can find their properties harder to market at full value, and appraisers encounter a marketability factor worthy of note when present.

This Deep Dive reviews the mechanics, illustrates the pattern with Portland Region sales data, and provides practical steps for identifying and addressing the issue in appraisal assignments.

Understanding Measure 50: The Foundation of Tax Compression

To grasp why the loss of a veteran or active-duty exemption can now lead to significant tax increases, we must first understand Oregon’s Measure 50 property tax system, approved by voters in 1997.

Measure 50 replaced the previous tax structure with two key values for each property:

  • Real Market Value (RMV): The county assessor’s estimate of what the property would sell for on the open market. This value can rise or fall annually with market conditions.
  • Maximum Assessed Value (MAV): A separate taxable value created by Measure 50. For existing properties in 1997, MAV was initially set at approximately 90% of the 1995–1997 RMV. Thereafter, MAV is generally limited to a 3% annual increase, with exceptions for major additions, improvements, or certain other events.

The Assessed Value (AV) is the lesser of RMV or MAV. Taxes are calculated by multiplying the AV by the local tax rate.

In high-appreciation markets like the Portland metro area, this 3% cap creates substantial tax compression over time. A home purchased or built before 1997 can have an MAV far below its current RMV after decades of strong market growth.

Scatter plot of annual property taxes versus year built for Q3 2025 single-family detached residential sales in the Portland Region, excluding new construction and data errors. Pre-1960 homes cluster tightly below $10,000–$12,000 in taxes; post-1990 homes show higher and wider spread, with a slight positive red trend line. Data source: RMLS via PortlandAppraisalBlog.com.
Annual property taxes vs. Year Built, excluding new construction and obvious data errors.
Note: Scatter plots are limited to properties with annual taxes of $21,000 or less to highlight the primary distribution and improve readability.

The scatter illustrates the effect clearly: pre-1960 homes are overwhelmingly clustered below $10,000–$12,000 in annual taxes, with the densest grouping under $8,000–$9,000. Properties on the far left (pre-1920 builds) often show the deepest compression, having benefited from the longest period of capped MAV growth. Post-1990 homes, by contrast, display significantly higher tax burdens, reflecting less historical compression.

When a triggering event occurs—such as disqualification from a partial exemption—the MAV can be recalculated using the Changed Property Ratio (CPR), typically around 0.54 for residential properties in Portland Region counties for the 2025–2026 tax year, applied to current RMV.

In the next section, we examine local sales data that quantifies the scale of this compression and illustrates why the reset can matter in real transactions.

The Data: Tax Compression in the Portland Metro Market

Q3 2025 sales data from detached single-family residences (SFR) in the Portland Region (Clackamas, Columbia, Hood River, Multnomah, Washington, and Yamhill counties) illustrates the scale of Measure 50 compression and why a MAV reset can create material differences in carrying costs.

The table below summarizes average sale prices and annual property taxes by approximate decade built. Flagged new construction is excluded due to frequently incomplete or preliminary tax assessments at the time of sale, which can distort the pattern of long-term compression. This brings the Q3 2025 dataset to 4,256 sales total.

Decade BucketAvg Sale PriceAvg Annual TaxesAvg Tax per $1k Sale Price
Pre-1940$671,295$6,396$9.33
1940–1959$607,466$5,766$9.53
1960–1979$640,000$5,783$9.16
1980–1999$714,535$7,367$10.31
2000–2019$761,061$7,685$10.10
2020+ (non-new construction)$924,420$8,016$9.12
Grand Total (excluding new construction)$688,838$6,665$9.68
Data: RMLS | Portland Appraisal Blog

Several patterns stand out:

  • Absolute tax burden increases with newer construction: pre-1980 homes average $5,766–$6,396 in annual taxes, while 2000–2019 properties average $7,685 and 2020+ non-new construction reaches $8,016.
  • Effective burden consistency: The Tax per $1k column remains remarkably stable at ~$9–$10 across all eras. This indicates the market prices properties assuming a similar overall tax load, regardless of age.
  • Pre-1940 premium: Outside recent construction, pre-1940 homes command the highest average sale prices ($671,295) despite paying among the lowest absolute taxes.
Street sign for NE Knott St in Historic Irvington, Portland, featuring the neighborhood's decorative column logo on a green and black background.
Street sign in Portland’s Historic Irvington neighborhood—one of the areas with many high-value pre-1940 homes exhibiting significant Measure 50 compression.
Photo: Portland Appraisal Blog (CC BY-SA 4.0)
Scatter plot showing sale price versus annual property taxes for Q3 2025 single-family detached residential sales in the Portland Region. Points form a strong upward trend from approximately $500,000 sale price at $5,000 taxes to over $4,000,000 at $20,000 taxes, with a red trend line indicating positive correlation. Data source: RMLS via PortlandAppraisalBlog.com.
Sale price vs. annual taxes, excluding new construction and obvious data errors.
Note: Scatter plots are limited to properties with annual taxes of $21,000 or less to highlight the primary distribution and improve readability.

This scatter shows a strong positive correlation, confirming the market efficiently incorporates expected tax burden into pricing.

Scatter plot of annual property taxes versus total square footage for Q3 2025 single-family detached residential sales in the Portland Region. Points cluster along an upward red trend line, with many low-tax outliers below the line. Data source: RMLS via PortlandAppraisalBlog.com.
Annual taxes vs. total square footage, excluding new construction and obvious data errors.
Note: Scatter plots are limited to properties with annual taxes of $21,000 or less to highlight the primary distribution and improve readability.

Here, numerous low-tax outliers are visible below the trend line—properties paying substantially less than size and location would otherwise suggest, consistent with Measure 50 compression.

Taken together, the data reveals a market that rewards older stock with lower absolute taxes without discounting sale prices accordingly. When a MAV reset occurs, absolute taxes move toward levels seen in newer comparable properties, creating the potential for noticeable increases in annual carrying costs.

In the following sections, we explore the specific veteran and active-duty exemptions and the 2024 guidance change that can trigger this alignment.

The Veteran and Active-Duty Exemptions

The exemptions at the center of the current concern are partial property tax reductions for certain military veterans, surviving spouses, and active-duty service members. With approximately 267,000 veterans living in Oregon (and over 114,000 in the Portland metro region), even a fraction of qualifying owners selling or changing status can affect a meaningful number of transactions.

The disabled veteran or surviving spouse exemption (ORS 307.250) provides a reduction to assessed value for homeowners with a service-connected disability rating of 40% or higher (or unremarried surviving spouses). For the 2025–2026 tax year, the reduction is up to $31,565 (service-connected) or $26,303 (standard), worth roughly $400–$700 in annual tax savings in Portland metro areas depending on local rates.

A separate active-duty exemption (ORS 307.286) offers a larger reduction (up to $108,366 for 2025–2026) for Oregon-domiciled service members on qualifying active duty outside the state.

Both are partial exemptions applied to the assessed value of the owner’s primary residence and tied to personal status. Eligibility generally requires a one-time application and VA certification (re-filing needed only if moving to a new property or certified by a private physician rather than the VA).

While the direct savings from these exemptions is modest ($400–$700/year for most veteran claims), the 2024 DOR guidance change treats their disqualification as triggering a full MAV reset—potentially closing decades of Measure 50 compression and leading to significantly higher taxes.

Active-duty cases (e.g., exemption ending upon return home) are less common and typically involve properties with less historical compression.

In the next section, we detail the 2024 guidance change and how it activates the reset.

The 2024 Rule Change

For decades, when a veteran or active-duty partial exemption ended, county assessors typically removed the reduction but preserved the underlying compressed MAV, allowing it to continue growing at the standard 3% rate.

This practice changed with updated guidance from the Oregon Department of Revenue, effective for disqualifications on or after January 1, 2024.

The DOR clarified that disqualification from a partial exemption triggers the constitutional requirement to recalculate MAV using the Changed Property Ratio (CPR)—the county-wide ratio of average MAV to average RMV for the property class. The new MAV becomes current RMV multiplied by the CPR (typically around 0.54 for residential properties in Portland Region counties for the 2025–2026 tax year).

This administrative enforcement of the existing constitutional language means the modest exemption savings ($400–$700/year) is no longer the only consequence. The reset can close much of the Measure 50 compression gap.

In the Portland Region data, pre-1980 homes average $5,766–$6,396 in taxes. A reset aligns absolute taxes closer to 2000+ levels ($7,685–$8,016 average), producing increases commonly in the $1,500–$4,000 annual range on typical sales, with $4,000+ possible in deeper-compression or higher-rate scenarios.

The change is statewide, though impacts vary by local appreciation and rates. Some counties have noted the potential for “significant increase” on loss of exemption.

In the next section, we examine the real-world implications for transactions and what appraisers should watch for.

Real-World Implications

The 2024 guidance change does not turn every pre-1997 home sale into a crisis, but it introduces friction that can affect negotiations, marketability, and reconciliation of comparables.

Typical tax increases fall in the $1,500–$4,000 annual range for properties in the Portland Region dataset ($600,000–$800,000 sale prices with pre-1980 build years). This translates to $125–$333 extra per month.

The Silent Car Payment

In late 2025 terms:

  • Average used-car payment: ~$532/month
  • Average new-car lease: ~$596/month
  • Average new-car purchase payment: ~$748/month

A $2,000–$4,000 annual increase ($167–$333/month) is less than a typical car payment but still noticeable—equivalent to a permanent, non-negotiable “utility bundle” that never goes away. For buyers already stretched in a higher-interest-rate environment, it can shift affordability and prompt renegotiation.

Outlier cases with deeper compression (often “sweet” pre-1940 homes in high-appreciation locations) can see $4,000–$8,000+ increases ($333–$667/month)—territory overlapping average used-car or new-lease payments. These are the transactions Oregon REALTORS described as producing “increases in the thousands,” sometimes requiring substantial seller concessions or risking fallout during due diligence.

The primary impact is often on marketability rather than outright deal death:

  • Savvy buyers (or their agents/lenders) anticipate the higher future taxes and adjust offers downward.
  • Sellers—particularly veterans or surviving spouses downsizing—may receive lower net proceeds (capitalizing a $3,000 increase at 6% equates to ~$50,000 less effective value).
  • Listings can linger if the low current taxes mask the post-closing reality.

For appraisers, this creates a new lens for outliers:

  • A comparable with an unexplained lower price, large concession, or extended days on market may reflect buyer reaction to a pending MAV reset.
  • Low-tax outliers in the grid (visible in the Taxes vs. Total SF scatter) could indicate compressed MAV or an active exemption—worth verifying via county records when material.

The change is statewide, but effects are most pronounced in areas with strong historical appreciation, like the Portland Region.

In the next section, we outline practical steps appraisers can take to identify and address this factor in reports.

What Appraisers Should Do

The 2024 guidance change introduces a marketability factor that appraisers in Oregon should consider when the subject or comparables involve pre-1997 properties, particularly those with potential veteran or active-duty exemptions.

Practical Checklist

  1. Verify Exemption Status Review county tax records and the preliminary title report (if available) for indications of an active veteran, surviving spouse, or active-duty partial exemption. Many counties list it on the property tax statement or online portal.
  2. Estimate Post-Transfer Tax Liability If an exemption is present and likely to disqualify on transfer (e.g., sale to non-qualifying buyer), note the potential increase. Use county assessor tools or CPR data to project the reset MAV (current RMV × CPR) and resulting taxes. Typical jumps in the Portland Region fall in the $1,500–$4,000 annual range, with higher amounts possible in deep-compression cases. Note that tax rates vary by code area.
  3. Comment on Marketability When Material Include commentary if the differential is significant: “The subject property currently benefits from a veteran partial exemption expected to end upon transfer, potentially increasing annual taxes by an estimated $X. This may affect buyer affordability and market reaction.”
  4. Reconcile Outliers with This Lens Low-tax outliers in the sales grid (visible in Taxes vs. Total SF analysis) may reflect compressed MAV or an active exemption—a “decaying asset” under the new guidance. Check effective tax rate (annual taxes ÷ sale price): ~0.6–0.8% may indicate compression; consider post-reset alignment (~1.1–1.3%) in reconciliation. Using a compressed comparable without adjustment risks overvaluing the subject’s marketability, as savvy buyers increasingly factor in the reset.
  5. Use Dual Scenarios if Appropriate For subjects with active exemptions, provide current and projected post-reset tax estimates in the addendum or comments to inform the intended user.

Resources:

  • County assessor websites (tax statements often flag exemptions)
  • DOR Veteran Exemptions page
  • MAV Manual for general mechanics

As resets propagate into closed sales (expected more visibly in 2026 onward), this factor may explain otherwise puzzling comparables. Early identification helps ensure accurate valuation and informed clients.

In the closing section, we look at the broader outlook.

Closing Thoughts

The 2024 DOR guidance change is an administrative enforcement of a long-standing constitutional provision, but its impact is only now becoming visible as disqualifications occur and 2025–2026 tax statements arrive. Larger effects are expected in the 2026–2027 cycle as more veteran-owned properties sell or change status.

The 2025 Oregon Legislative Session saw bills (e.g., HB 2361/SB 387 aiming to lower the disability threshold, HB 3287 to increase exemption amounts) intended to expand veteran benefits. While these efforts highlight recognition of the issue, none addressed the MAV reset trigger itself. The constitutional requirement remains unless amended or re-interpreted.

For appraisers working in the Portland Region and similar appreciation-driven markets, this issue adds one more layer to marketability analysis. Low-tax outliers in older properties represent a benefit that can evaporate on transfer—reliable today, but potentially “decaying” tomorrow.

Awareness helps everyone involved: appraisers reconcile comparables more accurately, agents counsel clients proactively, and buyers/sellers avoid surprises.

If you encounter real-world examples (anonymized comps with concessions due to reset concerns, or listings noting the risk), please share them for future updates. Documenting patterns strengthens our collective understanding.

Thank you for reading this Appraisal Deep Dive. Stay informed and precise in your work.

Quick Reference Cheat Sheet

Reset FormulaReal Market Value (RMV) × Changed Property Ratio (CPR)
Typical CPR (2025–2026, Portland Region residential)~0.54 (updated annually each October)
Reset TriggerDisqualification from veteran/active-duty exemption
Typical Annual Increase$1,500–$4,000 ($125–$333/month)
Outlier Increase$4,000–$8,000+ ($333–$667+/month)
Data: RMLS | Portland Appraisal Blog

Sources & Further Reading

Decorative text divider.

Thanks for reading—I hope you found a useful insight or an unexpected nugget along the way. If you enjoyed the post, please consider subscribing for future updates.

CODA

Are you an agent in Portland who wonders why appraisers always do “x”?

A homeowner with questions about appraiser methodology?

If so, feel free to reach out—I enjoy connecting with market participants across Portland and the surrounding counties, and am always happy to help where I can.

And if you’re in need of appraisal services in Portland or anywhere in the Portland Region, we’d be glad to assist.