TriMet’s November 30, 2025, evening bus frequency reductions prompt early rider concerns, meriting monitoring for subtle effects on multifamily demand in the Portland metro.
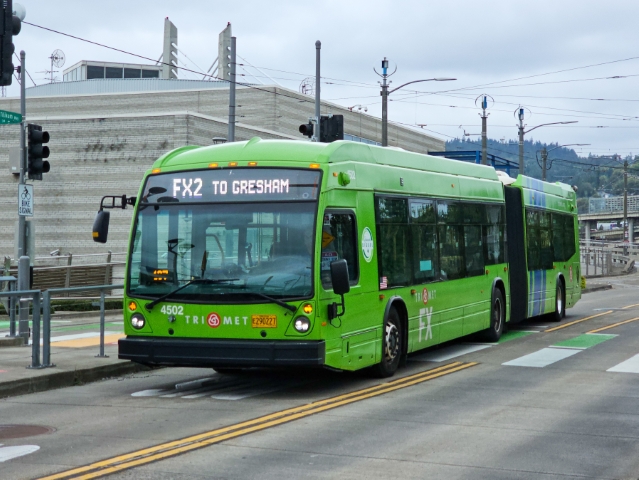
TriMet FX2–Division bus at the OMSI SE Water station in Southeast Portland. Photo: Truflip99 via Wikimedia Commons (CC BY 4.0)
TriMet’s Initial Service Adjustments Take Effect
On November 30, 2025, TriMet implemented the first phase of service reductions, focusing on reduced frequency during low-ridership evening hours on five bus lines. These changes include:
Line FX2–Division: Every 24–35 minutes after 7 p.m. daily.
Line 35–Macadam/Greeley: Hourly after 9 p.m., with partial route suspension after 9 p.m.
Lines 52–Farmington/185th, 77–Broadway/Halsey, and 81–Kane/257th: Hourly after 9 p.m. on weekdays.
These targeted adjustments aim to address a projected $300 million budget gap over the coming years, driven by operating costs rising over 50% since 2019, ridership recovering to only about two-thirds of pre-pandemic levels, and insufficient new funding sources. A second phase of similar reductions on additional lines is planned for March 2026, with broader changes potentially following in late 2026 and 2027 if revenue challenges continue.
While these initial cuts are modest and timed for off-peak periods, they signal ongoing fiscal pressures on public transit in the Portland metro area.
Appraisal Implications
Residential Properties
Reliable transit access contributes to neighborhood demand and home marketability in the Portland region, particularly in areas with higher Transit Scores. These evening-focused reductions may have limited immediate impact on most single-family homeowners, many of whom have vehicle alternatives for off-peak travel.
Appraisers should remain attentive to buyer preferences in affected submarkets, such as parts of East Multnomah County or Washington County’s outer corridors served by these lines. Properties near core MAX stations or frequent daytime routes are likely to retain stronger connectivity advantages.
Multifamily Properties
Multifamily operators and investors may benefit from closer monitoring of these changes, especially for properties serving tenants with lower vehicle ownership rates. Reduced evening bus frequencies could subtly influence tenant convenience for shift workers or late commutes, potentially affecting renewal rates or lease-up pacing in directly impacted areas.
Early rider feedback highlights these concerns: parents report challenges managing long waits with children during appointments, while commuters note risks of lateness for evening shifts. For income valuations, any emerging softness in rents or occupancy—particularly in outlying complexes reliant on these specific lines—could inform minor adjustments to projected income streams. Core urban assets with redundant transit options should experience minimal effects.
Market Context
Portland’s housing policies continue to emphasize transit-oriented development and density to support affordability and sustainability goals. These initial service reductions—limited to off-peak hours—create some tension with those objectives, as reduced evening access may encourage greater car dependency in affected areas, countering recent efforts to reduce parking minimums and enhance walkability.
Appraisers, lenders, and investors in transit-reliant submarkets should monitor emerging patterns in lease-ups, renewal rates, and buyer feedback as riders adapt to the changes.
Thanks for reading—I hope you found a useful insight or an unexpected nugget along the way. If you enjoyed the post, please consider subscribing for future updates.
CODA
Are you an agent in Portland and wonder why appraisers always do “x”?
A homeowner with questions about appraiser methodology?
If so, feel free to reach out—I enjoy connecting with market participants across Portland and the surrounding counties, and am always happy to help where I can.
And if you’re in need of appraisal services in Portland or anywhere in the Portland Region, we’d be glad to assist.
The Oregon DOJ secured a settlement with MV Realty, clearing 669 restrictive 40-year listing liens affecting homes in the Portland metro area and throughout the state.
Via Canva Pro
Major Consumer Settlement Voids Restrictive 40-Year Contracts
In a significant action benefiting homeowners across the Portland region and Oregon, the state’s Department of Justice (DOJ) has secured a settlement with Florida-based MV Realty, resolving allegations of deceptive practices involving “Homeowner Benefit Agreements” (HBAs). These controversial agreements provided property owners with a small, upfront cash payment—often only a few hundred dollars—in exchange for exclusive rights to list the home with MV Realty for a period of 40 years.
The key to the scheme’s success was its aggressive targeting. The Oregon DOJ specifically noted that the program utilized “deceptive and coercive marketing to trap Oregon homeowners”. This practice was designed to entice homeowners who needed immediate, small cash payments, trapping them in contracts that Attorney General Dan Rayfield described as “outrageous”—an attempt to hold property equity hostage for decades. Lawsuits filed by other Attorneys General across the country further confirm this was a pattern of “predatory financial product” marketing aimed at “cash-strapped homeowners” and the elderly, often for a payout that amounted to less than 0.3% of the home’s value.
The central concern for the real estate industry was the recording of memoranda of these agreements on property titles. These filings acted as encumbrances, creating a significant cloud on title that could complicate or prevent critical transactions like sales, refinances, or equity access without the homeowner paying substantial termination penalties to MV Realty. In Oregon, 669 such active agreements were in place, potentially exposing affected homeowners to over $7.9 million in combined termination fees.
Under the terms of the settlement, MV Realty was required to fully release all 669 active agreements and associated title encumbrances no later than December 5, 2025. This critical deadline ensures that affected homeowners owe no further fees to the company and regain unrestricted control over listing and property transactions.
Appraisal Implications of Title Encumbrances
Clear and marketable title is fundamental to accurate residential appraisal practice and is a prerequisite for nearly all mortgage lending in the Portland metro area. The presence of an active, restrictive lien, particularly one rooted in a predatory agreement, directly impairs the marketability and financeability of a property, thus potentially diminishing its market value.
Appraisers are tasked with evaluating the specific bundle of rights being conveyed, most commonly the Fee Simple Estate. Encumbrances like the MV Realty memoranda, if flagged, required appraisers to note exceptions and contingencies in their reports, affecting assumptions about marketability and often leading to lender rejection of the collateral. The settlement resolves this issue for properties across our service area, including Clackamas, Multnomah, and Washington counties.
Verification of Unencumbered Status
With the mandated releases complete or imminent as of this posting date, these properties across Oregon now benefit from restored clear title. However, the onus is on transactional parties to confirm the resolution.
Lenders, REALTORS, estate planners, and attorneys handling sales, refinances, or equity transfers involving previously affected properties must perform due diligence to verify the official recording of the release documents through county records. Direct confirmation of the removal of the encumbrance from the county recorder’s official files is the only definitive proof that the title is clear.
Homeowners who previously signed these agreements are strongly advised to retain documentation of the settlement and monitor their title updates closely.
For a broader perspective on how sales volume and pricing are performing in the absence of artificial marketability barriers, refer to our most recent data-driven report, the Portland Region Q3 2025 Market Update.
Thanks for reading—I hope you found a useful insight or an unexpected nugget along the way. If you enjoyed the post, please consider subscribing for future updates.
CODA
Are you an agent in Portland and wonder why appraisers always do “x”?
A homeowner with questions about appraiser methodology?
If so, feel free to reach out—I enjoy connecting with market participants across Portland and the surrounding counties, and am always happy to help where I can.
And if you’re in need of appraisal services in Portland or anywhere in the Portland Region, we’d be glad to assist.
Portland Housing Bureau releases RFP for $180,000 in East Portland grants to strengthen nonprofit capacity for housing outreach, education, and resident support amid regional affordability challenges.
Up to two awards of $90,000 each will be made for an initial one-year term, with potential renewal based on performance and funding availability. Eligible applicants include registered 501(c)(3) nonprofits focused on East Portland; other community groups or coalitions may apply with a fiscal sponsor.
Funds offer flexible support for organizational strengthening and housing-related activities, such as staff salaries, community outreach, education on housing policies, resident engagement in planning processes, leadership training, strategic planning, and equipment needs. Large-scale capital projects, real estate development, and political activities are ineligible.
Proposals should align with organizational strengths and may incorporate connections to climate resilience or environmental justice. Applications require a brief organizational overview, fund use summary, timeline, budget, and assessment approach.
Applicants new to the WebGrants system must register a profile by December 21, 2025, to allow processing time, while full proposals are due December 29, 2025. Optional informational sessions via Zoom are scheduled for December 15 (10:00–11:00 AM) and December 18 (3:00–4:00 PM), 2025. Awards will be announced January 12, 2026, with contracts starting February 2, 2026.
Appraisal Implications
Initiatives like these grants aim to enhance nonprofit capacity for outreach and resource navigation in underserved areas of the Portland metro area. For appraisers, understanding community-driven efforts to address displacement risks and improve housing access provides valuable context when evaluating neighborhood stability and long-term affordability trends in eastside submarkets.
This funding complements broader challenges in activating affordable housing resources, as discussed in yesterday’s brief on the affordable housing paradox — where 1,863 income-restricted units remain vacant amid administrative and outreach hurdles.
Market Context
The Portland region continues to grapple with affordability pressures, particularly in areas with historic underinvestment. Community capacity building may help bridge gaps in resident education and engagement, supporting more effective utilization of existing housing programs without immediate large-scale construction.
Thanks for reading—I hope you found a useful insight or an unexpected nugget along the way. If you enjoyed the post, please consider subscribing for future updates.
CODA
Are you an agent in Portland and wonder why appraisers always do “x”?
A homeowner with questions about appraiser methodology?
If so, feel free to reach out—I enjoy connecting with market participants across Portland and the surrounding counties, and am always happy to help where I can.
And if you’re in need of appraisal services in Portland or anywhere in the Portland Region, we’d be glad to assist.
Portland Skyline & Hawthorne Bridge Stock photo via Canva Pro
This week examined regulatory hurdles and supportive federal adjustments defining the Portland–Vancouver metro landscape, from stark rent cap and relocation differences favoring Washington investors in larger properties to a multistate lawsuit challenging HUD’s funding shifts. FHFA’s loan limit expansions and Portland’s code easing for denser apartments offered pathways to enhanced liquidity and infill supply in the region.
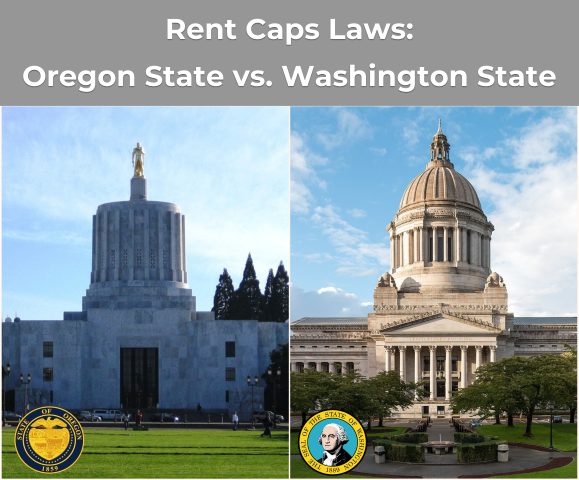
Sunday, November 30: Oregon vs. Washington Rent Caps
Via Wikimedia Commons
Cross-border differences in rent stabilization create distinct risk profiles for income property investors in the Portland–Vancouver metro area, particularly around the pivotal 4-to-5 unit threshold that shifts financing from conventional to commercial. Both states prohibit rent increases in the first year of tenancy and cap annual hikes at the lesser of 7% plus CPI or 10%, with 90-day notice requirements. Oregon mandates relocation assistance—one month’s rent—for no-cause terminations by landlords owning 5+ units statewide under ORS 90.427, while Portland overlays stricter rules under PCC 30.01.085, requiring payments of $2,900–$4,500 for increases of 10% or more, regardless of landlord size, with penalties up to three times monthly rent.
Washington imposes no statewide relocation mandate, offers exemptions for buildings under 12 years old and owner-occupied 2–4 plexes, and enforces via Attorney General fines up to $7,500. This absence of relocation costs in Washington provides a material cash-flow advantage for 5+ unit owners in Clark County, enhancing refinance eligibility and net operating income stability compared to Oregon counterparts.
For appraisers and investors in the Portland region, these rules promote tenancy predictability but elevate compliance burdens in Oregon, particularly Portland city limits, influencing vacancy allowances and income approach valuations. Properties in high-turnover areas may see dampened risks from stabilized occupancy, while cross-river opportunities in Washington accelerate value growth for newer or exempt developments.
Monday, December 1: Inherited Rental Property Challenges
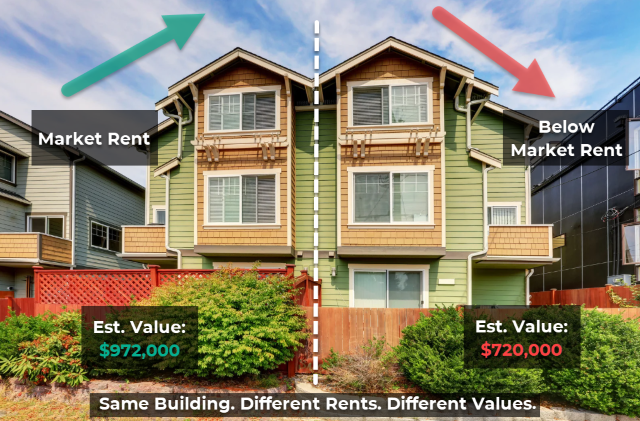
Inheriting 2–4 unit rentals in Oregon frequently involves below-market rents entrenched by statewide caps and Portland’s relocation requirements, creating significant valuation discounts that persist post-death of the original owner. The 2026 rent cap at 9.5% permits gradual increases after 12 months, but no-cause evictions are barred thereafter, and qualifying terminations trigger costs. Appraisers apply gross rent multipliers (typically 165–195 in Portland metro submarkets) to contract rents, yielding discounts of 20–40% versus market-rate scenarios—for instance, a duplex with $4,000 monthly contract rent versus $5,400 market might value at $720,000 instead of $972,000 using a GRM of 180.
Duplexes offer heirs the most flexibility, allowing termination for owner or family move-in with 90-day notice and often exempt from Portland relocation fees if occupying as primary residence. Triplexes and fourplexes face higher barriers, requiring full payments of $4,200+ per unit, often leaving low NOI intact indefinitely. A recent North Portland fourplex sale at $768,000 reflected a 12–14% discount tied to below-market tenancies of $58,026 annual income versus projected $66,120.
In the Portland metro area, this “locked-in tenancy discount” complicates estate planning and probate appraisals, urging documentation of both contract and market rents. Stable cash flow from existing tenants may represent highest and best use, avoiding costly resets—Certified Residential appraisers must carefully scope assignments to reflect these regulatory constraints accurately.
Oregon and Washington joined a coalition of approximately 20 other states in suing HUD over FY 2026 changes to the $3.9 billion Continuum of Care program, capping permanent supportive housing at 30%—down from nearly 90%—while adding service mandates and anti-camping enforcement penalties. This risks a $39 million loss for Oregon and significant cuts to Washington’s $120 million annual grants, much supporting Portland-adjacent counties like Multnomah and Clark. Nationwide, up to 170,000 households face displacement, undermining Housing First models prevalent in the Pacific Northwest.
The lawsuit, filed November 25, 2025, alleges violations of Congressional intent and the Administrative Procedure Act by bypassing proper rulemaking. Local supplements like Metro’s Supportive Housing Services Measure cannot fully replace federal funds.
For the Portland metro region, reduced grants could increase unsubsidized rental demand, pressuring rents and entry-level prices while introducing NOI volatility for subsidy-dependent properties. Appraisers evaluating LIHTC or supportive housing must monitor neighborhood stability and cap rate shifts, as funding instability may alter highest and best use analyses.
Wednesday, December 3: 2026 Conforming Loan Limit Increase
Constitution Center (400 7th Street SW, Washington, D.C.) – headquarters of the Federal Housing Finance Agency (FHFA). Photo: Ajay Suresh via Wikimedia Commons (CC BY 2.0)
FHFA announced the 2026 baseline conforming loan limit at $832,750 for one-unit properties, a $26,250 increase reflecting 3.26% house price growth. In the Portland–Vancouver MSA, this shifts loans up to the new threshold into lower-rate conventional financing from Fannie Mae and Freddie Mac.
Q3 2025 data showed 99 sales between the old $806,500 limit and new figure, averaging $820,864 closing price with 49-day market time—70 conventionally financed now fully conforming. Overall, 85.48% of 4,682 single-family closings fell under $900,000, with 367 in the $800,000–$899,999 band.
This adjustment eases qualification in mid-to-upper tiers for Portland region buyers and investors, reducing jumbo loan friction and supporting market stability where most activity remains conforming-eligible.
Thursday, December 4: Modest National Home Sales Gains
Portland Oregon skyline at dusk. Photo: Razvan Orendovici via Wikimedia Commons (CC BY 2.0)
October 2025 delivered subtle national improvements, with existing-home sales rising 1.2% month-over-month to a 4.10 million-unit annual rate (up 1.7% year-over-year) and pending sales up 1.9%. Median price reached $415,200 (up 2.1% year-over-year), against 1.52 million units inventory (4.4 months’ supply, up 10.9% annually). Rates around 6.25% supported activity amid regional variances—the West lagged with pending sales down 1.5% monthly and 7.0% annually, median at $628,500.
Portland’s Q3 single-family median held at $600,000, below the West but above national, framing local performance in a high-cost context with decelerating growth.
These trends provide appraisers in the Portland metro area broader stability signals, informing valuations amid affordability constraints and inventory buildup.
Friday, December 5: Multifamily Loan Purchase Caps Raised
Modern multifamily building in Portland Stock photo via Canva Pro
FHFA increased 2026 multifamily loan purchase caps to a combined $176 billion—up over 20% from 2025—as a floor to maintain liquidity amid maturing debt and construction slowdowns exceeding 50%. At least 50% must be mission-driven affordable housing, including LIHTC or rural projects, with workforce units (80–120% AMI, 10-year restrictions) exempt and counting toward thresholds if 20% qualify.
In the Portland metro, facing 5.5–7.5% vacancy rates, this bolsters refinancing in submarkets like Vancouver and Beaverton, stabilizing cap rates against rent cap headwinds. It supports rental supply essential for easing single-family pressure, enhancing GRMs for 1–4 unit appraisals and marketability of workforce housing.
Investors gain reliable capital for commercial multifamily; appraisers benefit from reduced NOI volatility in a shortage-prone region.
Saturday, December 6: Single-Exit Four-Story Apartment Code Easing
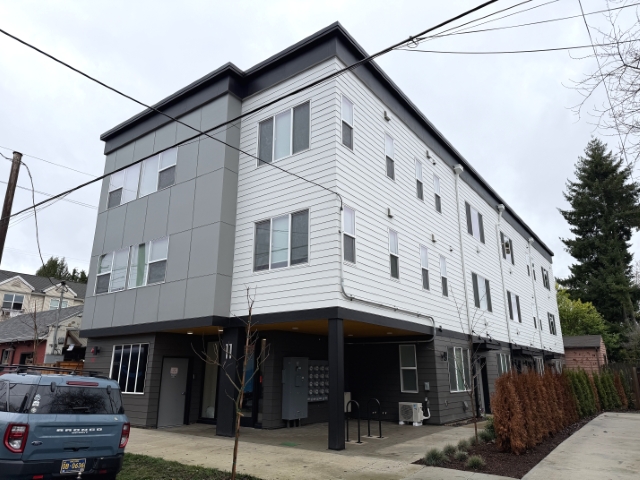
Three-story, 16-unit apartment building on a 5,000 sq ft lot—an early example of the infill density now fully achievable in Portland’s RM1 and RM2 zones under current zoning and the 2025 single-exit stairwell provisions 11 NE 55th Ave, Portland, Oregon – December 2025 Photo: Abdur Abdul-Malik, Certified Residential Appraiser
Portland’s Building Code Guide 25–10, approved October 22, 2025, permits single-exit stairwells in four-story apartments under the 2025 Oregon Structural Specialty Code, slashing circulation space to 6.5% from 13–16% and enabling denser infill in RM1/RM2 zones with no maximum unit limits (minimums: RM1 at 1 per 2,500 sq ft; RM2 at 1 per 1,450 sq ft). An example at 11 NE 55th Ave—a three-story 16-unit building on a 5,000 sq ft lot (land sold for $650,000)—demonstrates pro forma value exceeding $3.3 million at a 5.17% cap rate with $256,005 annual income.
This shifts highest and best use toward multifamily on small lots, lifting land values and accelerating medium-density housing amid shortages. Adjacent single-family properties now warrant demolition analyses for redevelopment potential.
Certified Residential appraisers must take this seriously—the increased density often exceeds four units, rendering many RM1/RM2 assignments out-of-scope and requiring Certified General expertise. Concluding four or fewer units as highest and best use risks incomplete analyses if pro formas support higher counts, potentially violating USPAP scope requirements in transitional zones.
Rent regulation disparities and HUD funding threats underscored valuation pressures on rentals and affordability in the Portland region, countered by FHFA’s expansive financing and local code relaxations promoting supply. National trends added modest context to these evolving dynamics.
Changes to Portland’s building code has made for more challenging valuations of sites in transitional zones (RM1/RM2)—certified residential appraisers will need to be particularly careful appraising properties in such zones as they will very likely require analysis only a certified general appraiser is licensed to do.
Thanks for reading—I hope you found a useful insight or an unexpected nugget along the way. If you enjoyed the post, please consider subscribing for future updates.
Question: With code changes opening denser multifamily and FHFA boosting financing, how might these influence your approach to assignments in Portland’s transitional zones?
CODA
Are you an agent in Portland and wonder why appraisers always do “x”?
A homeowner with questions about appraiser methodology?
If so, feel free to reach out—I enjoy connecting with market participants across Portland and the surrounding counties, and am always happy to help where I can.
And if you’re in need of appraisal services in Portland or anywhere in the Portland Region, we’d be glad to assist.
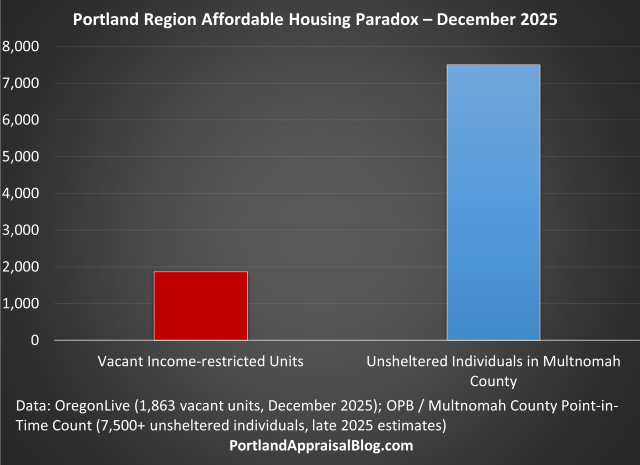
Portland’s inclusionary zoning is producing units, but 1,863 income-restricted apartments remain vacant amid funding cuts and administrative delays—creating measurable valuation risk for residential and multifamily professionals.
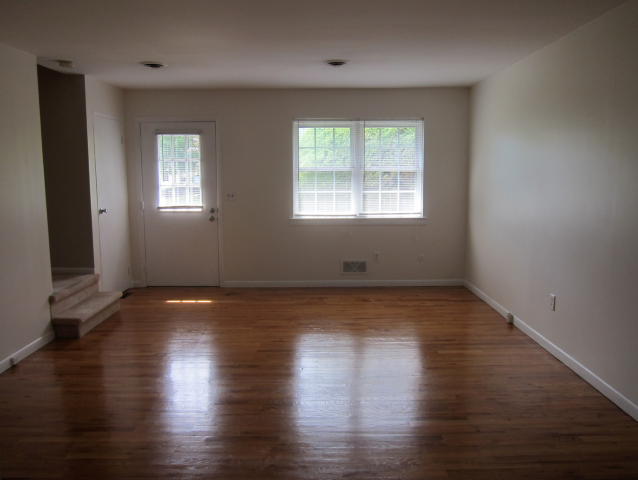
Empty interior of an income-restricted apartment unit in Portland, symbolizing the region’s persistent vacancies in affordable housing programs Via Canva Pro
Policy Wins Collide With Activation Barriers
Portland’s affordable housing programs are delivering a classic paradox: policy mechanisms are finally producing new income-restricted units, yet nearly 1,900 completed apartments—representing a 7.4% vacancy rate across the region’s 25,409 subsidized units—sit empty while homelessness continues to climb.
The city’s inclusionary zoning program, which requires or incentivizes developers to reserve a portion of new units for households earning 60% or less of area median income (AMI)—where the FY 2025 median family income for a 4-person household in the Portland-Vancouver-Hillsboro OR-WA MSA is $124,100—has shown measurable improvement in actual unit production after years of refinement. This is a hard-won policy success in a market that has long struggled to integrate affordability into private development.
These gains, however, are being undermined by systemic activation challenges. Home Forward, Multnomah County’s primary administrator of subsidized housing and the Housing Choice Voucher (Section 8) program, faces a $35 million budget shortfall that includes a $14 million cut in federal voucher funding. The agency has paused new voucher issuances, eliminated at least 12 positions, and extended waitlists that already see roughly seven applications for every opening.
Providers cite a combination of administrative delays, rising operational costs, higher post-pandemic eviction rates, and narrowing rent gaps (42% of metro units are now within 10% of market rent) as the main drivers of prolonged vacancies. As Reach Community Development’s executive director noted, “even affordable rents are too high” for many eligible households without deeper subsidies.
Mayor Keith Wilson has explicitly linked these activation failures to the region’s homelessness crisis. Although 890 of a targeted 1,500 new low-barrier shelter beds are now open, many operate at just over 50% occupancy—compared with 87% at existing 24-hour shelters—because permanent housing remains the preferred exit. With more than 7,500 individuals unsheltered in Multnomah County (up over 1,000 since January 2025) and monthly inflows of ~1,400 people outpacing permanent placements of ~1,100, the region continues to see a net increase in homelessness.
Appraisal Implications
These activation failures translate directly into valuation and underwriting risk for professionals across the Portland metro area.
Residential Properties
Inclusionary zoning covenants create deed-restricted comparables that must be segregated from market-rate sales. As the program matures, appraisers in Multnomah, Clackamas, Washington, Columbia, Yamhill, and Clark counties will see a growing volume of these restricted transactions, especially in newer condominium and mixed-use projects—though the highest concentration remains within the City of Portland’s jurisdiction in Multnomah County. With the Q3 2025 median price for detached single-family homes in the region at approximately $600,000—as noted in our Q3 2025 Portland region market update—the gap between market-rate ownership and income-restricted pricing remains stark.
Multifamily and Investment Properties
The 1,863 vacant income-restricted units create an immediate drag on potential gross income and stabilized net operating income (NOI). Projects financed through Low-Income Housing Tax Credits (LIHTC) or subject to inclusionary requirements now face extended lease-up periods—often months rather than weeks—due to public-agency bottlenecks. Recent FHFA increases to 2026 multifamily loan purchase caps may encourage new supply, but activation risks remain a key variable.
Appraisers using the income approach should give heightened scrutiny to:
Vacancy allowances (increase for policy-induced vacancy)
Capitalization rates (higher risk typically justifies higher cap rates)
Lenders and investors underwriting affordable or mixed-income developments must incorporate longer stabilization horizons and potential LIHTC compliance risks into their models.
Market Context
When finished apartments remain offline, the housing-homelessness pipeline stalls, forcing greater reliance on temporary shelter systems even as permanent supply begins to grow.
Resolving this paradox will require targeted investment in administrative capacity and deeper subsidy layers to match completed units with the households who need them most.
Sources & Further Reading
Nearly 1,900 affordable Portland apartments sit empty (OregonLive)
Portland’s Inclusionary Zoning Program Is Finally Performing (Sightline Institute)
Thanks for reading—I hope you found a useful insight or an unexpected nugget along the way. If you enjoyed the post, please consider subscribing for future updates.
CODA
Are you an agent in Portland and wonder why appraisers always do “x”?
A homeowner with questions about appraiser methodology?
If so, feel free to reach out—I enjoy connecting with market participants across Portland and the surrounding counties, and am always happy to help where I can.
And if you’re in need of appraisal services in Portland or anywhere in the Portland Region, we’d be glad to assist.


.jpg)