Portland Real Estate Appraisal Brief – Monday, December 1, 2025: How Oregon Rent Caps and Eviction Rules Impact Inherited Rental Properties

Oregon’s 9.5% rent cap for 2026 combines with Portland’s relocation assistance rules, creating distinct valuation considerations for rental properties across the metro area.

House depicted sitting on a stack of $1 bills. Used to illustrate inheritance of a home.

When I appraise 2–4 unit residential income properties in the Portland metro area for estate, trust, or probate purposes, the single largest value depressant is almost always a long-term tenant paying far below-market rent. Oregon’s statewide rent-stabilization law and Portland’s additional relocation-assistance requirements combine to make it expensive and slow for heirs to reset those rents after the original landlord passes away.

How Below-Market Rents Survive Inheritance

Oregon law limits rent increases to once every 12 months and caps the allowable increase at 7% plus the Consumer Price Index (CPI), with an overall hard cap of 10%. For calendar year 2026, this limit is 9.5%. Certain units—such as regulated affordable housing and buildings less than 15 years old—are exempt. No-cause evictions are prohibited after the tenant’s first year of occupancy.

Many inheritors lack the cash or desire to front relocation fees and perform renovations, so the low-rent tenancy often remains in place for years. (I go into more detail in my discussion of Oregon rent control laws and the overlays the City of Portland adds.)

Appraisal Impact: Contract Rent vs. Market Rent

In the income approach for 2–4 unit residential properties, appraisers derive a gross rent multiplier (GRM) by dividing comparable sales prices by their monthly (or annual) scheduled rents, typically resulting in a three-digit figure (e.g., 165–195 in most Portland metro submarkets at present). Appraisers may also cross-check conclusions with a direct capitalization approach when income and expense data are reliable.

That GRM is then applied to the subject property’s actual contract rent. When contract rent lags 20–40% behind market—a common range in inherited portfolios— the indicated value is often proportionally lower than the same property delivered vacant or at market rent.

Example: A duplex with market rent of $2,700 per side ($5,400/month total, $64,800/year) but current contract rent of $2,000 per side ($4,000/month total, $48,000/year) and a reconciled GRM of 180 yields:

  • Market-rent value: $5,400 × 180 = $972,000
  • Contract-rent value: $4,000 × 180 = $720,000
  • Result: $972,000 – $720,000 = $252,000 → Difference of approximately 26% solely due to the locked-in tenancy.
Graphic depicting a duplex. On one side a green up arrow depicts market rent and an estimated value of $972,000. On the other side a red arrow pointing down depicts below market rent and an estimate of $720,000.

For a real-world illustration, consider a recent North Portland fourplex sale from 2024. This 1966-built property sold for $768,000 with actual gross scheduled income of $58,026 annually ($4,835 monthly average across four 2-bedroom units on month-to-month leases). The listing projected $66,120 in gross income—a 14% increase—highlighting below-market rents with “opportunity for growth.” Using the market-derived monthly GRM of approximately 159 (consistent with the listing’s implied metrics), the contract-rent value aligns with the sale price, while the projected rents suggest a potential value around $875,000, representing a 12–14% discount due to the existing tenancies and regulatory hurdles to realizing that upside.

RMLS multifamily listings display scheduled rents in the public fields, and confidential remarks may note “long-term tenants – below-market rents” as an upfront acknowledgement to a potential purchaser. Savvy buyers and appraisers run the numbers immediately and adjust offers (and appraised values) accordingly.

The Challenge Scales with Unit Count

  • Duplexes remain the most manageable. Under Oregon law, a new owner or an immediate family member moving in is a “Qualifying Landlord Reason” for termination. This creates a realistic path to market rent within 12–18 months. Crucially, Portland’s mandatory relocation assistance is generally NOT required if the new owner occupies one unit of a duplex as their primary residence and terminates the tenancy of the second unit. This key exception significantly lowers the cost and risk of resetting the rent on a duplex in the city.
  • Triplexes and fourplexes are far harder. While an owner or immediate family member can still reclaim a unit (or units) in a triplex or fourplex for occupancy, this move-in termination does trigger the full Portland relocation assistance payment for each unit vacated. The cost of reclaiming multiple units often becomes the practical—and high-cost statutory—constraint. As a result, at least one protected tenant and their below-market rent often remains in place, sometimes indefinitely.
Regulatory ScenarioDuplex (Owner-Occupied)Triplex / Fourplex
State Law Termination (Owner Move-In)Allowed (with 90-day notice)Allowed (with 90-day notice)
Portland Relocation Fee Required?NO (Exempt under PCC 30.01.085.G.3)YES (Full fees apply)
Cost to Recoup 1 UnitMinimal (Time/Legal fees)$4,200 – $4,500+ (plus legal fees)

Practical Guidance for Heirs and Estate Professionals

Inherited small income properties with long-term, below-market tenants routinely trade at meaningful discounts to physically identical buildings that are vacant or leased at market rates. The regulatory environment creates a durable “locked-in tenancy discount” that survives the death of the original landlord.

Appraisers must document both contract and market rent, then apply the market-derived GRM to the realistic income stream the property actually produces under current law. Understanding this dynamic early avoids surprise when the date-of-death value comes in lower than expected.

In many cases, keeping the stable tenant and modest cash flow is the path of least resistance—and still the highest and best use. Rents can be gradually raised each year until all units are in alignment with the rest of the market, provided increases comply with the annual cap and notice requirements; in Portland, certain increases trigger relocation assistance.

If you are an estate planning attorney, personal representative, or heir handling a 2–4 unit rental in Multnomah, Washington, Clackamas, Yamhill, Columbia, or Hood River counties, reach out. These scenarios are a routine part of my practice.

Sources & Further Reading

  • PortlandAppraisalBlog discussion on Oregon 2026 Rent Cap: Post
  • PortlandAppraisalBlog discussion on Oregon Rent Laws vs. Portland’s Tenant Protections: Post
  • Oregon Residential Landlord and Tenant Act (full chapter): ORS Chapter 90
  • Rent Increase Limits & Notice Requirements: ORS 90.323
  • Annual Rent Cap Calculation: ORS 90.324
  • Termination of Tenancy without Tenant Cause: ORS 90.427
  • Portland Renter Additional Protections (City Code 30.01.085): Official City Page
  • Portland Mandatory Relocation Assistance Brochure (PDF): Download
  • Portland Housing Bureau Relocation Rules & Exemption Form: HOU-3.05
  • Oregon Law Help – Eviction & Termination Notices: Guide

Thanks for reading—I hope you found a useful insight or an unexpected nugget along the way. If you enjoyed the post, please consider subscribing for future updates.

Question: How have the current rent control laws affected your portfolio?

Coda

Are you an agent in Portland who wonders why appraisers always do “x”?

A homeowner with questions about appraiser methodology?

If so, feel free to reach out—I enjoy connecting with market participants across Portland and the surrounding counties, and am always happy to help where I can.

And if you’re in need of appraisal services in Portland or anywhere in the Portland Region, we’d be glad to assist.

About the Author — Abdur Abdul‑Malik, SRA, ASA

Abdur Abdul‑Malik is the founder, author, and publisher of the Portland Appraisal Blog, where he produces original regional and neighborhood‑level housing analytics for the Portland Region. He is a certified residential appraiser serving Oregon and Washington, drawing on RMLS transaction data, public records, and custom segmentation models he has built.

He developed the Portland Appraisal Blog Affordability Index (PABAI), a payment‑based affordability metric built from actual RMLS sales. PABAI incorporates weekly updates based on the prevailing 30‑year fixed mortgage rate, providing a locally grounded measure of housing affordability across the region.

Learn more → PABAI explainermortgage rate seriesfull author bio

Portland Real Estate Supplemental Appraisal Brief – Sunday, November 30, 2025: Oregon vs. Washington Rent Caps for Income Properties

Oregon vs Washington rent cap and relocation rules create sharply different risk profiles for 1–4 unit (conventional) and 5+ unit (commercial) investors in the Portland and Vancouver metro areas.

Oregon State Capitol vs. Washington State Capitol illustrating differing rent cap laws for Portland and Vancouver metro income property investors
Via Wikimedia Commons

Why This Matters

In the Portland–Vancouver metro, rent regulations directly shape cash‑flow stability, refinance eligibility, and valuation. Appraisers rely on predictable rental streams for income approach comparables, while lenders model risk differently across state lines. For investors, the 4‑to‑5 unit threshold is pivotal: properties with 1–4 units typically qualify for conventional Fannie Mae/Freddie Mac financing, while 5+ unit buildings fall into commercial lending. Because rent‑cap rules and relocation‑assistance exposure diverge sharply at this threshold, understanding the cross‑border distinctions is critical before acquiring or refinancing multifamily assets.

Oregon Statewide Framework (ORS Chapter 90, SB 611)

  • No rent increase permitted during the first 12 months of tenancy
  • Cap: 7% + CPI (West Region), maximum 10% annually
  • Notice: 90‑day written notice required for any increase
  • Relocation assistance: applies only if landlord owns 5+ units statewide
    – One month’s rent paid to tenant for no‑cause terminations (ORS 90.427)
  • Exemption: units with certificates of occupancy issued within the prior 15 years

Portland City‑Specific Rules (PCC 30.01.085 – effective Jan 1, 2025)

  • Applies regardless of landlord unit count
  • Portland City‑Specific Rules (PCC 30.01.085 – effective Jan 1, 2025)
  • Applies regardless of landlord unit count
  • Any increase ≥5% in a rolling 12‑month period requires 90‑day notice
  • Increases ≥10% give tenants the right to terminate with reduced notice and receive mandatory relocation assistance
    – $2,900 studio/SRO
    – $3,300 1‑bed
    – $4,200 2‑bed
    – $4,500 3+ bed
  • Exemptions require advance approval from the Portland Housing Bureau (e.g., week‑to‑week tenancies, owner‑occupied duplexes)
  • Enforcement: non‑compliant landlords face liability for up to 3× monthly rent, damages, and attorney fees

Washington Statewide Stabilization (HB 1217 – signed May 2025)

  • No rent increase in the first 12 months
  • Cap: lower of 7% + CPI or 10% through Dec 31, 2025
  • Manufactured homes: 5% cap
  • Notice: 90 days for residential units; 180 days for mobile‑home parks
  • Relocation assistance: no statewide mandate (though RCW 59.18.440 allows local governments to adopt programs)
  • Exemptions:
    – New construction (<12 years old)
    – Nonprofit affordable housing
    – Owner‑occupied 2–4 plexes
  • Enforcement: Washington Attorney General; penalties up to $7,500 per violation. August 2025 saw inaugural fines against landlords for unlawful increases.

Key Investor Takeaways

  • 1–4 unit owners: favorable treatment in both states; no mandatory relocation payments (except inside Portland city limits, where PCC 30.01.085 applies)
  • 5+ unit owners: Oregon relocation exposure (one month’s rent on no‑cause moves); Portland relocation exposure even for small landlords if increases ≥10%; Washington no statewide relocation mandate, creating a material cash‑flow difference across the Columbia River

Comparison Table

IssueOregon StatewidePortland (overlay)Wash. HB 1217Impact 1–4 UnitsImpact 5+ Units
First-year increase allowed?NoNoNoSame both statesSame both states
Rent cap (2025)7% + CPI ≤10%Same statewide cap≤10% (5% Mobile/
Manufact.
parks)
Effectively identicalEffectively identical
Relocation assistance required?Only if landlord owns 5+ unitsYes on ≥10% increase or qualifying no-causeNone statewidePortland exceptionOregon yes / WA no
New build exempt15 yearsSame12 yearsWA slightly shorterWA slightly shorter
Owner-occupied 2–4 plex exempt?NoPossible with PHB approvalYesWA more favorableWA more favorable

Regional Implications for Appraisals

  • Both states prohibit first‑year increases and require ample notice, promoting predictability in rental streams.
  • Oregon’s relocation rules (especially Portland’s) stabilize occupancy in high‑turnover areas, dampening vacancy risk.
  • Washington’s broader exemptions favor newer developments, potentially accelerating value growth in Clark County compared to Oregon’s focus on small‑landlord relief.
  • Enforcement differences matter: Oregon emphasizes tenant remedies via damages, while Washington’s AG fines signal robust compliance.

Further Reading & Resources

  • Oregon Revised Statutes Chapter 90 – Residential Landlord and Tenant: 2023 Edition
  • ORS 90.427 – Termination of tenancy without tenant cause (relocation assistance): ORS 90.427
  • Oregon Law Help – Eviction & Termination Notices: Guide
  • Portland Renter Additional Protections (City Code 30.01.085): Official City Page
  • Portland Mandatory Relocation Assistance Brochure (PDF): Download
  • Portland Housing Bureau Relocation Rules & Exemption Form: HOU-3.05
  • Washington HB 1217 – Rent Stabilization: 2025 legislation
  • Washington Residential Landlord-Tenant Act: RCW 59.18
  • Washington Attorney General: File a Tenant Complaint

Decorative text divider

Thanks for reading—I hope you found a useful insight or an unexpected nugget along the way. If you enjoyed the post, please consider subscribing for future updates.

Question: Do you think other states will follow Oregon’s and Washington’s rent control laws?

Coda

Are you an agent in Portland who wonders why appraisers always do “x”?

A homeowner with questions about appraiser methodology?

If so, feel free to reach out—I enjoy connecting with market participants across Portland and the surrounding counties, and am always happy to help where I can.

And if you’re in need of appraisal services in Portland or anywhere in the Portland Region, we’d be glad to assist.

About the Author — Abdur Abdul‑Malik, SRA, ASA

Abdur Abdul‑Malik is the founder, author, and publisher of the Portland Appraisal Blog, where he produces original regional and neighborhood‑level housing analytics for the Portland Region. He is a certified residential appraiser serving Oregon and Washington, drawing on RMLS transaction data, public records, and custom segmentation models he has built.

He developed the Portland Appraisal Blog Affordability Index (PABAI), a payment‑based affordability metric built from actual RMLS sales. PABAI incorporates weekly updates based on the prevailing 30‑year fixed mortgage rate, providing a locally grounded measure of housing affordability across the region.

Learn more → PABAI explainermortgage rate seriesfull author bio

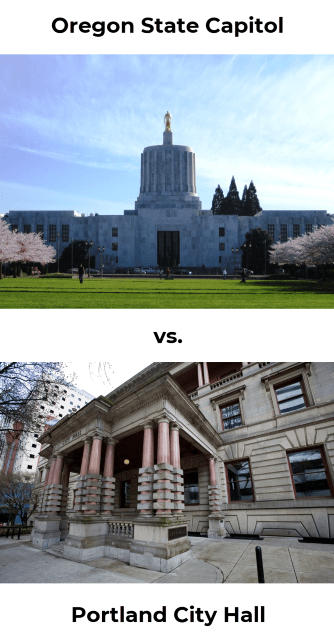
Portland Real Estate Appraisal Brief – Sunday, November 30, 2025: Oregon Rent Laws vs. Portland’s Tenant Protections

Oregon’s 9.5% rent cap for 2026 combines with Portland’s relocation assistance rules, creating distinct valuation considerations for rental properties across the metro area.

Via Wikimedia Commons

Oregon’s statewide rent stabilization framework under the Residential Landlord and Tenant Act provides a uniform baseline for rental increases and evictions across the state, including the Portland metro area. Oregon was the first U.S. state to enact comprehensive statewide rent control in 2019 (via Senate Bill 608), followed by California later that year (via AB 1482) and Washington in May 2025 (via HB 1217). These statutes establish annual limits on rent increases for most residential properties, with exemptions for new construction and certain subsidized housing. However, within the city limits of Portland, local ordinances add layers of tenant protections that require relocation assistance for certain terminations and rent hikes. As a certified residential appraiser serving homeowners, lenders, realtors, estate planners, and attorneys in the region, understanding these distinctions is crucial for accurate property valuations, especially for income-producing rentals where regulatory constraints directly influence projected cash flows and market discounts.

Key provisions include rent increase limits under ORS 90.323 and their annual calculation under ORS 90.324.

Statewide Rent Stabilization and Eviction Basics

Under ORS 90.323, landlords cannot raise rent during the first year of tenancy or more than once every 12 months thereafter. The maximum allowable increase for calendar year 2026 is capped at 9.5%. Violations expose landlords to liability for three months’ rent plus actual damages.

Just-cause eviction requirements under ORS 90.427 prohibit no-cause terminations after the first year. Qualifying landlord reasons (major remodel, owner/family move-in, etc.) still require proper notice and, in some cases, one month’s rent as assistance. Exemptions from these protections include units less than 15 years old from the date of the certificate of occupancy, federally subsidized or regulated affordable housing (where the tenant’s portion does not rise or the increase is program-mandated), owner-occupied duplexes or triplexes (where the landlord resides in one unit), and certain short-term rentals.

Portland’s Local Overlay: Enhanced Relocation Assistance

Portland builds on these state protections through City Code 30.01.085 – the Renter Additional Protections ordinance. The city applies Oregon’s statewide cap but adds relocation assistance obligations when rent increases reach 10% or more (for units otherwise exempt from the statewide cap, such as newer construction or subsidized housing). Relocation assistance is also required for:

  • Non-renewal of fixed-term leases
  • Qualifying landlord reasons under state law
  • Substantial changes to lease terms beyond rent or utilities

Payments (due 45 days before termination or within 31 days of tenant request) are scaled by unit size:

  • $2,900 (studio/SRO)
  • $3,300 (1-bedroom)
  • $4,200 (2-bedroom)
  • $4,500+ (3+ bedrooms)

Landlords must file exemption forms with the Portland Housing Bureau when applicable and notify the Bureau of payments within 30 days.

Valuation Implications for the Portland Metro Area

For estate planners and attorneys handling inherited rentals, these combined rules often lock in below-market tenancies. Homeowners converting properties to rentals must project income conservatively. Realtors listing income properties typically disclose scheduled rents via RMLS. A listed property with units significantly below market rent levels may receive low offers and usually sells at a substantial discount.

Lenders benefit from reduced turnover risk but must recognize higher operating costs inside Portland city limits. For appraisers, the dual framework means statewide rent caps set the ceiling, while Portland’s relocation obligations add another layer of financial consideration.

Geographic Scope

Oregon’s statewide rules apply in the Portland Region (Columbia, Clackamas, Hood River, Multnomah, Washington, and Yamhill Counties). Portland’s relocation overlay is city-specific. Properties in the Vancouver Region (Clark, Cowlitz, Klickitat, and Skamania Counties) fall under Washington’s separate statewide stabilization law (enacted May 2025), which exempts new construction for 10 years and caps annual increases at 7% + inflation, not to exceed 10%.

Further Reading & Resources

  • Oregon Residential Landlord and Tenant Act (full chapter): ORS Chapter 90
  • Rent Increase Limits & Notice Requirements: ORS 90.323
  • Annual Rent Cap Calculation: ORS 90.324
  • Termination of Tenancy without Tenant Cause: ORS 90.427
  • Portland Renter Additional Protections (City Code 30.01.085): Official City Page
  • Portland Mandatory Relocation Assistance Brochure (PDF): Download
  • Portland Housing Bureau Relocation Rules & Exemption Form: HOU-3.05
  • Oregon Law Help – Eviction & Termination Notices: Guide
  • Oregon Senate Bill 608: PDF
  • California AB 1482
  • Washington HB 1217

Thanks for reading—I hope you found a useful insight or an unexpected nugget along the way. If you enjoyed the post, please consider subscribing for future updates.

Question: Do you think other cities in Oregon will add relocation assistance provisions?

Coda

Are you an agent in Portland who wonders why appraisers always do “x”?

A homeowner with questions about appraiser methodology?

If so, feel free to reach out—I enjoy connecting with market participants across Portland and the surrounding counties, and am always happy to help where I can.

And if you’re in need of appraisal services in Portland or anywhere in the Portland Region, we’d be glad to assist.

About the Author — Abdur Abdul‑Malik, SRA, ASA

Abdur Abdul‑Malik is the founder, author, and publisher of the Portland Appraisal Blog, where he produces original regional and neighborhood‑level housing analytics for the Portland Region. He is a certified residential appraiser serving Oregon and Washington, drawing on RMLS transaction data, public records, and custom segmentation models he has built.

He developed the Portland Appraisal Blog Affordability Index (PABAI), a payment‑based affordability metric built from actual RMLS sales. PABAI incorporates weekly updates based on the prevailing 30‑year fixed mortgage rate, providing a locally grounded measure of housing affordability across the region.

Learn more → PABAI explainermortgage rate seriesfull author bio

Portland Real Estate Appraisal Brief – Saturday, November 29, 2025: Oregon Sets 2026 Rent Cap at 9.5%

Oregon’s 2026 rent cap is set at 9.5%. See the key details and implications of this policy for Portland metro rental valuations, property owners, and investment strategies.

Portland appraisal brief graphic for Oregon 2026 9.5% rent cap official announcement.

The Oregon Department of Administrative Services (DAS) has released the official rent stabilization percentages for 2026, offering clarity for landlords, tenants, and housing professionals statewide. As a certified residential appraiser serving the Portland metro area, I track these updates closely because they influence rental market dynamics, which in turn affect property valuations for homeowners, lenders, realtors, estate planners, and attorneys.

This annual adjustment, governed by ORS 90.323 (maximum rent increase) and ORS 90.324 (calculation and publication), ensures rent increases align with inflation while offering predictability in a volatile housing market. Published on September 30, 2025, the announcement ties directly to the state’s rent control measures enacted to protect tenants from excessive hikes.

For most residential tenancies in the Portland region, the maximum allowable rent increase will be 9.5% starting January 1, 2026. This figure represents the lesser of 10% or 7% plus the Consumer Price Index for All Urban Consumers (CPI‑U) for the West Region, All Items, based on data from the previous 12 months. The calculation reflects a measured response to rising living costs, down slightly from the 10.0% cap in 2025.

Key Details on the 2026 Rent Cap

Understanding the nuances of this cap is essential for anyone involved in residential leasing or valuation in Oregon. The 9.5% limit applies broadly to tenancies under ORS 90.323, which covers most single‑family homes, apartments, and multifamily units in the region. Landlords must provide at least 90 days’ written notice for any increase up to this threshold, and the cap applies per 12-month period and increases may only be given once in any 12-month period.

Exemptions and special cases:

  • Smaller facilities (≤30 spaces): Manufactured dwelling parks or marinas follow the same formula—10% or 7% + CPI (9.5% in 2026).
  • Larger facilities (>30 spaces): Parks or marinas face a stricter 6% maximum increase under ORS 90.600.
  • Exclusions: New tenancies in the first year, fixed‑term leases without renewal, and exempt properties (e.g., subsidized housing). Utilities and fees may rise separately from base rent.

These provisions help maintain stability in the Portland metro area’s rental landscape, where median asking rents have hovered near $1,987 for a two‑bedroom unit according to RentCafe’s Portland rental market report (Nov 2025). Zillow places the overall average asking rent across unit types at $1,772 (Zillow Portland Rental Market; snapshot date 11/28/2025). Neighborhood‑level data shows two‑bedroom rents ranging from $1,800 to $2,400, underscoring the variability across the metro.

For appraisers, knowing the precise rent cap helps model the timeline required to bring a property or multifamily project back to market rents, especially when current leases are below prevailing rates. This allows for more accurate income projections.

Implications for Portland Metro Property Owners and Professionals

  • Homeowners: Must factor the 9.5% ceiling into rental conversion ROI, especially when evaluating single‑family properties for lease. The cap limits upside potential in a demand‑heavy market and affects long‑term income projections.
  • Realtors: Benefit from being able to project realistic rental growth figures in listings, particularly for multifamily properties (2+ units). The cap provides a clear ceiling for annual rent increases, which helps set buyer expectations and avoid overpromising future income.
  • Lenders: Gain greater clarity into a property’s income potential, allowing for more accurate underwriting and valuation.
  • Investors: Stay aligned with prevailing market rates while complying with legal pacing. For multifamily portfolios, knowing the exact rent cap helps plan staggered increases and avoid underperformance due to below-market rents.

Sources & Further Reading

Thanks for reading—I hope you found a useful insight or an unexpected nugget along the way. If you enjoyed the post, please consider subscribing for future updates.

Question: Do you think the annual cap will ever drop significantly, or will persistent inflation keep the annual increase at about 10%?

Coda

Are you an agent in Portland who wonders why appraisers always do “x”?

A homeowner with questions about appraiser methodology?

If so, feel free to reach out—I enjoy connecting with market participants across Portland and the surrounding counties, and am always happy to help where I can.

And if you’re in need of appraisal services in Portland or anywhere in the Portland Region, we’d be glad to assist.

About the Author — Abdur Abdul‑Malik, SRA, ASA

Abdur Abdul‑Malik is the founder, author, and publisher of the Portland Appraisal Blog, where he produces original regional and neighborhood‑level housing analytics for the Portland Region. He is a certified residential appraiser serving Oregon and Washington, drawing on RMLS transaction data, public records, and custom segmentation models he has built.

He developed the Portland Appraisal Blog Affordability Index (PABAI), a payment‑based affordability metric built from actual RMLS sales. PABAI incorporates weekly updates based on the prevailing 30‑year fixed mortgage rate, providing a locally grounded measure of housing affordability across the region.

Learn more → PABAI explainermortgage rate seriesfull author bio

Portland Real Estate Appraisal Brief – Friday, November 28, 2025: FHFA Q3 2025 House Price Index: National Trends, Oregon Context, and the Role of Appraisers

FHFA Q3 2025 HPI: U.S. +2.2% YoY, Oregon +0.31%, Portland MSA +1.51% — appraisal insights and practical implications for Portland appraisers and lenders.

National Overview & Oregon Statewide Performance

On November 25th, the Federal Housing Finance Agency (FHFA) released its Q3 2025 House Price Index (HPI). Nationally, home prices rose 0.2% quarter‑over‑quarter, and 2.2% year‑over‑year, reflecting a cooling but still positive trajectory across most regions.

Oregon posted +0.31% annual appreciation, ranking 45th nationally, with a –0.16% quarterly decline. These subdued figures mirror the broader West Coast trend: Washington registered +1.37% YoY, while California slipped –0.62% YoY. Oregon’s modest growth reflects a market in balance—neither surging nor contracting sharply.

Map showing Four-Quarter House Price Change by State.

Source: FHFA

Portland-Vancouver-Hillsboro MSA

In the “Purchase-only” FHFA index, the seven‑county Portland‑Vancouver‑Hillsboro MSA outperformed the statewide average slightly, recording +0.16% quarterly growth and +1.51% annual appreciation (” Seasonally Adjusted, Nominal” category). This MSA includes:

  • Oregon counties: Clackamas, Columbia, Multnomah, Washington, and Yamhill.
  • Washington counties: Clark and Skamania.

The inclusion of Clark County (Vancouver metro) is significant. Its size and activity often moderate or amplify Oregon‑centric trends, making the FHFA MSA lens broader than the Oregon‑only focus used in our local reporting.

In the “All-transactions” FHFA index, the values are similar but slightly different, recording -0.36% quarterly decline and +1.91% annual appreciation. This places the Portland‑Vancouver‑Hillsboro MSA 167th among all reporting MSAs.

Comparison with Our Six-County Oregon Focus

In our Q3 2025 Portland region market update (covering Columbia, Clackamas, Hood River, Multnomah, Washington, and Yamhill), we noted:

  • Median closed price flat at $600,000.
  • Cumulative days on market up to 52 (a 13%+ increase).
  • Sales volume essentially unchanged.

The FHFA’s +1.51% YoY for the seven‑county MSA aligns directionally with this stability but reflects slightly stronger performance due to Clark County’s contribution. When Clark and Skamania are excluded, the Oregon counties track closely with our reported flat medians and lengthening market times.

Methodology Matters: How FHFA Builds the HPI

The FHFA HPI is not just another dataset—it’s one of the most authoritative measures of U.S. housing trends. Here’s how it works:

  • Repeat-Sales Index: FHFA tracks the same property across multiple transactions to measure price changes over time.
  • Purchase Transactions: Use the sales price recorded in the mortgage data.
  • Refinance Transactions: Use the appraised value reported at the time of refinance (if an appraisal was ordered). Automated Valuation Models (AVMs) are not used.
  • Coverage: Only conforming conventional mortgages purchased or guaranteed by Fannie Mae and Freddie Mac are included.
  • New Construction: A new home enters the dataset when financed with a conforming mortgage, but it only contributes to the repeat-sales index once a second transaction occurs (sale or refinance).

This methodology ensures consistency and reliability, but it also means the index can lag in capturing brand‑new construction markets.

A Shoutout to Appraisers

Appraisers play a critical role in the FHFA dataset. Every time a refinance transaction includes an appraisal, that value becomes part of the HPI’s foundation. In other words:

  • Appraisal values anchor the index when no new sale price exists.
  • Consistency in appraisal practice ensures the HPI remains credible and defensible.
  • Local expertise matters: Appraisers’ ability to interpret market conditions, select comps, and apply adjustments directly influences the quality of the data feeding into national housing benchmarks.

Without appraisers, the FHFA’s “all‑transactions” index would be incomplete. Their work provides the bridge between raw market activity and standardized national reporting.

Appraisal Implications

Residential Valuations (1–4 Units):

  • Within Oregon counties, the FHFA’s +0.16% quarterly change supports only minimal positive time adjustments in paired‑sales analysis.
  • Of course, submarkets and particular neighborhoods may diverge from the broader trend. Appraisers must carefully define the competitive submarket for each property and measure market‑condition changes within that context.
  • Flat medians and longer days on market suggest no broad market‑condition adjustments are warranted for most single‑family assignments, but localized dynamics can still justify nuanced treatment.

Cross‑Border and Portfolio Work:

  • For assignments involving Clark or Skamania counties, or when lenders request regional context, the FHFA MSA index provides an authoritative benchmark.
  • The modest +1.51% annual growth reinforces conservative expectations for refinance, purchase, and estate‑planning valuations across the full seven‑county footprint.

Why This Matters

Homeowners, lenders, realtors, estate planners, and attorneys benefit from seeing both perspectives:

  • Oregon‑only trends (flat medians, longer marketing times)
  • FHFA’s broader MSA view (slightly stronger due to Clark County)

Together, they provide a fuller picture of market stability and cross‑border dynamics in the Portland metro.

Frequently Asked Questions (FAQ)

What is the FHFA House Price Index (HPI)?

The FHFA HPI is a repeat‑sales index that measures changes in single‑family home values using data from Fannie Mae and Freddie Mac mortgages. It tracks the same property across multiple transactions to calculate price changes over time.

Does the HPI measure home prices directly?

No. The HPI does not report the median or average home price in dollars. Instead, it measures the percentage change in value between two transactions of the same property.

  • Example: If a home sold for $300,000 in 2015 and then $360,000 in 2025, the HPI records a 20% increase.
  • The index is built entirely from these changes, not from raw price levels. This makes the HPI excellent for tracking market movement, while MLS data is better for reporting actual price levels.

How does the repeat‑sales methodology work?

  • The index only includes properties with at least two transactions (purchase or refinance).
  • It measures the change in value between those two points, not the absolute level of prices.
  • This approach reduces noise from property differences and focuses on market movement.

What about new construction?

  • A new construction sale enters the dataset when financed with a conforming conventional mortgage.
  • However, it does not contribute to the repeat‑sales index until a subsequent transaction occurs (another sale or a refinance with an appraisal).
  • In other words, the first sale is logged, but the property only becomes “active” in the index once there’s a second data point.

What are the implications of this approach?

  • Coverage bias: The HPI does not immediately reflect brand‑new construction markets.
  • Lag effect: It takes time for new construction to show up in the index, often when owners refinance or resell.
  • Complementary data: FHFA also publishes purchase‑only indices (sales prices only) and expanded‑data indices (including FHA and county recorder data) to capture broader market activity.

Do refinances count in the FHFA HPI?

Yes. When a refinance includes an appraisal, the appraised value is used as the second transaction point. Automated Valuation Models (AVMs) are not used. This makes appraisers’ work central to the dataset.

Which counties are included in the Portland‑Vancouver‑Hillsboro MSA?

The FHFA defines the Portland MSA as seven counties:

  • Oregon: Clackamas, Columbia, Multnomah, Washington, Yamhill
  • Washington: Clark, Skamania

This differs from our six‑county Oregon‑only focus, which includes Hood River but excludes Clark and Skamania.

How does FHFA data differ from RMLS or local MLS data?

FHFA data is based on conforming conventional mortgage transactions purchased or guaranteed by Fannie Mae and Freddie Mac. It provides a broad index of price changes, useful for regional benchmarking.

By contrast, RMLS (and other local MLS systems) reflect all listing and sales activity, regardless of financing type. This includes transactions financed with FHA, VA, jumbo loans, private financing, and even cash sales. RMLS also reports granular metrics such as median prices, days on market, and sales volume.

👉 In short: FHFA offers a standardized, mortgage‑based view of price movement, while RMLS captures the full spectrum of market activity, making it indispensable for appraisers and analysts who need transaction‑level detail.

Sources & Further Reading

  • FHFA House Price Index Quarterly Report 2025Q3 (full report)
  • FHA All Transactions Quarterly Tables (Q3 2025)

For current market context on inventory and pricing trends in the Portland region, see our Q3 2025 Market Update.

Thanks for reading—I hope you found a useful insight or an unexpected nugget along the way. If you enjoyed the post, please consider subscribing for future updates.

Question: Do you think Q4 2025 will be flat in Oregon, or will see some significant price movement?

Coda

Are you an agent in Portland who wonders why appraisers always do “x”?

A homeowner with questions about appraiser methodology?

If so, feel free to reach out—I enjoy connecting with market participants across Portland and the surrounding counties, and am always happy to help where I can.

And if you’re in need of appraisal services in Portland or anywhere in the Portland Region, we’d be glad to assist.

About the Author — Abdur Abdul‑Malik, SRA, ASA

Abdur Abdul‑Malik is the founder, author, and publisher of the Portland Appraisal Blog, where he produces original regional and neighborhood‑level housing analytics for the Portland Region. He is a certified residential appraiser serving Oregon and Washington, drawing on RMLS transaction data, public records, and custom segmentation models he has built.

He developed the Portland Appraisal Blog Affordability Index (PABAI), a payment‑based affordability metric built from actual RMLS sales. PABAI incorporates weekly updates based on the prevailing 30‑year fixed mortgage rate, providing a locally grounded measure of housing affordability across the region.

Learn more → PABAI explainermortgage rate seriesfull author bio