

Via Canva Pro
The Portland-area condominium market in 2025 continued its multi-year softening trend, with average and median prices down modestly year-over-year.
Higher interest rates remained a persistent constraint on purchasing power, while rising HOA dues in many complexes increased the effective monthly payment burden. These combined pressures made qualification more challenging and prompted greater selectivity among active buyers—some deferred purchases, waited for concessions, or walked from listings with elevated carrying costs.
Despite these headwinds, the condo segment as a whole stayed moderately affordable relative to the HUD MSA median household, and total sales volume declined only modestly year-over-year. The more telling indicators of shifting dynamics were the continued rise in average months of supply and the substantial increase in cumulative days on market—both pointing to reduced urgency and a more buyer-favored environment, particularly in areas with long-term oversupply such as the Pearl District and Portland Downtown neighborhoods .
While the condo market has been battered over the last few years, it continues to function. Units are getting sold—just taking longer—so this is not a story of panic, but one of measured adjustment to sustained challenges.
Table of Contents
- Data Housekeeping
- Portland Region 2025 Overview
- Multnomah County 2025 Stats
- Washington County 2025 Stats
- Clackamas County 2025 Stats
- Yamhill County 2025 Stats
- Columbia County 2025 Stats
- Hood River 2025 Stats
- Closing Thoughts
- Sources & Further Reading
- Coda
Data Housekeeping
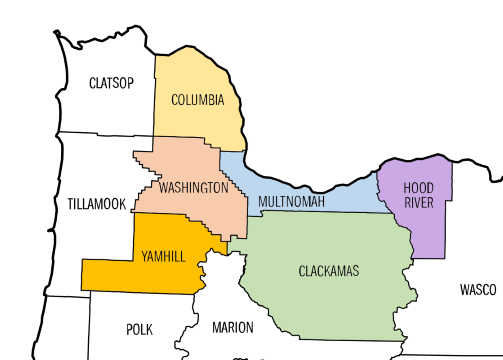
The Portland Region in this update comprises the six Oregon counties of Columbia, Clackamas, Hood River, Multnomah, Washington, and Yamhill. These counties form a contiguous housing ecosystem centered on Portland—Multnomah as the core home county, with the others tightly integrated through commuting patterns, economic ties, and shared market dynamics (e.g., Yamhill’s strong connection via Highway 99W and wine-country adjacency). Beyond Yamhill, the MLS system changes, further distinguishing this six-county area from broader geographic aggregations. For a detailed overview—including county profiles, population data, key value influencers, and why this definition differs from the official seven-county Portland–Vancouver–Hillsboro MSA—see my dedicated page: The Portland Region – Six-County Market Area Overview.
Via SunCatcherStudio
All data is sourced from RMLS and reflects open-market condominium residential sales. SNL (“Sold Not Listed”) entries—off-market transactions entered retroactively—have been excluded to preserve consistency with true market activity.
Since condominium is an ownership type and not necessarily a description of style, a strict examination was made of all other major single-family housing types in RMLS (detached homes, attached homes, and manufactured homes on owned land) and any condominium sales found in those segments were aggregated into this review. All figures underwent standard cleaning to address common RMLS accuracy challenges, including square footage/price typos, incomplete fields, status/date mismatches, and non-representative entries. For a detailed overview of these issues, their impact on market analysis, and mitigation through automated flagging, cross-verification, and manual review, see the dedicated page: RMLS Data Accuracy Challenges.
Portland Region 2025 Overview
2025 saw a continuation of erosion in condo prices, with a substantial increase in the time it takes a condo unit to sell. Higher interest rates and rising HOA dues in many complexes compounded affordability pressures, making monthly payments more burdensome and prompting greater buyer selectivity.
Overall Regional Trends
The table below summarizes key metrics for condominium residential sales in the Portland Region (Columbia, Clackamas, Hood River, Multnomah, Washington, and Yamhill counties) for 2025 compared with 2024.
| Category | 2024 | 2025 | % Change |
|---|---|---|---|
| Total $ Volume | $912.4 Million | $873.5 Million | -4.26% |
| Average Price | $376,101 | $371,576 | -1.20% |
| Median Price | $334,900 | $325,000 | -2.96% |
| Avg SP/OLP | 95.56% | 94.00% | -1.63% |
| Avg PPSF (TSF) | $337.57 | $325.78 | -3.49% |
| Avg HOA Dues | $439.75 | $497.10 | +13.04% |
| Avg Age (Yrs) | 30.91 | 31.67 | +2.44% |
| Avg CDOM | 77.68 | 102.45 | +31.88% |
| Avg Total SF | 1,133 | 1,153 | +1.79% |
| Total # of Sales | 2,426 | 2,351 | -3.09% |
| # of New Constr. | 449 | 385 | -14.25% |
| Avg Supply (Mos.) | 5.62 | 6.74 | +19.82% |
| # of REOs | 14 | 24 | +71.43% |
| # of Short Sales | 1 | 8 | +700.00% |
Condominium Residential | 2024 & 2025
Data: RMLS | PortlandAppraisalBlog.com
Key Observations From the Aggregate Data
The 2025 Portland Region condominium market exhibited clear signs of continued softening, though the declines remained gradual and contained rather than abrupt. Buyer leverage increased noticeably compared to 2024, despite persistently elevated interest rates and rising HOA dues that amplified monthly payment pressures. While the segment retained moderate affordability relative to the HUD MSA median household, the combination of these factors contributed to extended marketing times, higher inventory levels, and greater price concessions across many transactions.
- Average and median sales prices declined modestly year-over-year (-1.2% average to $371,576; -3.0% median to $325,000), reflecting buyer selectivity rather than widespread distress.
- Price per square foot (PPSF) fell -3.5% to $325.78—a more direct indicator of price erosion in the condo segment, where size distribution is tight and PPSF declines are not driven by compositional shifts toward larger units (as often seen in detached homes).
- Cumulative days on market (CDOM) increased substantially (+31.9% to 102.45 days average), with the monthly CDOM comparison showing 2025 consistently higher than 2024 in nearly every month—a clear signal of reduced urgency for some and greater qualification difficulty for others, resulting in prolonged exposure for sellers.
- Months of supply rose +19.8% to 6.74 months average—firmly in buyer-favored territory for most of the year, peaking at 8.91 months in June during softer volume periods.
- Total sales volume dipped only modestly (-3.1% to 2,351 units)—the decline was concentrated in suburban counties (Washington -7.5%, Clackamas -14%), while Multnomah (Portland core) held relatively steady (+0.65%).
- New construction volume fell -14.3% to 385 units, almost entirely in Multnomah County (96% share), with suburban new supply dropping sharply (Clackamas -64%, Washington -58%)—limiting fresh inventory and contributing to resale reliance.
- Average monthly HOA dues rose +13.0% to $497.10—the sharpest annual increase in recent years, with intensity (HOA per SF) highest in urban Multnomah ($0.463/SF) and resort-adjacent Hood River ($0.456/SF), further squeezing affordability from a payment perspective.
- The market remained heavily urban-concentrated: the City of Portland alone accounted for approximately 61% of regional sales, with the Big Three counties (Multnomah, Washington, Clackamas) representing 98.9% of total volume—underscoring that condo activity is fundamentally a Portland-core story.
- Persistent long-term oversupply in key urban submarkets (Pearl District, Portland Downtown ) continued to amplify selectivity, while rural counties (Yamhill, Columbia, Hood River) saw negligible activity, consistent with limited demand and condo availability in those areas.
Portland Region Scatter Plots
To visualize the distribution of individual condominium sales prices across 2025, the following scatter plots show sales price against date of sale. The first graph displays the full range of transactions, while the second focuses on the $800k or less range.
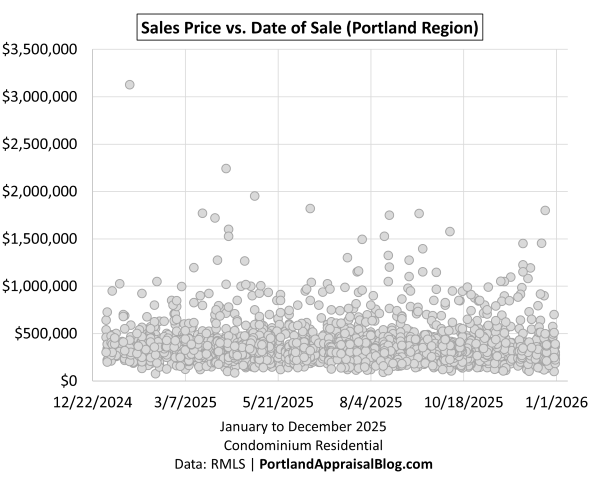
The full time-series view of sales prices across 2025 reveals a market that remained active throughout the year without any significant upward momentum or late-year collapse.
High-end transactions above $1 million occurred sporadically—a thin but persistent tail reflecting continued demand for premium urban and luxury units—yet these outliers were rare relative to the overall volume. The vast majority of sales clustered well below $800,000, confirming the mid-tier focus of the Portland Region condo market in 2025. The absence of a clear ascending trend across the months aligns with the modest price erosion observed in the aggregate data and underscores how elevated interest rates, rising HOA dues, and buyer selectivity tempered any meaningful appreciation, even as closings continued at a steady pace.
Zooming in on sales priced at $800,000 or less—which account for the overwhelming majority of 2025 transactions—reveals a dense, horizontal band of activity that persisted throughout the year with a noticeable downward momentum:
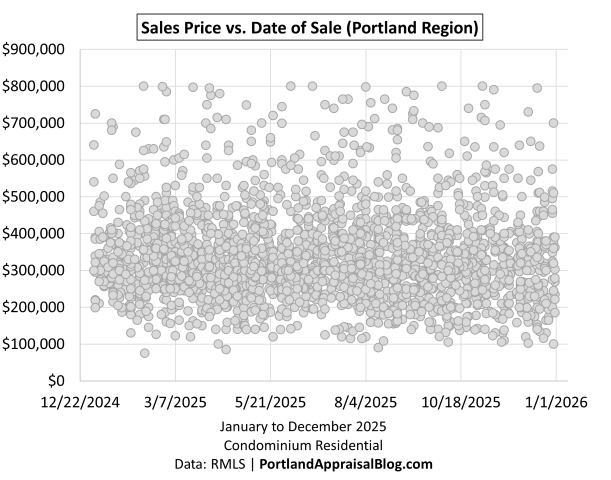
The core cluster remained concentrated in the $200,000–$600,000 range across all months, reflecting the mid-tier focus that defines the Portland Region condo market. While volume fluctuated seasonally (stronger in spring and summer, softer in fall and winter), prices for the bulk of the market showed a steady gradual decline. This downward drift becomes more evident when viewed through the lens of price per square foot, where the year-long trend reveals consistent softening even within the representative price band.
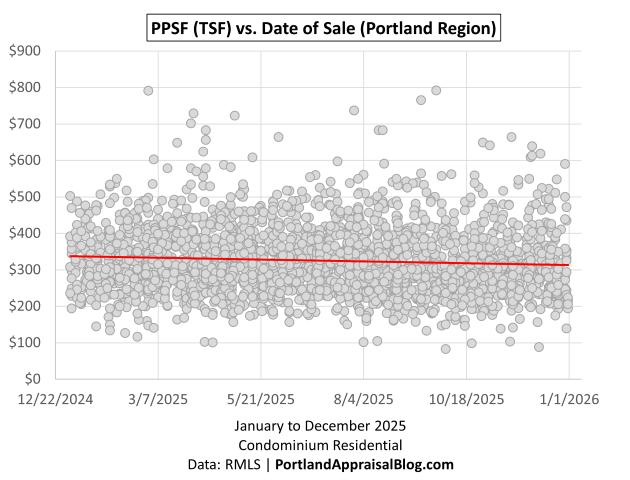
The time-series view of PPSF across 2025 reveals a clear downward tilt in the fitted trendline, confirming that price per square foot softened steadily over the course of the year.
The dense core of transactions clustered between approximately $200 and $500 PSF for most of the period, with early-2025 sales tending to occupy the higher portion of that band and later sales shifting progressively lower. This gradual erosion in PPSF aligns with the modest decline observed in overall average PPSF (-3.5% year-over-year to $325.78). Unlike detached homes, where PPSF declines can sometimes stem from compositional shifts toward larger units, the tight size distribution in condos makes this PPSF trend a more direct indicator of genuine price softness throughout the market.
Bottom-line Summary
The 2025 Portland Region condominium market reflected a continuation of gradual softening that has characterized the segment in recent years. Prices declined modestly overall, with average and median figures down year-over-year, while time-on-market metrics lengthened substantially and inventory levels rose into clearly buyer-favored territory. Rising HOA dues and persistently high interest rates amplified monthly payment pressures, narrowing buyer pools and increasing selectivity—particularly in complexes with elevated carrying costs. Yet the market remained functional: transactions continued at a steady pace, volume held relatively close to the prior year, and affordability persisted at a moderate level relative to the HUD MSA median household. This was not a collapse, but a measured shift toward conditions favoring buyers, with the most pronounced effects visible in extended marketing times, higher months of supply, and selective pricing behavior across the region.
Sales Volume
A treemap visualizing the distribution of condominium sales by county in 2025 clearly illustrates the market’s geographic concentration.
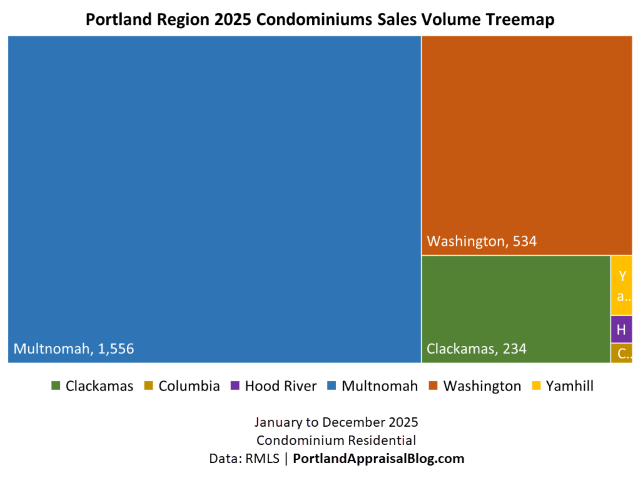
The distribution of condo sales volume across the Portland Region in 2025 reveals extreme concentration in the urban core and immediate suburbs, with the three major counties accounting for nearly 99% of all transactions.
Multnomah County—encompassing the City of Portland and its immediate surroundings—dominated with 66.2% of regional sales (1,556 units), underscoring that the metro condo market is fundamentally an urban Portland story. Washington County followed at 22.7% (534 units), while Clackamas County contributed 10.0% (234 units). The remaining three counties (Columbia, Hood River, and Yamhill) combined for just 1.15% of volume (27 units total), reflecting the limited presence of condominium inventory in more rural and outer areas. This geographic skew highlights how condo demand remains anchored to denser, amenity-rich and walkable locations.
The following bar chart shows monthly sales volume for 2025:
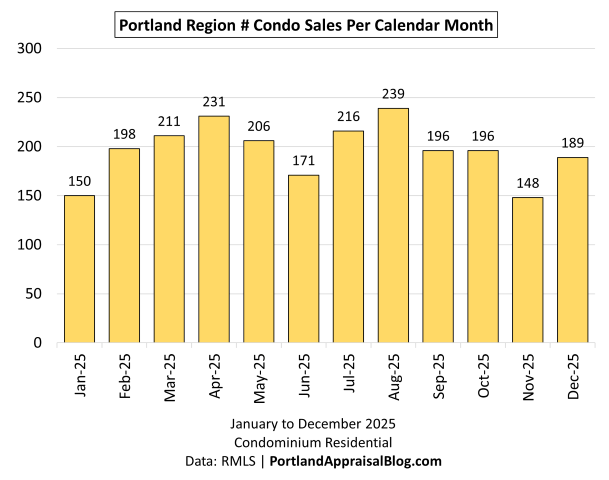
Monthly sales volume in 2025 followed a recognizable seasonal rhythm, though the pattern was somewhat muted compared to more family-driven segments like detached single-family homes.
Activity started modestly in January (150 sales), built steadily through spring (peaking at 231 sales in April), and reached the year’s high in August (239 sales)—a classic spring-to-summer strength seen in many residential markets. Volume then tapered noticeably in fall and winter, with November marking the low point (148 sales) before a slight December rebound (189 sales).
The overall monthly range (148–239 sales) reflects a market that remained functional and active year-round, without the sharp seasonal swings or deep troughs often observed in detached homes. This steadier flow is consistent with a buyer base less constrained by school calendars—including singles, young couples, downsizers, and retirees—and underscores that while some affordability pressures and selectivity were present, the condo segment did not experience dramatic seasonal shutdowns.
The line graph below compares monthly sales volume across the twelve months for 2024 and 2025.
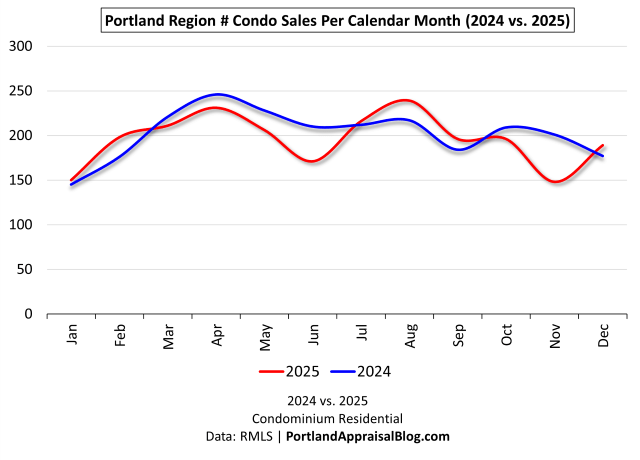
The year-over-year comparison of monthly sales volume reveals that 2025 closely tracked the seasonal pattern established in 2024, with no fundamental disruption to the typical residential rhythm, yet the overall level remained slightly lower.
Both years showed a spring buildup (March–April highs), sustained summer activity (July–August), and a fall/winter taper (November lows), consistent with broader market behavior. In 2025, the peak occurred in August (239 sales) rather than April (231), and summer months actually outperformed 2024 in July and August, while the late-year decline was more pronounced in November (148 vs. 201). The net result was a modest 3.1% reduction in total annual sales (2,351 vs. 2,426), indicating a market that continued to function steadily.
Sales Price
The following bar chart shows average monthly sales price for 2025:
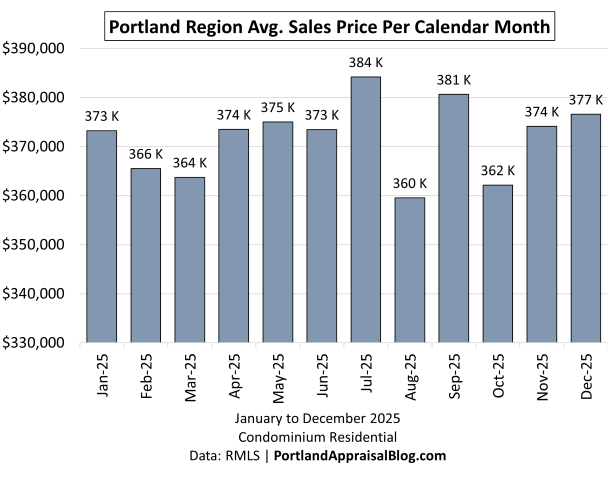
Monthly average sales prices in 2025 remained remarkably stable across the year, fluctuating within a relatively narrow band of approximately $360,000 to $385,000.
The highest monthly average occurred in July ($384,196), while the lowest came in August ($359,556)—coinciding with the year’s peak volume month. Prices trended upwards until July and then trended downwards for the rest of the year. This overall flatness aligns with the modest year-over-year decline in average price (-1.2% to $371,576).
The line graph below compares average monthly sales prices across the twelve months for 2024 and 2025.
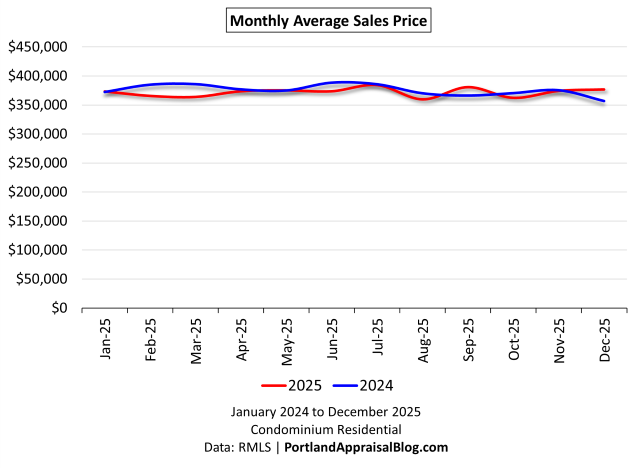
The year-over-year comparison of monthly average sales prices shows 2025 prices tracking closely with 2024 throughout most of the year, with no dramatic divergence or sustained downward break. Zooming in we have:
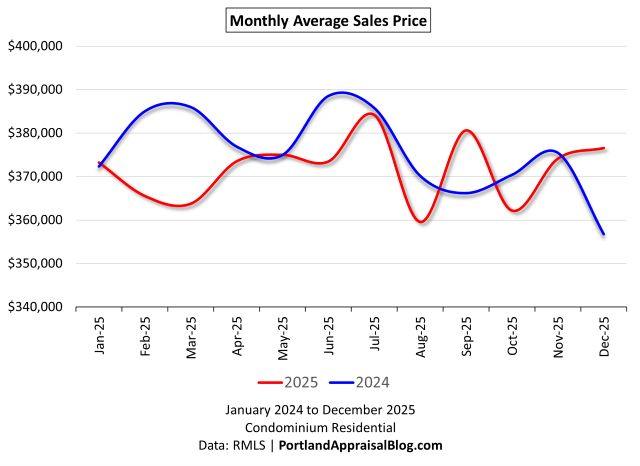
Both years fluctuated within a similar overall range (roughly $350,000–$390,000), reflecting the condo segment’s relative price stability. Early 2025 prices started near 2024 levels (January slightly higher, February and March lower), held steady through spring and summer (July nearly identical at ~$384,000), and ended the year modestly higher in December ($376,584 vs. $356,771). Noticeable softening appeared in August 2025 ($359,556 vs. $370,187), but the lack of a consistent or accelerating decline across months aligns with the modest overall annual drop (-1.2% average price to $371,576). This pattern reinforces that while buyer selectivity and carrying-cost headwinds were present, the market did not experience sharp or broad-based price erosion relative to the prior year.
New Construction
The bar graph below shows monthly total condominium sales for 2025, with new construction volume nested within each bar to illustrate the portion of sales that were newly built.
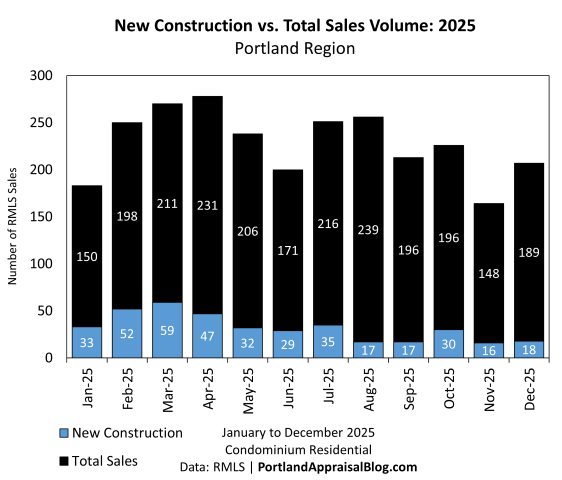
New construction provided a meaningful but uneven contribution to monthly sales volume in 2025, accounting for 16.4% of total transactions (385 out of 2,351 units) and following a clear seasonal cadence.
The share of new construction peaked in late winter and early spring (February–March ~26–28%), when fresh deliveries aligned with stronger buyer activity. It then declined sharply through summer and early fall (August–September dropping to ~7–9%), reflecting reduced project closings during the year’s highest total volume month (August 239 sales). A modest rebound occurred in late fall (October 15.3%), but the overall pattern shows new supply was front-loaded and tapered significantly in the second half of the year.
This uneven distribution meant resale inventory bore more absorption pressure during peak demand periods. The decline in new construction volume from 2024’s 449 units (-14.3%) limited buyers’ options for fresh supply.
The bar graph below shows the number of new construction closings by county, with side-by-side bars for 2024 and 2025.
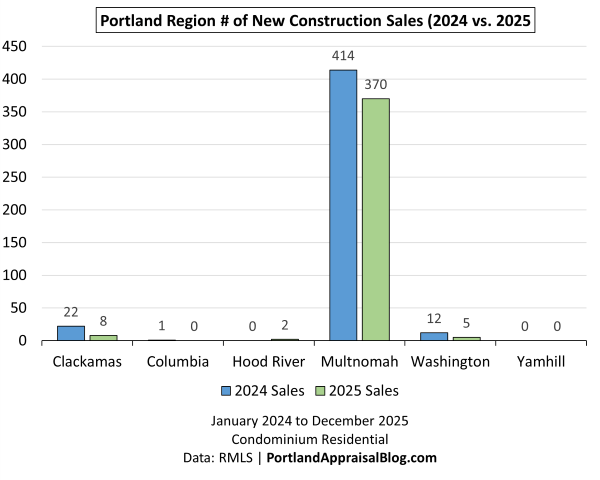
New construction activity in 2025 remained overwhelmingly concentrated in Multnomah County, which accounted for 96.1% of all new condo units delivered (370 out of 385 total).
This extreme urban dominance reflects the ongoing focus of new development in Portland’s core and inner neighborhoods, where density, transit access, and demand for urban living support higher-rise and infill projects. Suburban counties saw significantly reduced new supply: Clackamas dropped -63.6% (22 to 8 units), Washington fell -58.3% (12 to 5 units), and Columbia had 1 in 2024 and none in 2025. Hood River contributed a small increase (0 to 2 units), but the absolute number remained negligible, while Yamhill had zero in both years.
The regional decline of -14.3% in new units (from 449 to 385) reduced fresh inventory overall, slightly shifting absorption pressure toward resale stock. Despite fewer new deliveries in 2025, months of supply remained elevated and cumulative days on market increased sharply—indicating that resale softness and buyer selectivity outweighed the limited relief from reduced new supply.
The table below shows new construction sales volume by dollar amount for 2025 compared with 2024.
| County | 2024 $ Amount | 2025 $ Amount | % Change | % of Total 2025 $ Amount |
|---|---|---|---|---|
| Clackamas | $8,228,570 | $4,222,200 | -48.69% | 0.48% |
| Columbia | $200,000 | $0 | -100.00% | 0.00% |
| Hood River | $0 | $1,178,000 | — | 0.13% |
| Multnomah | $150,445,729 | $136,647,060 | -9.17% | 15.64% |
| Washington | $6,317,967 | $2,532,998 | -59.91% | 0.29% |
| Yamhill | $0 | $0 | — | 0.00% |
| Sum | $165,192,266 | $144,580,258 | -12.48% | 16.55% |
Data: RMLS | PortlandAppraisalBlog.com
The following double bar chart provides the above information at a glance.
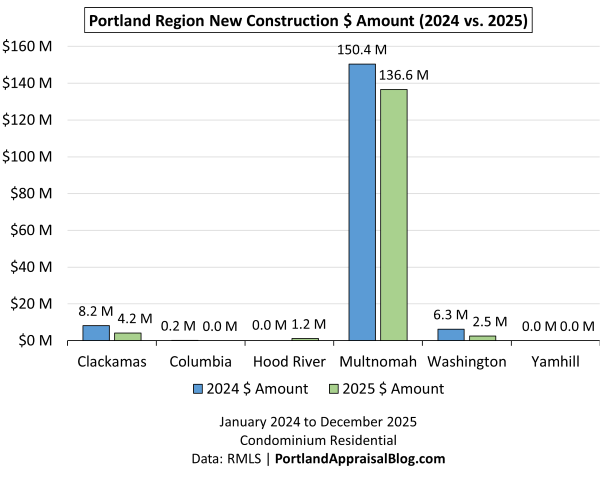
In dollar terms, new construction volume declined 12.5% regionally to $144.6 million in 2025 (from $165.2 million in 2024), reflecting both fewer units delivered and shifts in average pricing among the new supply that did close.
Multnomah County again dominated, accounting for 94.5% of the total new construction value ($136.6 million in 2025, down 9.2% from 2024). This near-total concentration in the urban core mirrors the unit volume pattern and highlights the ongoing focus of new development in Portland’s denser, higher-value neighborhoods. Suburban counties experienced steeper value reductions: Clackamas fell 48.7% ($8.2M to $4.2M), Washington declined 59.9% ($6.3M to $2.5M), and Columbia dropped to zero from $200,000 in 2024. Hood River contributed a small $1.18 million in 2025 (from zero the prior year), while Yamhill remained at zero.
The sharp suburban pullback in new construction dollars limited fresh inventory outside the city, placing additional absorption pressure on existing resale stock.
Cumulative Days on Market
The bar chart below compares average cumulative days on market (CDOM) throughout 2025.
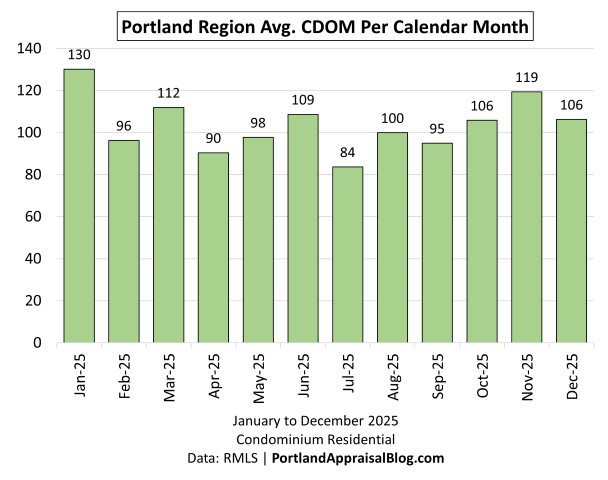
Monthly average cumulative days on market in 2025 followed a seasonal pattern that was both pronounced and persistent, with clear winter highs and summer lows.
CDOM started the year at its peak (January 130.22 days), reflecting slower winter activity, then improved steadily through spring and early summer (April low of 90.41 days, July low of 83.67 days)—coinciding with stronger volume periods. Marketing times lengthened again in late summer and fall (August 99.90, October 105.82, November high of 119.36 days), before easing slightly in December (106.27 days).
The overall range (83–130 days) and sustained elevation (only two months below 90 days) underscore a market where buyer selectivity remained strong year-round. Even during traditionally faster periods, average CDOM stayed well above 2024 levels, contributing to the annual increase of +31.9% to 102.45 days and reflecting the ongoing impact of high interest rates, rising HOA dues, and a more cautious buyer pool.
The bar chart below compares cumulative days on market for 2024 and 2025.
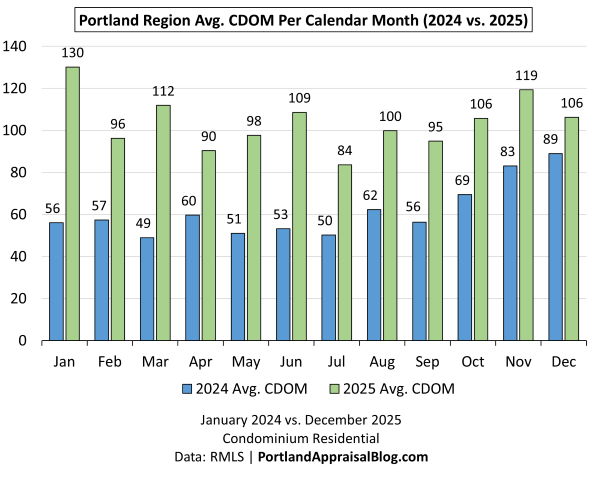
The year-over-year monthly comparison of average cumulative days on market reveals a dramatic and consistent widening of marketing times in 2025 compared to 2024, with increases ranging from 19% to 132% across nearly every month.
In 2024, CDOM remained relatively low and stable (mostly 50–70 days, with a modest rise in fall/winter), reflecting a more balanced market. In 2025, the curve shifted sharply upward: January soared to 130 days (+132% from 56), March reached 112 days (+128% from 49), and even the summer low in July (84 days) was +66% above 2024’s 50 days. Late-year months showed the smallest relative gap (December +19% to 106 days), but the overall elevation persisted. This broad-based increase across the calendar—with no month showing shorter times in 2025—signals significantly reduced buyer urgency and greater qualification difficulty, resulting in prolonged exposure for sellers and a more pronounced buyer-favored environment than in the prior year.
Housing Supply
Months of supply (MOS) represents the number of months it would take to absorb current active inventory at the prevailing sales pace, assuming no new listings enter the market. The following bar chart shows MOS by calendar month for 2025:
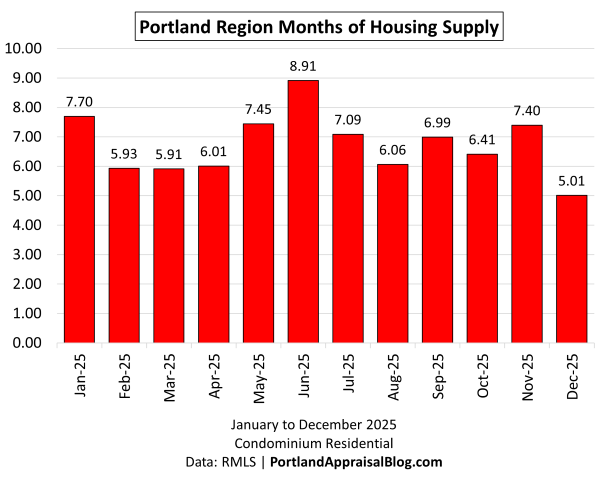
Months of supply in 2025 remained elevated throughout the year, averaging 6.74 months and reflecting a consistently buyer-favored market.
MOS started high in January (7.70 months), dipped slightly in spring (March–April ~5.9–6.0 months) during stronger volume periods, then climbed to a peak in June (8.91 months)—coinciding with the year’s lowest sales volume. Supply eased modestly in late summer (August 6.06 months) but stayed above 6 months in most remaining months, ending the year lower in December (5.01 months) amid year-end closings and listing cancellations.
The sustained elevation (above 6 months in 8 of 12 months) and mid-year peak underscore persistent absorption challenges, even as seasonal volume patterns persisted. This buyer-leaning inventory environment, up +19.8% from 2024’s 5.62 months average, contributed to greater buyer leverage, longer marketing times, and increased pressure on sellers to offer concessions throughout the year.
The line graph below compares monthly months of supply for 2024 (blue line) and 2025 (red line), with a full y-axis scale to show true proportional differences:
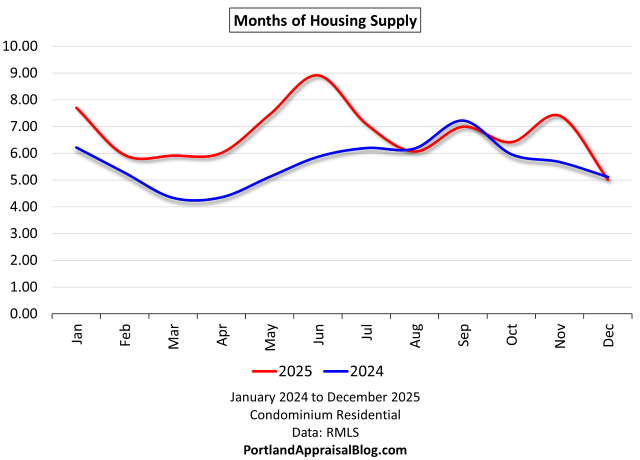
The year-over-year comparison of months of supply shows a clear and consistent upward shift in 2025, with the line remaining above 2024 levels in nearly every month and the annual average rising from 5.62 to 6.74 months (+19.8%).
In 2024, MOS fluctuated in a more balanced range (mostly 4.3–7.2 months), dipping to tighter levels in spring (March–April ~4.3–4.4 months) during stronger absorption periods. In 2025, supply started higher (January 7.70 vs. 6.21), peaked sharply in June (8.91 vs. 5.87), and stayed elevated through most of the year (above 6 months in 8 of 12 months). The only convergence occurred in late summer and December, where 2025 dipped closer to or slightly below 2024 levels (August 6.06 vs. 6.18, September 6.99 vs. 7.22, December 5.01 vs. 5.11).
This persistent elevation in 2025—particularly the mid-year spike—confirms a more buyer-favored inventory environment overall, even with some late-year relief from stronger closings.
HOA Dues
The bar chart below compares average monthly HOA dues (for reporting sales) for 2024 and 2025:
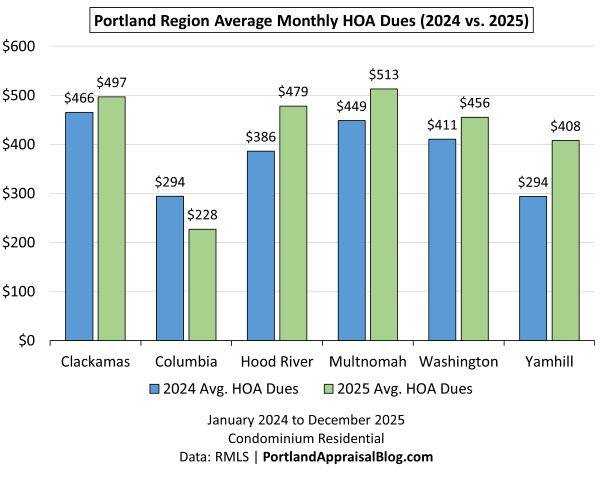
Average monthly HOA dues increased in most counties in 2025, with the regional figure rising 13.0% from $439.75 to $497.10—a sharper annual jump than the more gradual increases observed in 2024.
Multnomah County saw the largest dollar increase (+$64.56 to $513.20, +14.4%), reflecting higher costs in urban high-rise and mid-rise buildings with greater amenity and insurance burdens. Washington County rose +11.0% to $455.74, while Clackamas increased +6.8% to $497.14.
In the smaller counties, reported increases were noted in Hood River (+23.9% to $478.60) and Yamhill (+38.9% to $408.00), while Columbia showed a -22.7% decline to $227.50. These figures should be interpreted cautiously due to the very small sample sizes (5–15 sales per county), where HOA dues are often influenced by factors such as the size of the unit sold, the specific complex’s reserve status, or insurance allocations for that building.
This widespread upward pressure on HOA dues—particularly pronounced in urban and resort-adjacent areas—influenced affordability qualifications from a monthly payment perspective, contributing to the lengthening cumulative days on market.
Histograms
Histograms offer a unique and powerful perspective on the condominium market that traditional summary statistics and bar charts cannot fully capture: they reveal the underlying shape, spread, and clustering of the data, exposing patterns, skewness, tails, and bifurcations that averages and medians alone obscure.
While tables and trend lines show central tendencies and directional changes, histograms display the actual distribution of values—how many sales fall in each price band, how concentrated or dispersed PPSF is, where the bulk of CDOM accumulates, and how HOA dues are skewed. This distributional view highlights market segmentation (e.g., low-dues “winners” vs. high-dues “losers”), buyer selectivity (long tails in CDOM), and pricing dynamics (left shoulders in SP/OLP) in ways that are immediately visible and intuitive. The histograms illustrate these shapes for the 2025 Portland Region condo market, providing deeper insight into the forces driving the observed softening and buyer-favored conditions.
The following histogram shows the distribution of sales price as a percentage of original list price in 2025:
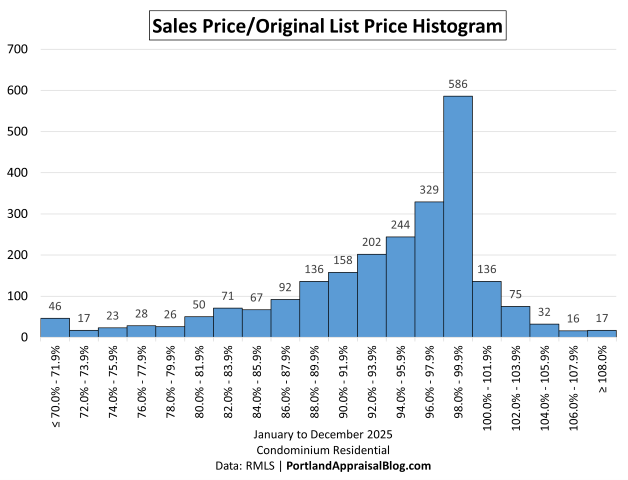
The distribution of sale price as a percentage of original list price in 2025 reveals a market where sellers generally achieved strong realization on well-priced listings, yet a substantial portion required meaningful concessions to close.
The histogram shows a sharp peak in the 98.0%–99.9% bin (586 sales, 24.9% of total), indicating that realistic pricing prevailed and many condos moved efficiently once listed correctly. Nearly a quarter of transactions closed at or very near full original asking—a sign of disciplined seller expectations and solid demand for properly positioned units.
However, the pronounced left shoulder—with nearly half of sales (49.3%) below 96%—is particularly telling. This meaningful volume of transactions highlights buyer leverage in a notable subset of cases, often tied to red flags such as high or rising HOA dues, special assessments, financing hurdles, condition issues, or over-optimistic initial pricing. The thin right tail (only 11.7% at or above 100%) further confirms the scarcity of true bidding wars in the condo segment.
Overall, the shape reflects a buyer-favored but not collapsed market: sellers still commanded close to asking in most cases when priced realistically, but the fat left shoulder underscores condo-specific frictions amplifying negotiation power and concessions.
The following histogram shows the distribution of sales prices of condo units in 2025:
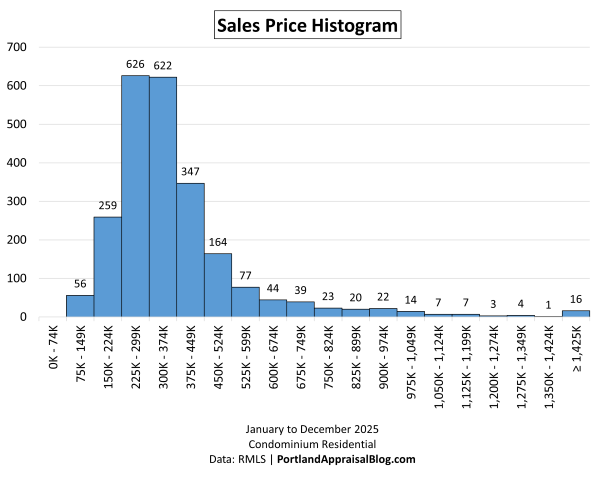
The distribution of sales prices in 2025 shows a strongly right-skewed pattern, with the overwhelming majority of transactions concentrated in the mid-tier price bands that define the Portland Region condo market.
The histogram reveals a clear double peak: the highest concentration in the $225,000–under-$300,000 range (626 sales, 26.6% of total), closely followed by $300,000–under-$375,000 (622 sales, 26.5%). Together, these two bins capture more than half of all sales (53.1%), underscoring the dominance of affordable to moderately priced units. The cumulative share below $450,000 reaches 81.2%, confirming that the vast majority of condo activity remained accessible to a broad range of buyers. This mid-tier hump aligns with the typical buyer profile in the region (first-time buyers, downsizers, young couples, and investors seeking entry-level or urban alternatives).
The long but extremely thin right tail (scattered sales at or above $750,000) does indicate the presence of a luxury condo market in the region (mostly in Portland urban core areas). While this segment represents only a small fraction of total volume, it demonstrates that high-end demand persists in select locations with premium features, views, and amenities—even in a year marked by overall softening.
The following histogram shows the distribution of price per square foot for condo units in 2025:
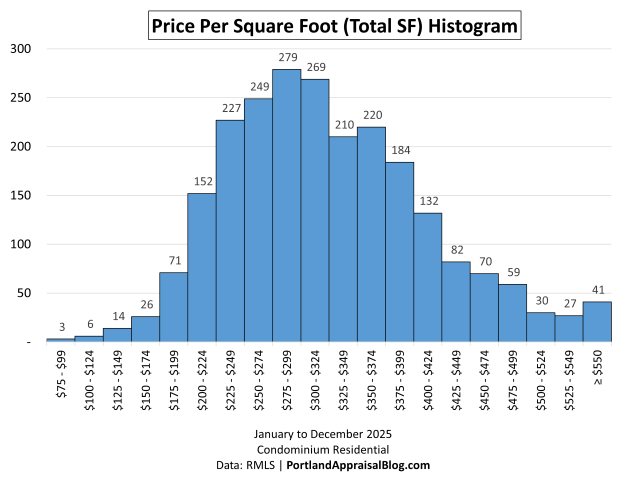
The distribution of price per square foot in 2025 shows a relatively tight, unimodal pattern with a moderate right skew, centered on the mid-to-upper $200s and low $300s.
The histogram peaks in the $275–$299 range (279 sales, 11.9% of total), with strong adjacent bins at $250–$274 (249 sales, 10.6%) and $300–$324 (269 sales, 11.4%). Together, the $250–under-$350 range captures approximately 42.8% of sales, while the cumulative share below $400 PSF reaches 81.2%. This concentrated middle reflects the typical efficiency of mid-tier condos in the Portland Region—units of moderate size (median ~1,000–1,100 SF) in buildings with standard amenities and locations.
The right skew (18.8% at or above $400 PSF, with a thin tail beyond $500) indicates variability driven by premium factors: newer construction, better views, higher-floor locations, superior finishes, or high-demand urban/resort settings. The low-end tail (below $250 PSF, 21.2%) is limited but present, typically corresponding to older or less marketable complexes. Overall, the shape underscores that PPSF in condos is more tightly grouped than in detached homes, with declines in PPSF more directly reflecting price softness rather than size-driven composition changes.
The following histogram shows the distribution of total square footage of condo units in 2025:
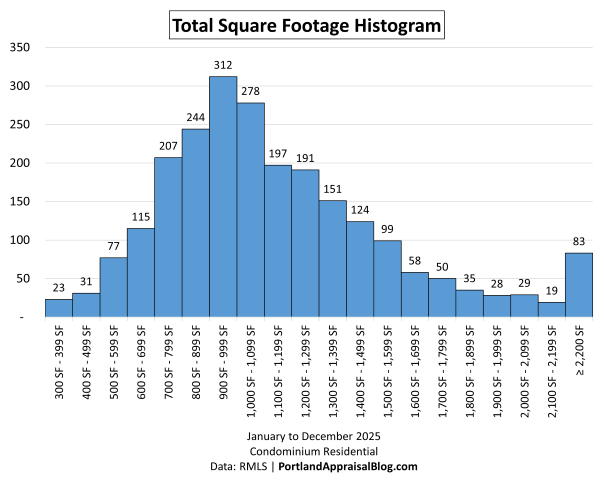
The distribution of total square footage in 2025 exhibits a unimodal shape with moderate right skew, centered on the 900–1,100 SF range that typifies the Portland Region condo market.
The histogram peaks at 900–999 SF (312 sales, 13.3% of total), with strong adjacent bins at 800–899 SF (244 sales, 10.4%) and 1,000–1,099 SF (278 sales, 11.8%). Together, the 800–1,199 SF range captures approximately 43.9% of sales, and the cumulative share below 1,300 SF reaches 71.3%. This concentrated middle reflects the typical size profile for the region: compact to mid-sized units (1–2 bedrooms) in garden-style, mid-rise, or older urban buildings, offering efficient living without excessive space.
The moderate right skew (17.1% at or above 1,500 SF, with a thin tail beyond 2,200 SF) indicates variability driven by premium or larger configurations: newer high-rises, townhome-style condos, or combined units in premium locations. The low-end tail (below 800 SF, 19.3%) is present but limited, typically corresponding to studios or micro-units in older complexes. Overall, the tight size distribution underscores why PPSF in condos behaves more directly as a price indicator rather than a function of diminishing returns on incremental square footage (as often seen in detached homes).
The following histogram shows the distribution of cumulative days on market for condo units in 2025:
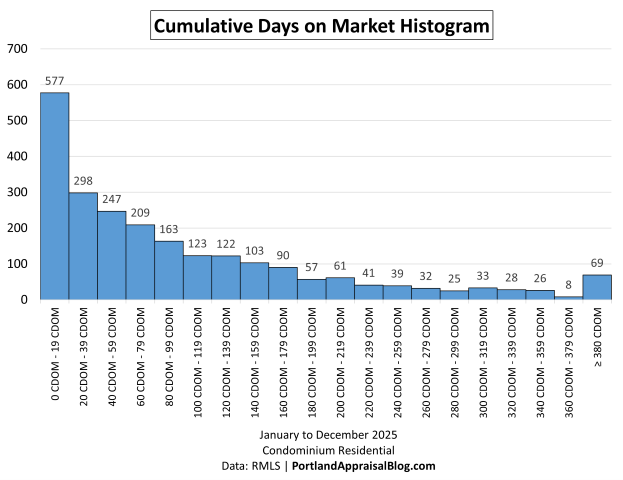
The distribution of cumulative days on market (CDOM) in 2025 shows a heavily right-skewed pattern, with a dominant early peak and a long, persistent tail that highlights the market’s buyer-favored nature.
The histogram peaks sharply in the 0–19 day bin (577 sales, 24.5% of total), with strong follow-up in the 20–39 day (298 sales, 12.7%) and 40–59 day (247 sales, 10.5%) bins. Together, sales closing in under 60 days account for approximately 47.7% of transactions, indicating that well-priced units continued to move efficiently even in a softer year. The cumulative share below 100 days reaches 63.6%, showing that a majority of condos sold within roughly three months.
The long right tail, however, is particularly telling: 36.5% of sales exceeded 99 days, 17.8% exceeded 179 days, and 2.9% lingered 380 days or more. This extended exposure—far beyond the regional average of 102.45 days—signals significant buyer selectivity, often tied to red flags such as high or rising HOA dues, special assessments, financing hurdles, condition issues, or overly-optimistic pricing. The presence of a meaningful number of very long-marketing units underscores how carrying-cost pressures, softer demand for luxury units, and reduced urgency amplified concessions and motivation in certain segments.
The following histogram shows the distribution of monthly HOA dues for condo units in 2025:
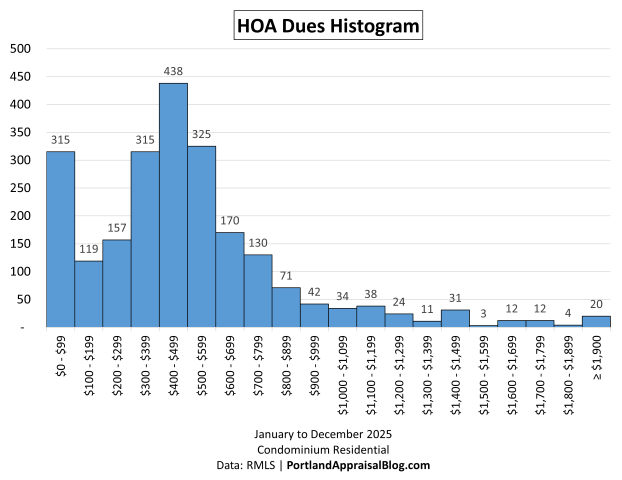
The distribution of monthly HOA dues in 2025 shows a pattern that, while technically unimodal with a peak in the mid-range, is strongly influenced by a prominent low-end cluster that contributes to a near-bimodal appearance and shapes the affordability story.
The histogram peaks in the $400–$499 bin (438 sales, 19.3% of total), with strong adjacent bins at $300–$399 (315 sales, 13.9%) and $500–$599 (325 sales, 14.3%). Together, dues between $300 and under $600 capture approximately 47.5% of sales, while the cumulative share below $600 reaches 73.5%. This concentrated middle corresponds to the most common range for garden-style, mid-rise, and older urban/suburban buildings with standard amenities, reserves, and insurance coverage.
However, the prominent low-end cluster ($0–$299, 26.0% of sales, including a large $0–$99 bin at 13.9%) stands out as a distinct group, creating visual separation and a near-bimodal feel. This low-dues segment—often small infill developments, site condos, or minimal-association properties—represents the clear “winners” in affordability: lower monthly burdens, broader buyer appeal, easier financing, and faster absorption.
The moderate right skew (18.2% between $600 and $999, 8.3% at $1,000 or above, with a thin tail beyond $1,500) highlights variability driven by premium or challenged complexes: newer high-rises with elevators/concierge, resort-adjacent buildings, or older ones with elevated insurance/reserve needs. The low-end cluster ($0–$299, 26.0%) is notable but limited, typically corresponding to small infill developments, site condos, or minimal-association properties where dues remain nominal.
Overall, the shape underscores a clear bifurcation in carrying costs: a large mid-range core that supports broad access and a notable low-end cluster enhancing affordability for many, contrasted with a meaningful tail of higher dues that can constrain buyer pools, extend marketing times, and amplify concessions in affected segments.
Miscellaneous Statistics & Standout Transactions
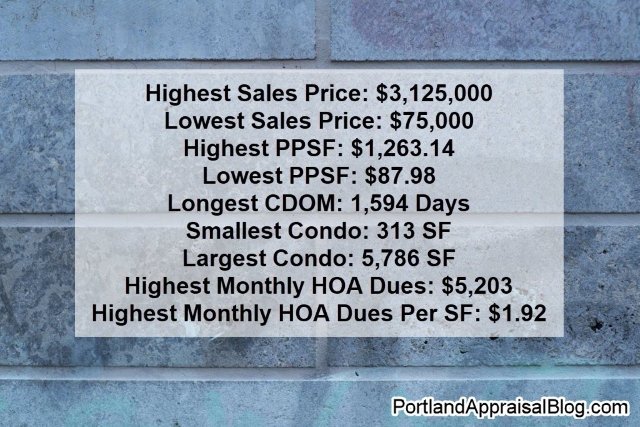
Here are some of the most notable outliers and extremes from the 2025 Portland Region condo market—numbers that illustrate the full range of the data and the extremes buyers and appraisers encounter.
Highest Sales Price: $3,125,000—Penthouse unit at The Ritz-Carlton Residences, Portland (January 2025 sale). This represents an extreme high-water mark in the luxury segment. The current management team has decided that unsold units would be listed with a discount of at least 50%. While this does not necessarily reflect the precise diminution of value for this particular penthouse unit, it does underscore the risk of being among the first buyers into an expensive project—particularly when location-specific factors and market conditions do not fully support the initial pricing expectations. Photos of this property are currently available online.
Lowest Sales Price: $75,000—Ground-floor 1-bedroom, 1-bathroom condo in Beaverton (Washington County). This marks the absolute bottom of the 2025 dataset, typical for smaller, older units in suburban locations with basic amenities. Exterior photos of this property are currently available online.
Highest Price Per Square Foot: $1,263.14—This is the same penthouse unit at the Ritz Carlton that took the crown for highest sales price. That sale represented the extreme of the market in two distinct categories.
Lowest Price Per Square Foot: $87.98—A 1,165 SF 2-bedroom, 1.1-bathroom condo in the Hazelwood neighborhood in Portland. This sale closed at a price that places it at the absolute bottom of PPSF in the 2025 Portland Region condo dataset. Per agent comments and photos, this unit sold as a fixer and closed as a cash sale. Given this unit is ~27.6% of the average price of the Portland Region’s condo market, a sale like this represents an equity building opportunity for the right buyer. Photos of this property are currently available online.
Longest CDOM: 1,594 days—3-bedroom, 4-bathroom townhome-style condo in Portland with a riverfront location and mountain views. This unit’s extended marketing period began with an initial listing in August 2020 at $479,000 and concluded in February 2025 at $405,500—a reduction of approximately 18.3% from original asking. Photos of this property are currently available online.
Smallest Condo: 313 SF—Studio unit in Portland (1920s-era building in the Alphabet District/Nob Hill).This sale represents the smallest unit in the 2025 Portland Region condo dataset—a compact studio in an historic building with walkable access to Powell’s Books, NW 23rd Avenue shops/restaurants, Providence Park, Washington Park, and the Rose Garden. At 313 SF, this transaction typifies the micro-studio segment in older urban buildings, where small size limits functional utility and buyer appeal but offers an entry point for singles, young professionals, or investors. Such units often trade at low absolute prices and PPSF due to space constraints. Photos of this property are currently available online.
Largest Condo: 5,786 SF—Combined 5-bedroom, 4.1-bathroom unit occupying the entire third floor of its building in Portland (West Hills area). This was a resale of a rare merged unit created by combining three individually recorded condo units into a single expansive residence. The layout offers generous single-floor living with city and mountain views, including five dedicated parking spaces, guest parking, and three large storage closets (two combined). The sale closed at $1,040,000 after an original listing price of $1,950,000. The significant discount from original list ($1.95M → $1.04M) illustrates that the combined whole was not valued as greater than the sum of its parts—a reminder that market perception, functional utility, and buyer pool can limit premiums for unusually large or custom configurations in condo settings. The extremely high monthly HOA dues ($5,203) likely contributed to the prolonged marketing and ultimate pricing outcome, underscoring how carrying costs can materially impact marketability and buyer interest in high-end projects. Photos of this property are currently available online.
Highest Monthly HOA Dues: $5,203—The crown for the highest monthly HOA dues is the same property as the largest condo. By merging three units together the previous owner assumed a substantially higher monthly HOA bill. It is technically possible to add walls back in and revert the single unit back to three individual condos.
Highest Monthly HOA Dues Per SF: $1.92/SF—2-bedroom, 2-bathroom unit in Portland (mid-century building in King’s Hill Historic District). This sale closed at $361,500 in cash, with monthly HOA dues of $2,321 (including property taxes). At $1.92 per square foot, this represents the highest HOA intensity in the 2025 Portland Region condo dataset. The elevated dues burden, even at a relatively affordable sales price, illustrates how carrying costs can significantly narrow the buyer pool and create affordability barriers for many potential purchasers. Photos of this property are currently available online.
With the regional aggregate trends, graphs, monthly patterns, histogram analysis, and notable outliers covered, the remainder of this update turns to a county-level breakdown. The following sections present year-over-year comparisons for each of the six counties in the Portland Region—Multnomah, Washington, Clackamas, Yamhill, Columbia, and Hood River. Each county snapshot includes key metrics, commentary on local drivers, and any segment-specific observations that help explain broader regional patterns.
Multnomah County 2025 Stats
Multnomah County, encompassing the City of Portland and its immediate surroundings, dominated the regional condominium market in 2025, accounting for 66.2% of all sales (1,556 units out of 2,351) and serving as the true engine of the regional condo segment.
The table below summarizes key metrics for Multnomah County condominium residential sales in 2025 compared with 2024.
| Category | 2024 | 2025 | % Change |
|---|---|---|---|
| Total $ Volume | $605.8 Million | $607.8 Million | +0.34% |
| Average Price | $391,826 | $390,618 | -0.31% |
| Median Price | $335,000 | $330,000 | -1.49% |
| Avg SP/OLP | 95.23% | 93.81% | -1.50% |
| Avg PPSF (TSF) | $355.03 | $343.06 | -3.37% |
| Avg HOA Dues | $448.64 | $513.20 | +14.39% |
| Avg Age (Yrs) | 30.43 | 31.09 | +2.17% |
| Avg CDOM | 87.11 | 111.67 | +28.19% |
| Avg Total SF | 1,119 | 1,146 | +2.44% |
| Total # of Sales | 1,546 | 1,556 | +0.65% |
| # of New Constr. | 414 | 370 | -10.63% |
| # of REOs | 8 | 14 | +75.00% |
| # of Short Sales | 1 | 7 | +600.00% |
Condominium Residential | 2024 & 2025
Data: RMLS | PortlandAppraisalBlog.com
Multnomah County exhibited relative resilience compared to the regional trend, with sales volume holding steady (+0.65%) and total dollar volume slightly up (+0.34%). Average and median prices softened modestly (-0.31% and -1.49%, respectively), while PPSF declined -3.37% to $343.06—a more direct indicator of price pressure in the condo segment. Cumulative days on market rose +28.2% to 111.67 days average, reflecting increased buyer selectivity amid high interest rates and rising HOA dues (+14.39% to $513.20 average) as well as the presence of luxury condo units that naturally take longer to find qualified buyers. New construction fell -10.6% to 370 units (all in the City of Portland), and distress indicators ticked up (REOs +75%, short sales +600%), though absolute numbers remained small.
The following table shows the geographic distribution of condo sales in Multnomah County:
| City | Avg Price | Avg PPSF | # of Sales | % of Sales |
|---|---|---|---|---|
| Gresham | $249,004 | $226.82 | 72 | 4.63% |
| Lake Oswego | $314,402 | $256.82 | 48 | 3.08% |
| Portland | $400,547 | $352.18 | 1,431 | 91.97% |
| Troutdale | $332,500 | $226.84 | 2 | 0.13% |
| Wood Village | $311,333 | $242.31 | 3 | 0.19% |
| Avg/Sum | $390,618 | $343.07 | 1,556 | — |
Data: RMLS | PortlandAppraisalBlog.com
The market’s heavy concentration in Portland city proper (92% of county sales) underscores that Multnomah’s condo activity is fundamentally urban, with suburban pockets (e.g., Gresham, Lake Oswego portion) contributing only marginally.
The following is a scatter plot of all Multnomah County condo sales in 2025 (sales price vs. date of sale):
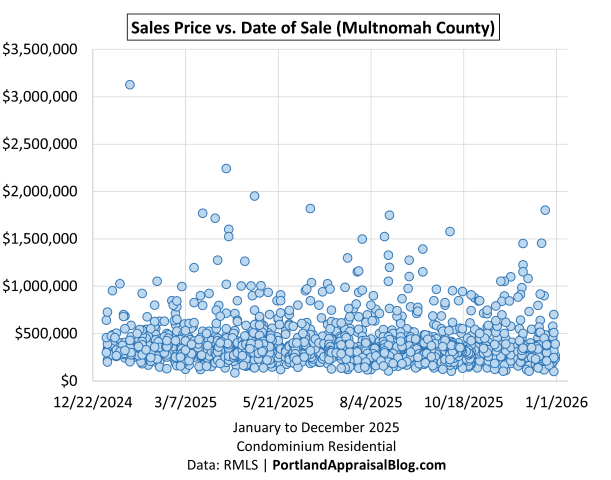
The full time-series view of sales prices in Multnomah County for 2025 shows a market that remained active year-round, with occasional high-end transactions above $1 million scattered throughout the period but representing only a small fraction of total volume. These outliers—primarily in premium urban core locations such as the Pearl District, Downtown, and South Waterfront—demonstrate that luxury demand persisted despite broader softening pressures.
Zooming in on sales priced at $800,000 or less we have:
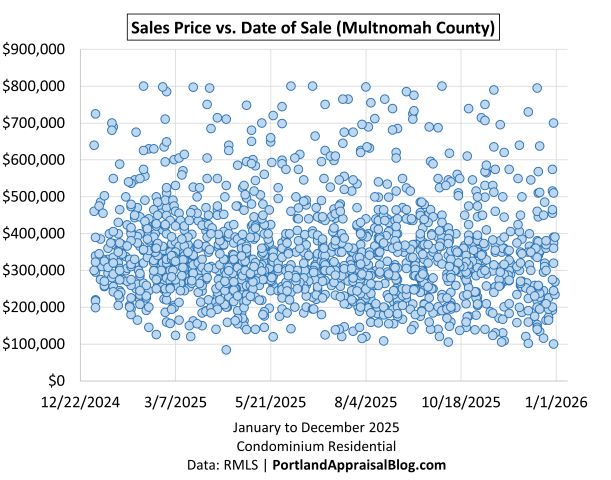
The $800,000 or less segment accounts for the vast majority of Multnomah County condominium transactions. A dense horizontal band of activity is concentrated in the $200,000–$500,000 range across all months. It is at this scale a pattern of gradually lower prices is evident. The downward tilt of the core band aligns with the modest price declines observed in the aggregate data (-1.49% median, -3.37% PPSF) and reflects how elevated interest rates and rising HOA dues continued to temper upward pricing momentum in the urban core.
Washington County 2025 Stats
Washington County, encompassing suburban areas such as Beaverton, Hillsboro, Tigard, and Tualatin, experienced the sharpest softening among the major counties in 2025, with volume and price declines more pronounced than in Multnomah.
The table below summarizes key metrics for Washington County condominium residential sales in 2025 compared with 2024.
| Category | 2024 | 2025 | % Change |
|---|---|---|---|
| Total $ Volume | $189.1 Million | $168.8 Million | -10.74% |
| Average Price | $327,654 | $316,025 | -3.55% |
| Median Price | $325,000 | $305,000 | -6.15% |
| Avg SP/OLP | 96.60% | 94.18% | -2.50% |
| Avg PPSF (TSF) | $301.48 | $284.18 | -5.74% |
| Avg HOA Dues | $410.71 | $455.74 | +10.97% |
| Avg Age (Yrs) | 30.41 | 31.74 | +4.37% |
| Avg CDOM | 57.05 | 83.10 | +45.68% |
| Avg Total SF | 1,120 | 1,137 | +1.49% |
| Total # of Sales | 577 | 534 | -7.45% |
| # of New Constr. | 12 | 5 | -58.33% |
| # of REOs | 3 | 7 | +133.33% |
| # of Short Sales | 0 | 1 | — |
Condominium Residential | 2024 & 2025
Data: RMLS | PortlandAppraisalBlog.com
Washington County showed significant volume pressure (-7.45% sales, -10.74% dollar volume), with median price down -6.15% and PPSF declining -5.74%—steeper than regional and Multnomah figures. Cumulative days on market surged +45.7% to 83.10 days average, indicating prolonged exposure and increased buyer leverage in this suburban market. HOA dues rose +11.0% to $455.74 average, adding to monthly payment burdens. New construction fell sharply -58.3% to just 5 units, further limiting fresh supply. Distress indicators increased (REOs +133%, short sales from 0 to 1), though absolute numbers stayed small.
The following table shows the geographic distribution of condo sales in Washington County:
| City | Avg Price | Avg PPSF | # of Sales | % of Sales |
|---|---|---|---|---|
| Aloha | $310,000 | $260.94 | 1 | 0.19% |
| Beaverton | $300,209 | $278.94 | 194 | 36.33% |
| Forest Grove | $309,986 | $295.27 | 7 | 1.31% |
| Hillsboro | $336,103 | $288.19 | 90 | 16.85% |
| King City | $233,231 | $244.20 | 16 | 3.00% |
| Portland | $327,032 | $295.23 | 168 | 31.46% |
| Sherwood | $392,500 | $282.39 | 5 | 0.94% |
| Tigard | $362,840 | $283.77 | 25 | 4.68% |
| Tualatin | $288,613 | $262.89 | 28 | 5.24% |
| Avg/Sum | $316,025 | $284.18 | 534 | — |
Data: RMLS | PortlandAppraisalBlog.com
The county’s condo activity concentrated heavily in Beaverton (36% of sales) and Hillsboro (17%), with Portland mailing-address areas (unincorporated Washington County near the Multnomah line) contributing another 31%. This suburban focus, combined with external pressures such as Intel layoffs in Hillsboro, amplified selectivity and contributed to the county’s more pronounced softening compared to the urban core.
The following is a scatter plot of all Washington County condo sales in 2025 (sales price vs. date of sale):
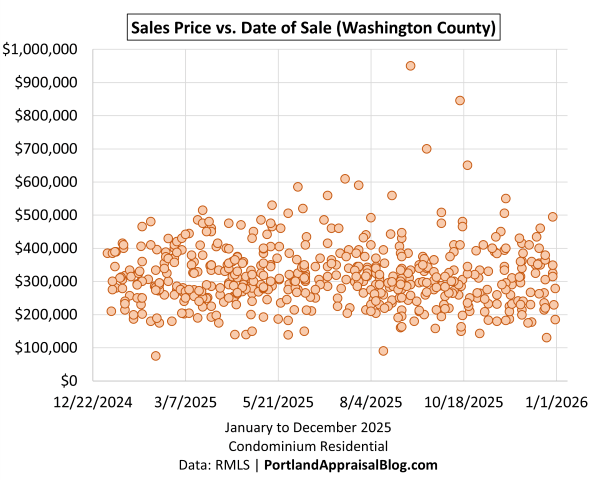
The scatter plot shows a bell curve, gradually rising from January to about July and then declining for the remainder of the year.
Clackamas County 2025 Stats
Clackamas County, covering southern and eastern suburban areas such as Lake Oswego, Oregon City, Milwaukie, West Linn, and Happy Valley, experienced moderate softening in 2025, with more pronounced volume declines than Multnomah but less severe than Washington County.
The table below summarizes key metrics for Clackamas County condominium residential sales in 2025 compared with 2024.
| Category | 2024 | 2025 | % Change |
|---|---|---|---|
| Total $ Volume | $106.6 Million | $86.22 Million | -19.10% |
| Average Price | $391,794 | $368,456 | -5.96% |
| Median Price | $350,000 | $335,000 | -4.29% |
| Avg SP/OLP | 95.24% | 94.60% | -0.68% |
| Avg PPSF (TSF) | $317.90 | $305.59 | -3.87% |
| Avg HOA Dues | $465.61 | $497.14 | +6.77% |
| Avg Age (Yrs) | 34.82 | 35.17 | +1.00% |
| Avg CDOM | 68.62 | 84.77 | +23.54% |
| Avg Total SF | 1,237 | 1,220 | -1.37% |
| Total # of Sales | 272 | 234 | -13.97% |
| # of New Constr. | 22 | 8 | -63.64% |
| # of REOs | 3 | 3 | 0.00% |
| # of Short Sales | 0 | 0 | — |
Condominium Residential | 2024 & 2025
Data: RMLS | PortlandAppraisalBlog.com
Clackamas County saw significant volume pressure (-13.97% sales, -19.10% dollar volume), with median price down -4.29% and PPSF declining -3.87%—declines more pronounced than in Multnomah but less severe than in Washington. Cumulative days on market rose +23.5% to 84.77 days average, indicating increased buyer selectivity in this suburban market. HOA dues increased +6.8% to $497.14 average, adding to monthly payment burdens but rising less sharply than in urban Multnomah. New construction fell -63.6% to just 8 units, further limiting fresh supply. Distress indicators remained stable (REOs flat at 3, short sales zero).
The following table shows the geographic distribution of condo sales in Clackamas County:
| City | Avg Price | Avg PPSF | # of Sales | % of Sales |
|---|---|---|---|---|
| Happy Valley | $363,516 | $257.12 | 20 | 8.55% |
| Lake Oswego | $434,585 | $336.28 | 67 | 28.63% |
| Milwaukie | $341,328 | $275.83 | 30 | 12.82% |
| Oregon City | $339,855 | $327.15 | 11 | 4.70% |
| West Linn | $306,791 | $268.83 | 37 | 15.81% |
| Wilsonville | $369,922 | $332.32 | 38 | 16.24% |
| Other | $336,920 | $302.85 | 31 | 13.25% |
| Avg/Sum | $368,456 | $305.60 | 234 | — |
Data: RMLS | PortlandAppraisalBlog.com
Activity concentrated in premium and mid-tier suburbs: Lake Oswego led with 67 sales (29% of county total) at the highest average price ($434,585) and PPSF ($336.28), followed by Wilsonville, West Linn, Milwaukie, and Happy Valley. Outer and smaller areas (grouped as “Other”) contributed only 31 sales combined, reflecting thinner demand in those locales and contributing to the county’s overall softness.
The following is a scatter plot of all Clackamas County condo sales in 2025 (sales price vs. date of sale):
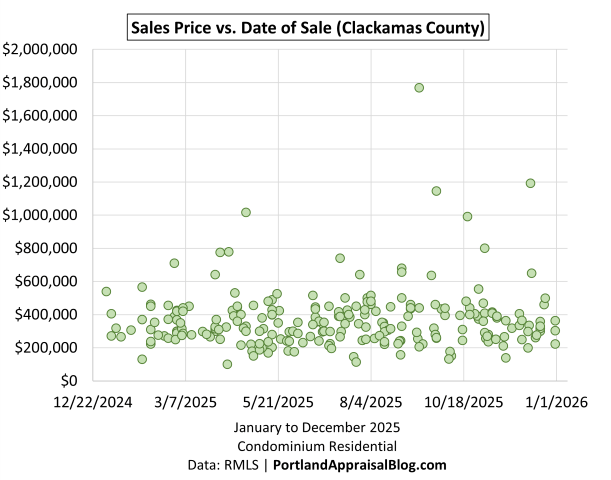
The overwhelming majority of sale occurred in the $200k-$400k band. The graph also shows there is a small luxury condo market present in the county
Yamhill County 2025 Stats
Yamhill County, while more rural, had its condominium activity centered on McMinnville and Newberg. The county remained a very low-volume condominium market in 2025, with only 15 sales representing less than 0.6% of regional activity.
The table below summarizes key metrics for Yamhill County condominium residential sales in 2025 compared with 2024.
| Category | 2024 | 2025 | % Change |
|---|---|---|---|
| Total $ Volume | $5.87 Million | $5.38 Million | -8.36% |
| Average Price | $293,635 | $358,800 | +22.19% |
| Median Price | $259,950 | $340,000 | +30.79% |
| Avg SP/OLP | 96.49% | 95.27% | -1.27% |
| Avg PPSF (TSF) | $271.63 | $256.67 | -5.50% |
| Avg HOA Dues | $293.84 | $408.00 | +38.85% |
| Avg Age (Yrs) | 32.60 | 37.47 | +14.93% |
| Avg CDOM | 54.40 | 120.00 | +120.59% |
| Avg Total SF | 1,091 | 1,415 | +29.72% |
| Total # of Sales | 20 | 15 | -25.00% |
| # of New Constr. | 0 | 0 | — |
| # of REOs | 0 | 0 | — |
| # of Short Sales | 0 | 0 | — |
Condominium Residential | 2024 & 2025
Data: RMLS | PortlandAppraisalBlog.com
Yamhill County experienced a significant volume decline (-25.0% sales, -8.36% dollar volume) on a very small base. Median price increased +30.8% to $340,000 and average price +22.2% to $358,800 (skewed by larger units; PPSF fell -5.5% to $256.67). Cumulative days on market doubled to 120 days average, signaling very low demand and prolonged exposure. HOA dues rose sharply +38.9% to $408 average—the highest relative increase among counties, though starting from a low base. No new construction or distress sales occurred.
The following table shows the geographic distribution of condo sales in Yamhill County:
| City | Avg Price | Avg PPSF | # of Sales | % of Sales |
|---|---|---|---|---|
| McMinnville | $404,400 | $255.05 | 10 | 66.67% |
| Newberg | $267,600 | $259.93 | 5 | 33.33% |
| Avg/Sum | $358,800 | $256.68 | 15 | — |
Data: RMLS | PortlandAppraisalBlog.com
The following is a scatter plot of all Yamhill County condo sales in 2025 (sales price vs. date of sale):
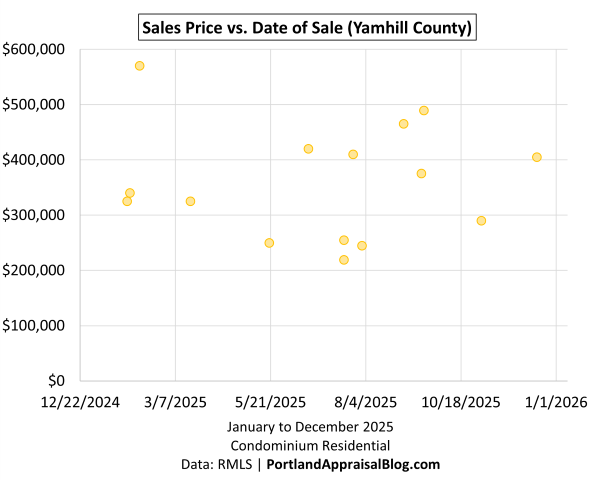
Most activity stayed within $200k-$500k.
Columbia County 2025 Stats
Columbia County, while largely rural does have some activity in the cities of St. Helens and Scappoose. The county remained a very low-volume condominium market in 2025, with only 5 sales representing less than 0.3% of regional activity.
The table below summarizes key metrics for Columbia County condominium residential sales in 2025 compared with 2024.
| Category | 2024 | 2025 | % Change |
|---|---|---|---|
| Total $ Volume | $710,000 | $1.47 Million | +107.36% |
| Average Price | $236,667 | $294,450 | +24.42% |
| Median Price | $240,000 | $290,650 | +21.10% |
| Avg SP/OLP | 94.21% | 97.23% | +3.21% |
| Avg PPSF (TSF) | $267.81 | $267.81 | -0.00% |
| Avg HOA Dues | $294.33 | $227.50 | -22.71% |
| Avg Age (Yrs) | 17.33 | 30.00 | +73.08% |
| Avg CDOM | 146.00 | 79.60 | -45.48% |
| Avg Total SF | 935 | 1,100 | +17.69% |
| Total # of Sales | 3 | 5 | +66.67% |
| # of New Constr. | 1 | 0 | -100.00% |
| # of REOs | 0 | 0 | — |
| # of Short Sales | 0 | 0 | — |
Condominium Residential | 2024 & 2025
Data: RMLS | PortlandAppraisalBlog.com
Columbia County saw minimal activity (5 sales, up from 3 in 2024), with all transactions confined to Scappoose and St. Helens. Median price rose +21.1% to $290,650 and average price +24.4% to $294,450 on the small sample, while PPSF remained flat at $267.81. Cumulative days on market improved -45.5% to 79.60 days average, though absolute demand stayed negligible. HOA dues declined -22.7% to $227.50 average (on very small reported cohort). No new construction or distress sales occurred in 2025.
These figures should be interpreted cautiously due to the extremely low volume—a single transaction can materially shift averages. Overall, Columbia County reflects the sparse nature of condominium inventory in largely rural counties.
The following table shows the geographic distribution of condo sales in Columbia County:
| City | Avg Price | Avg PPSF | # of Sales | % of Sales |
|---|---|---|---|---|
| Scappoose | $310,125 | $286.45 | 2 | 40.00% |
| St. Helens | $284,000 | $255.40 | 3 | 60.00% |
| Avg/Sum | $294,450 | $267.82 | 5 | — |
Data: RMLS | PortlandAppraisalBlog.com
The following is a scatter plot of all Columbia County condo sales in 2025 (sales price vs. date of sale):
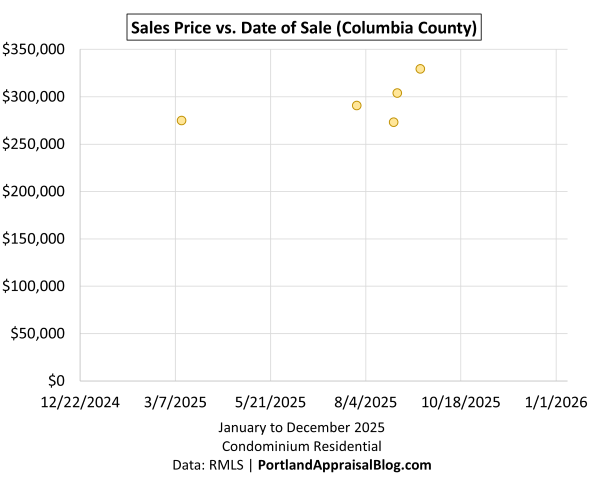
The five sales tightly clustered between $250k-$350k.
Hood River County 2025 Stats
Hood River County, a rural and resort-oriented area in the eastern part of the service region, remained a very low-volume condominium market in 2025, with only 7 sales representing less than 0.3% of regional activity. All transactions occurred within the City of Hood River proper—the only area with active condo inventory in the county.
The table below summarizes key metrics for Hood River condominium residential sales in 2025 compared with 2024.
| Category | 2024 | 2025 | % Change |
|---|---|---|---|
| Total $ Volume | $4.45 Million | $3.94 Million | -11.39% |
| Average Price | $556,213 | $563,286 | +1.27% |
| Median Price | $564,350 | $478,000 | -15.30% |
| Avg SP/OLP | 91.94% | 97.07% | +5.58% |
| Avg PPSF (TSF) | $425.51 | $520.97 | +22.43% |
| Avg HOA Dues | $386.25 | $478.60 | +23.91% |
| Avg Age (Yrs) | 28.63 | 26.57 | -7.17% |
| Avg CDOM | 85.25 | 99.57 | +16.80% |
| Avg Total SF | 1,327 | 1,118 | -15.77% |
| Total # of Sales | 8 | 7 | -12.50% |
| # of New Constr. | 0 | 2 | — |
| # of REOs | 0 | 0 | — |
| # of Short Sales | 0 | 0 | — |
Condominium Residential | 2024 & 2025
Data: RMLS | PortlandAppraisalBlog.com
Hood River County saw minimal activity (7 sales, down from 8 in 2024), with median price declining -15.3% to $478,000 while average price edged up +1.3% to $563,286 (small-sample volatility; PPSF increased +22.4%, with smaller units sold). Cumulative days on market rose +16.8% to 99.57 days average, and HOA dues climbed +23.9% to $478.60. Two new construction sales appeared in 2025 (from zero the prior year), but overall demand remained negligible. No distress sales occurred.
These figures should be interpreted cautiously due to the extremely low volume—individual transactions can materially shift averages. Overall, Hood River County reflects the sparse nature of condominium inventory in rural/resort areas.
The following is a scatter plot of all Hood River County condo sales in 2025 (sales price vs. date of sale):
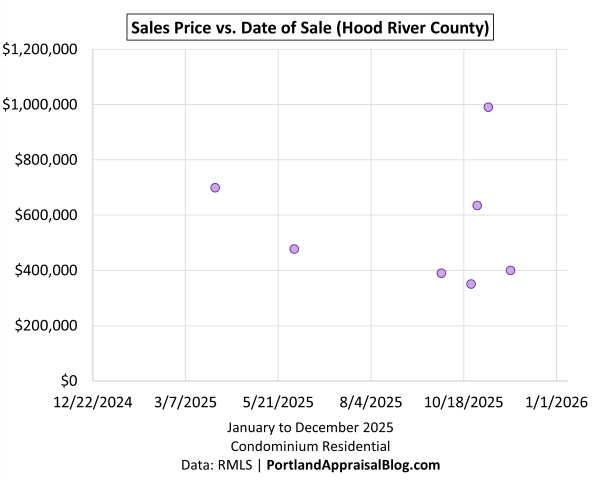
Sales activity largely remained near $400k with a few data points above $600k.
Closing Thoughts
The 2025 Portland Region condominium market reflected a continuation of the gradual softening that has defined the segment in recent years. Prices declined modestly overall, with average and median figures down year-over-year, while time-on-market metrics lengthened substantially and inventory levels rose into clearly buyer-favored territory. Rising HOA dues and persistently high interest rates amplified monthly payment pressures, narrowing buyer pools and increasing selectivity—particularly in complexes with elevated carrying costs. Yet the market remained functional: transactions continued at a steady pace, volume held relatively close to the prior year, and affordability persisted at a moderate level relative to the HUD MSA median household. This was not a collapse, but a measured shift toward conditions favoring buyers, with the most pronounced effects visible in extended marketing times, higher months of supply, and selective pricing behavior across the region.
From an appraisal perspective, the year’s trends underscore several practical realities. The tight size distribution and flat PPSF-vs-SF relationship in condos make PPSF declines a more direct indicator of price softness than in detached homes, where compositional effects often play a much bigger role. Prolonged CDOM and elevated MOS highlight the need for careful time and motivation adjustments when selecting and weighting comparables, especially in segments with high HOA dues or project-specific challenges. The bifurcation between low-dues “winners” (small infill, minimal associations) and high-dues “losers” (premium or challenged complexes) further emphasizes the importance of in-complex comps to neutralize carrying-cost variance and reduce adjustment subjectivity.
Looking ahead, the condo market’s trajectory will likely depend on the trajectory of interest rates and ongoing pressures on HOA dues (insurance, reserves, major repairs). While the segment has shown resilience in the urban core—where demand remains anchored to location and lifestyle—suburban and rural areas face greater vulnerability to supply constraints and buyer caution. The persistent oversupply in key urban condo submarkets like the Pearl District and Portland Downtown suggests that stabilization may take time, but the market’s continued functionality—even in a challenging environment—indicates that condos remain a viable housing option for many in the region.
What trends do you expect to see in 2026? I’d love to hear your thoughts—feel free to reply here or reach out directly.
Sources & Further Reading
All data presented in this annual review is sourced directly from RMLS and has been subjected to my rigorous cleaning and validation process to ensure reliability for condominium residential analysis in the six-county Portland Region. The trends, comparisons, and commentary are the result of original appraisal expertise and independent analysis—not aggregated from secondary sources or news summaries.
- The Portland Region – Six-County Market Area Overview: Portland Appraisal Blog
- RMLS Data Challenges: Portland Appraisal Blog
- HUD Portland-Vancouver-Hillsboro, OR-WA MSA: Median Household Income
- The 2024 Portland Region Condominium Housing Market in Review: Portland Appraisal Blog
- External Obsolescence in Hillsboro — Residential Market Response to Intel’s 2024–2025 Workforce Reductions: Portland Appraisal Blog
- Portland Affordability Index – PABAI: A Realistic Housing Qualification Metric for the Portland Region: Portland Appraisal Blog

Coda
Thanks for reading—I hope you found a useful insight or an unexpected nugget along the way. If you enjoyed the post, please consider subscribing for future updates.
Are you an agent in Portland who wonders why appraisers always do “x”?
A homeowner with questions about appraiser methodology?
If so, feel free to reach out—I enjoy connecting with market participants across Portland and the surrounding counties, and am always happy to help where I can.
And if you’re in need of appraisal services in Portland or anywhere in the Portland Region, we’d be glad to assist.
