

We are about to close out Q3 2025, but let’s take a look back and see how the Portland Region single-family detached home market performed in Q2 2025 versus Q2 2024.
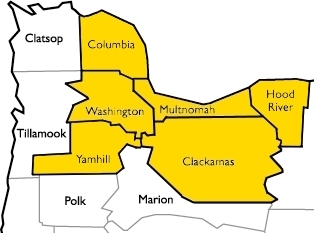
Let’s define the Portland Region as the following six counties: Columbia, Clackamas, Hood River, Multnomah, Washington, and Yamhill—essentially all counties contiguous with Portland’s home county of Multnomah, plus Yamhill.
DATA HOUSEKEEPING
The information in this post will be based on properties that sold on the open market, defined as listed in RMLS, the primary multiple listing service for the Portland Region. The data was parsed with tools created by the blog author to weed out/correct, among other things, listing errors and misclassifications (e.g. land or condominium sales in the single-family category). RMLS has a listing category, SNL, “Sold Not Listed,” that allows agents to put properties that were sold off market into the database. Those properties have been excluded from the following analyses.
Portland Region 2025 Q2 Overview

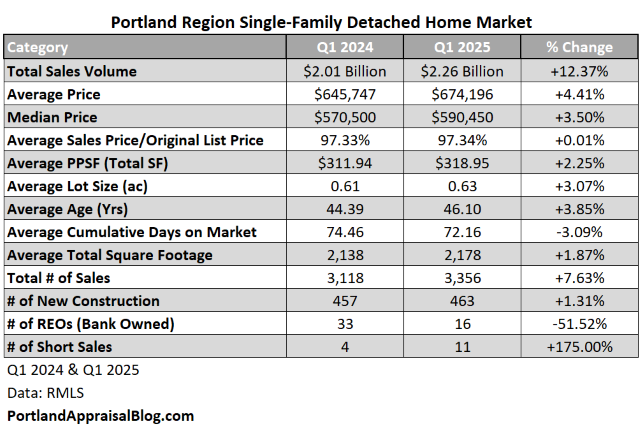
Q2 2025 was nearly the same in most important metrics. The following table compares the two quarters:
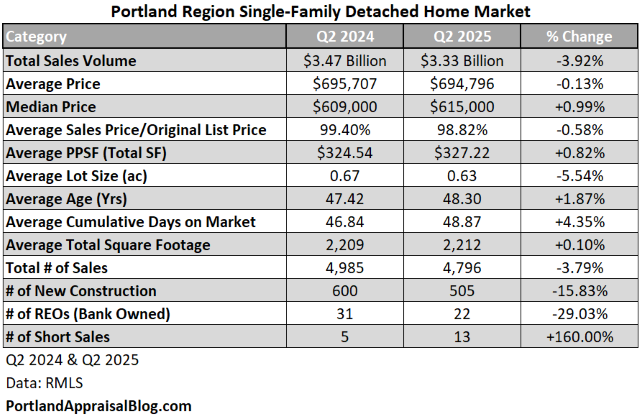
Not a lot changed from Q2 2024 to Q2 2025. The total sales volume dollar amount was slightly down in the second quarter versus the previous year. The 3.9% drop almost perfectly mirrors the drop in the number of sales.
The average home price in Q2 2025 was $694,796, which is almost identical to the average price in Q2 2024. A nearly $700,000 price tag continues to challenge median-income earners in the Portland region.
The composition of the sales remained steady; the average lot size decreased by 5.5% and the average home size barely changed at all. Homes were, on average, about 48 years old. There was a noticeable drop in the number of new construction sales (approximately 16%)—the high interest rate environment continues to weigh on the market.
Distressed sales, as a whole, were almost the same in the second quarter of 2025 compared to the second quarter of 2024, with one fewer occurrence. REOs and short sales represented just 0.73% of the market.
Let’s parse the data with some visuals.
SALES VOLUME
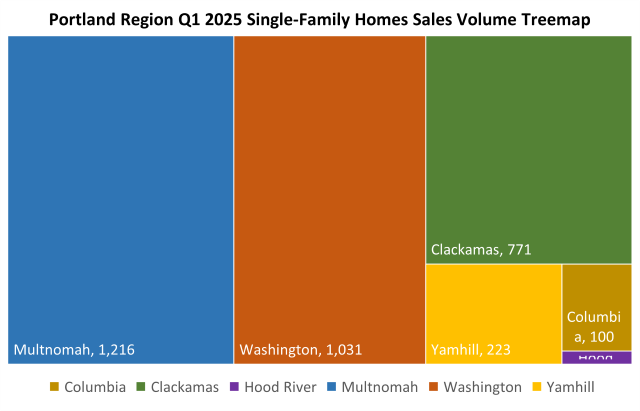
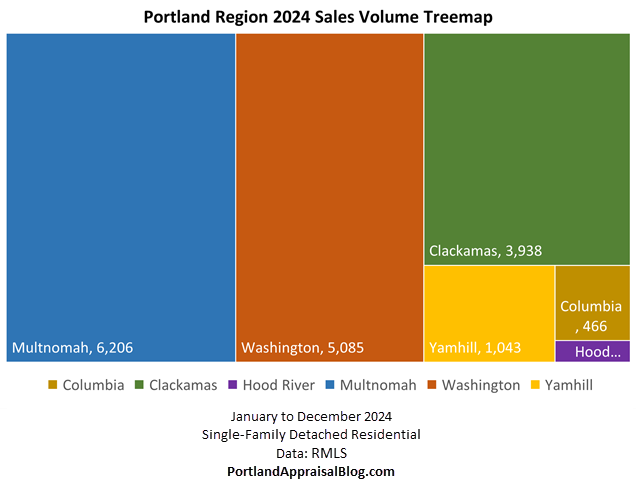
The following is a treemap of sales volume in the Portland Region for Q2 2025:

Multnomah County had the most sales, representing nearly 39% of the market. Clackamas, Multnomah, and Washington counties (the “Big Three” of the area) comprised the bulk of the housing market, with nearly 91% of the volume.
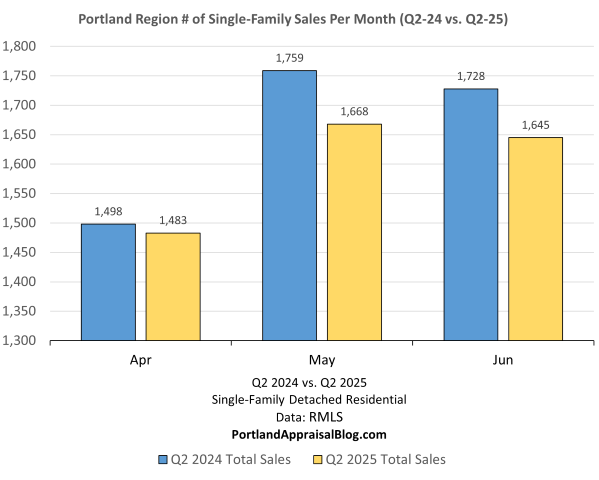
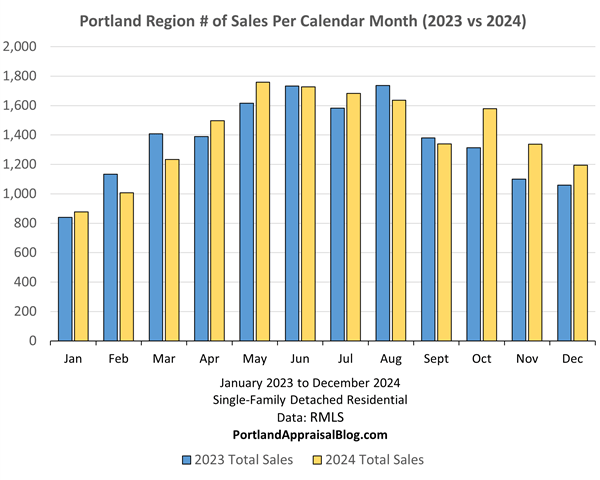
Sales volume was near parity in April, but Q2 2025 lagged behind Q2 2024 for the months of May and June:
SALES PRICE
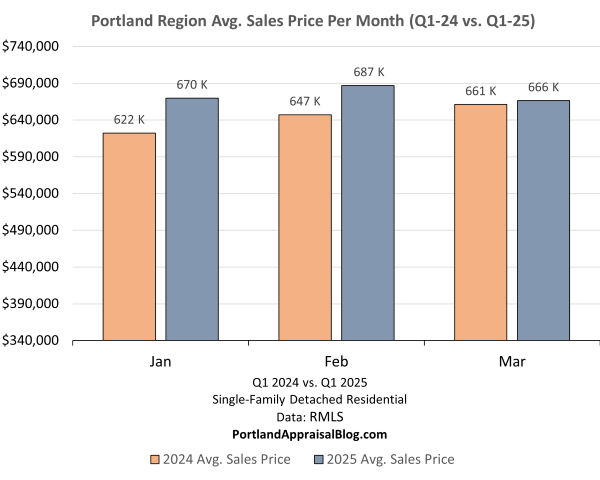
Q2 2025 was just a sliver below Q2 2024 for April and May and took the crown in June. The average of the three months only placed Q2 2025 about $1,000 below Q2 2024:

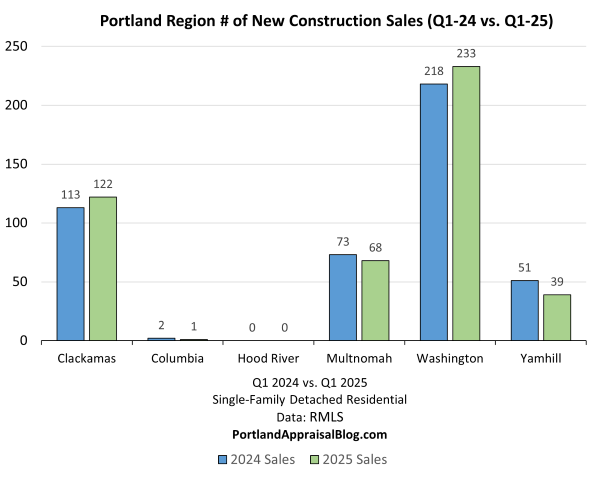
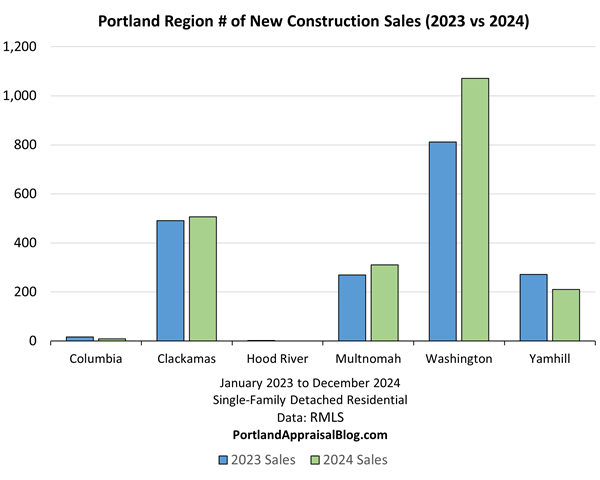
NEW CONSTRUCTION
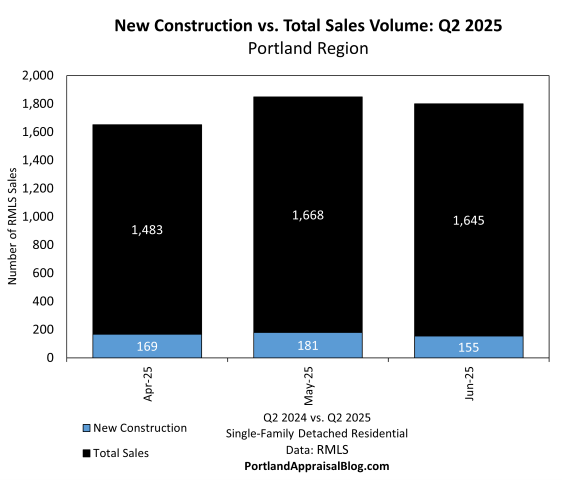
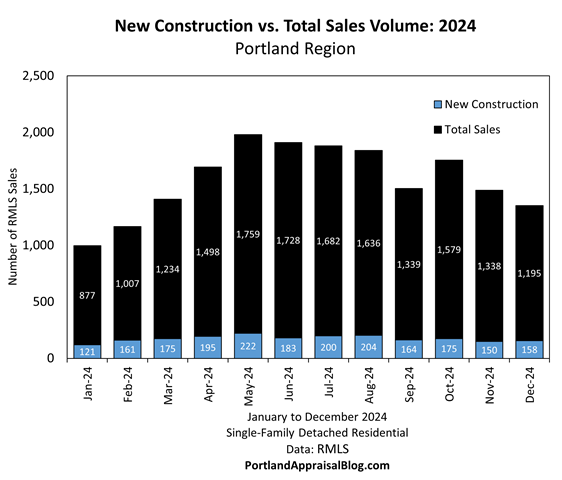
New construction was 10.5% of the overall market in Q2 2025:
2024 beat 2025 in most counties, with only trivial exceptions coming from Columbia and Hood River:

Washington County dominated the new construction market at 54%. Clackamas County took second place with about 23% of the market and Multnomah came in third at 16%. The Big Three accounted for 93% of the new construction market.
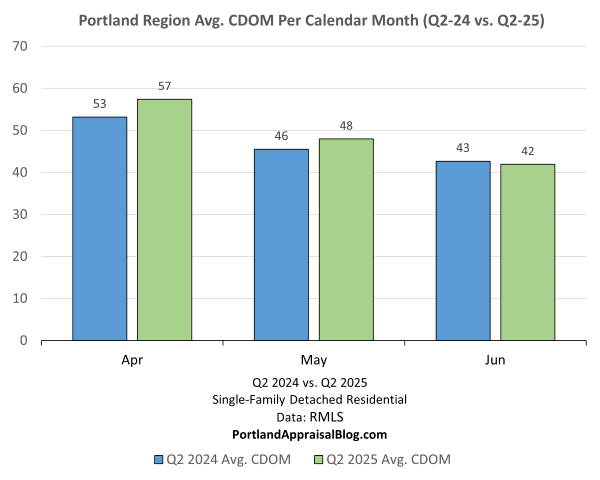
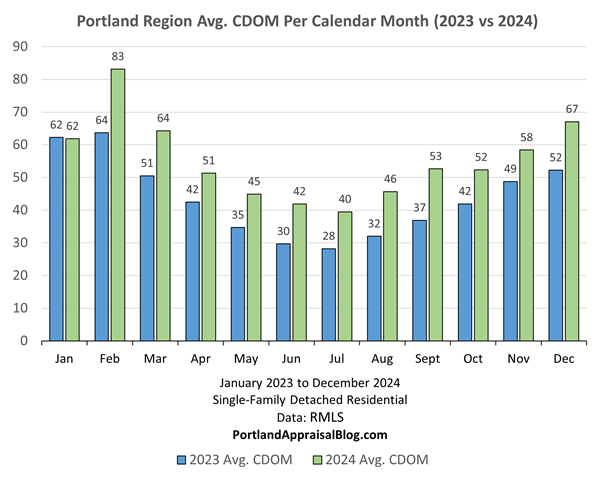
CUMULATIVE DAYS ON MARKET
The average cumulative days on market was up in Q2 2025 two months out of three compared to Q2 2024. The overall rise was modest, averaging approximately 2 additional days for the quarter compared to the previous year:
MISC STATS
Before concluding our overview of the Portland Region as a whole, let’s look at some miscellaneous stats:

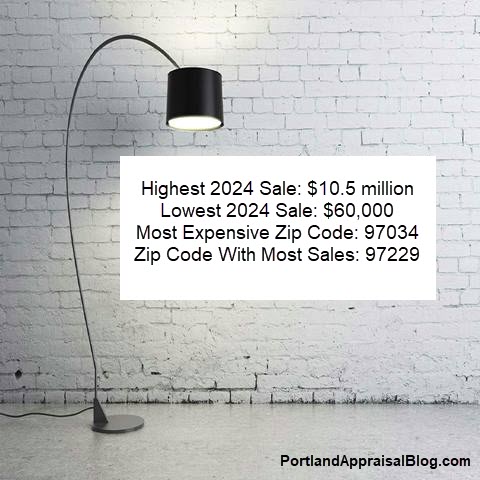
The most expensive home that sold on the open market in the Portland Region was a lakefront property located on Oswego Lake. The home sold for $4,500,000, has four bedrooms, four full bathrooms and one half bathroom, is on 0.19 acres and is 6,337 sq. ft. Photos of the property are currently available online and may be viewed here.
The least expensive home was a fixer located in Amity, a city in Yamhill County. The home has rented at the time of the sale, but no interior photos were published online. The home is 1,528 sq. ft. and has a 0.21-acre lot. Exterior photos of the property are currently available online and may be viewed here.
The largest home sold in Q2 2025 was a 9,500-sq. ft. residence that is currently used as a bed and breakfast. The Franziska Haus B&B has 10 bedrooms and 10 bathrooms. The property is situated in Dundee, Oregon, providing convenient accommodations for visitors looking to do wine tasting in the area. The B&B could potentially be used as a private residence with little to no alteration of the interior. Photos of the property are currently available online and may be viewed here.
The smallest home sold in Q2 2025 was a property in Dayton, Oregon. The home is 460 sq. ft. and sits on 4.9 acres. The home is really just a functional apartment attached to one of the two large shops on the site. It is very likely the new owner will be constructing a new residence and turning the apartment into an accessory dwelling unit. Photos of the property are currently available online and may be viewed here.
The property with the largest lot that sold in Q2 2025 is located in North Plains, Oregon. The property has a 90.9-acre lot with a 4,335 sq. ft. home. Most of the lot is sloped and heavily forested. Photos of the property are currently available online and may be viewed here.
Finally, the last miscellaneous Q2 2025 stat belongs to a home that took a cumulative total of 1,047 days to sell. The home is 6,403 sq. ft. and has a 0.85-acre lot. The property is located in an unincorporated part of Multnomah County, south of the City of Portland. The home has good views of the city. The property was listed on 05/19/2022 and was on the market on and off until it sold on 06/06/2025. The initial list price was $3,750,000 and it closed for $2,938,750 as a cash sale. Photos of the property are currently available online and may be viewed here.
Let’s wrap up this post with a quick look at the six individual counties comprising the Portland Region. We will examine them in the order of largest number of sales to the smallest.
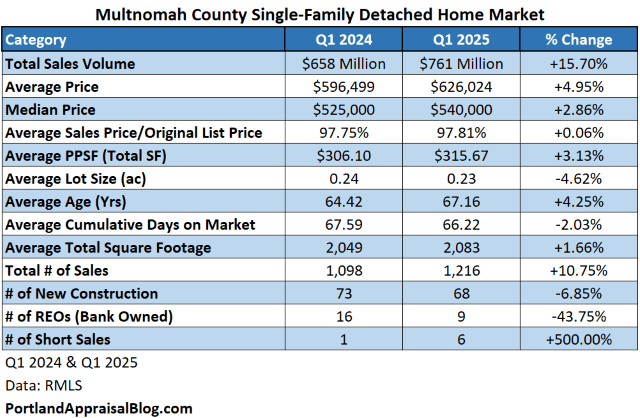
Multnomah County Q2 2025 Stats
Multnomah County contains most of the City of Portland. (Very tiny portions of the City of Portland are located in Clackamas and Washington counties.) The following table summarizes important metrics for Multnomah County:

Multnomah County had an increase in the sales volume dollar amount despite the number of home sales being about the same quarter over quarter. The average and median sales prices are up partly due to an increase in the total square footage of homes selling and an average larger lot size. However, even accounting for that influence, Q2 2025 in Multnomah County was stronger than Q2 2024.
New construction was 4.4% of the Multnomah market, which is healthy given how mature the Portland market is; 59% of new construction was in the City of Portland and 30% was in the City of Gresham:
Distressed sales made up less than 1% of the Multnomah market n Q2 2025.
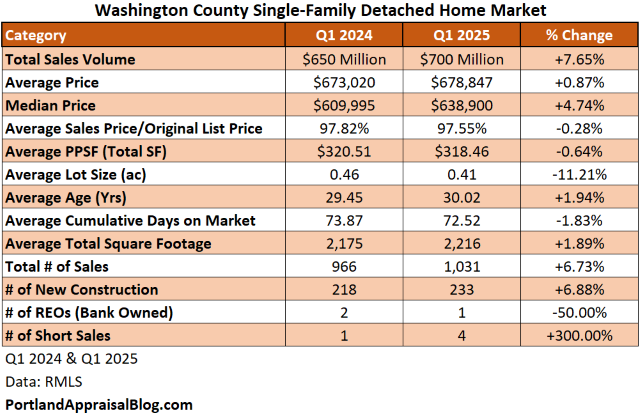
Washington County Q2 2025 Stats
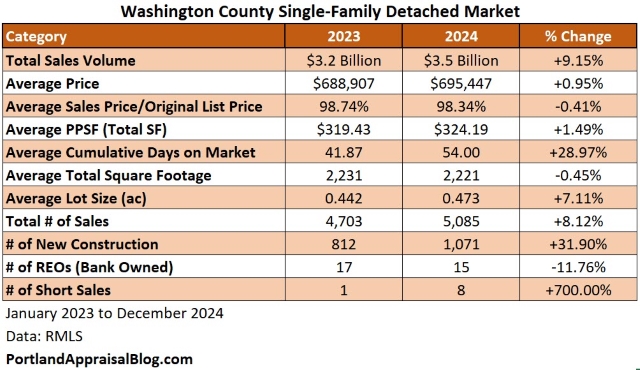
Washington County contains many properties with a Portland address that are outside official city limits and are under county control. The following table summarizes important metrics for Washington County:

The total sales volume dollar amount slipped below $1 billion in Q2 2025, this was due to a slump in sales, with the number of homes sold dropping almost 10%. Average and median prices were essentially unchanged from Q2 2024.
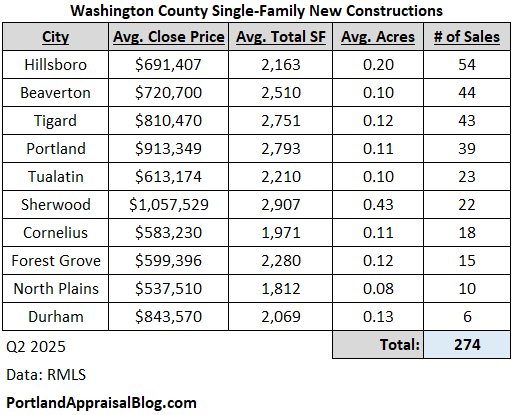
Washington County has the most new construction activity in the Portland Region. While fewer new construction homes closed in Q2 2025 compared to Q2 2024, the new homes comprised the same proportion of the market—nearly 20%.
The following table breaks down the activity by city:
Clackamas County Q2 2025 Stats
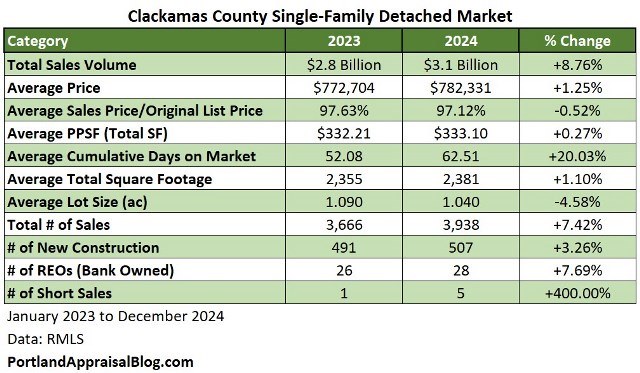
Clackamas County, while comprised of some urban cities, has many rural portions and houses on acreage lots. Commercial and hobby farming is common throughout the county. The following table summarizes important metrics for Clackamas County:
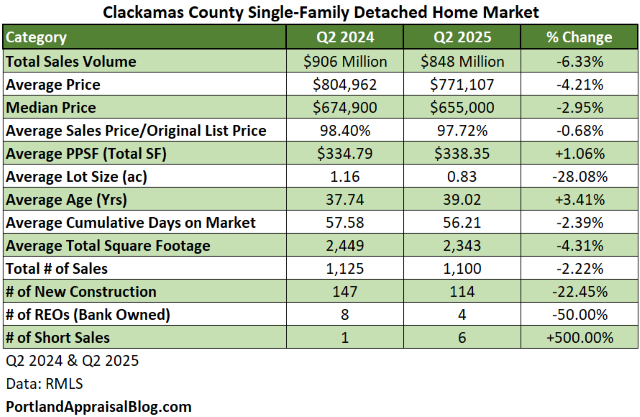
The sales volume dollar amount is down 6.3%, which is larger than the decline in the total number of sales (only 2%). Looking at the table, two stats jump out: the average lot size has declined 28% and the number of new constructions is down by over 22%. The change in the sales composition affected the aggregate stats.
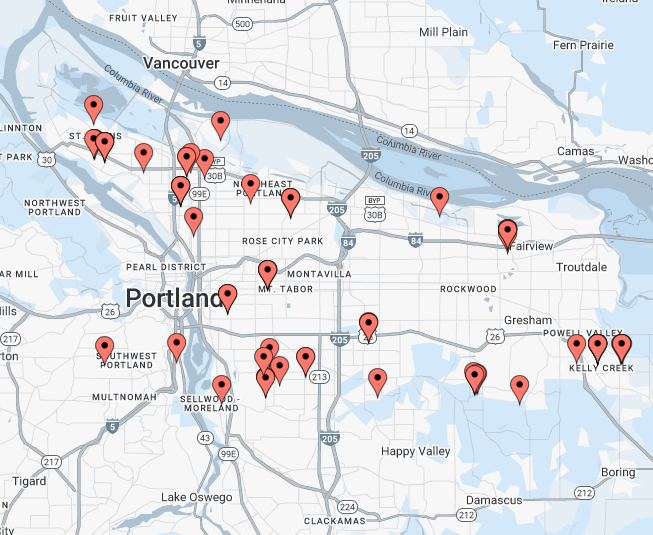
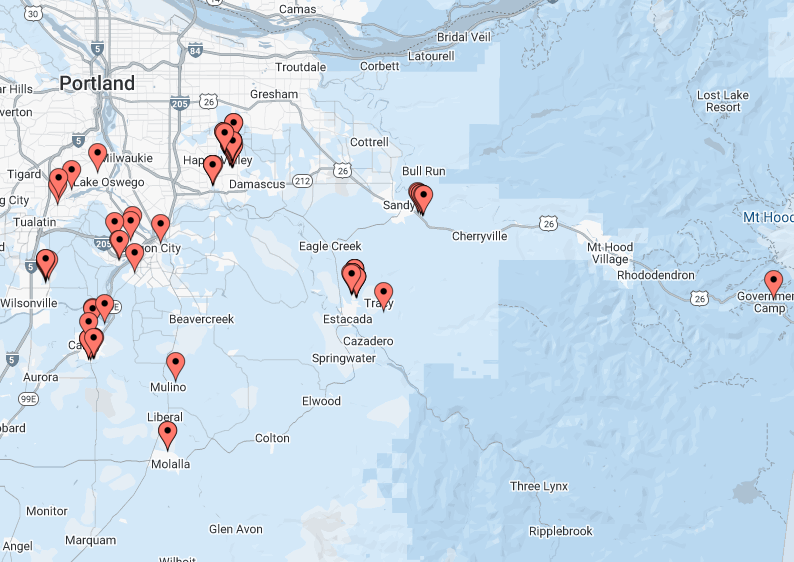
New construction activity in Clackamas County places it 2nd in the region. Most of the new sales occurred in four cities: Happy Valley, Estacada, Canby, and Sandy. The following is a map of the new construction activity in Clackamas County:
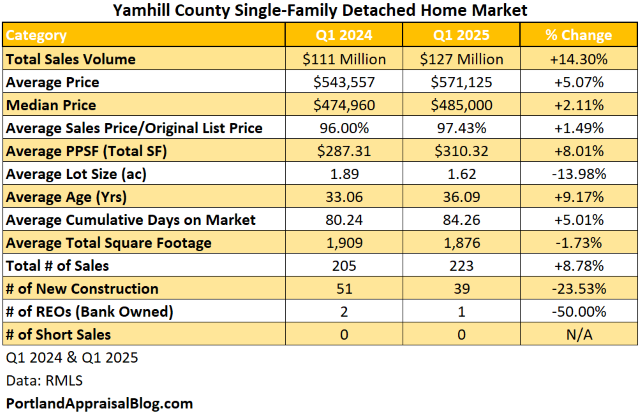
Yamhill County Q2 2025 Stats
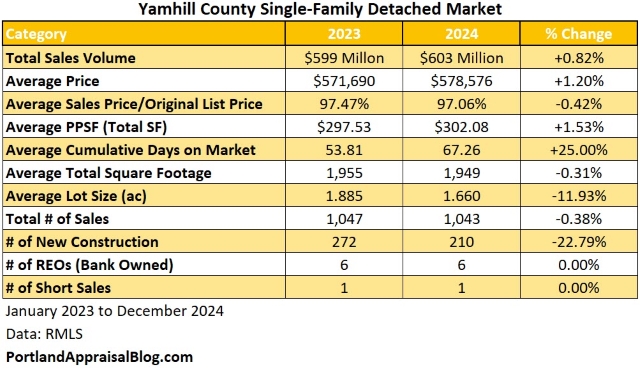
Yamhill County is known for its wineries and other agricultural products. The following table summarizes important metrics for Yamhill County:
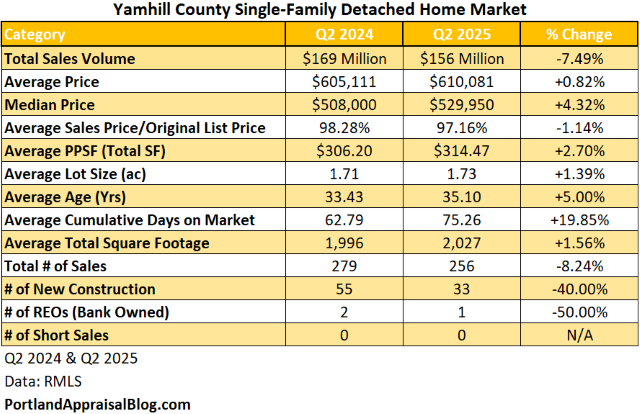
The total sales volume dollar amount decreased by 7.5% which parallels the drop in the total number of sales (8.2%). The county experienced a sharp drop-off in new construction (40%) and homes are spending about 13 more days on market to sell. Despite the negative statistics, the average and median prices of homes have increased, indicating that individual homes are performing a bit better than the same quarter last year.
Yamhill’s new construction market is much smaller than Washington, Clackamas, or Multnomah’s in absolute size but is higher proportionally than all save Washington. New homes made up almost 13% of the market. The following is a map of the new construction activity in Yamhill County:
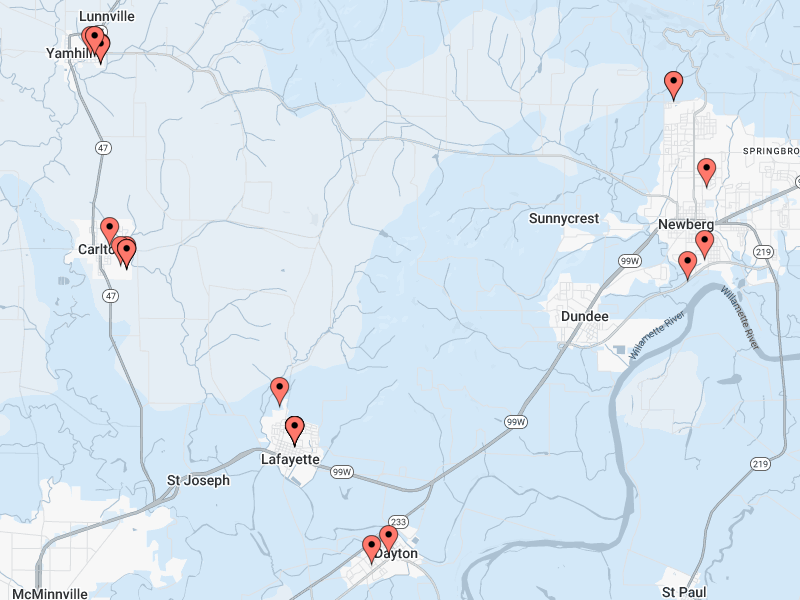
Most sales occurred in the city areas of Yamhill County.
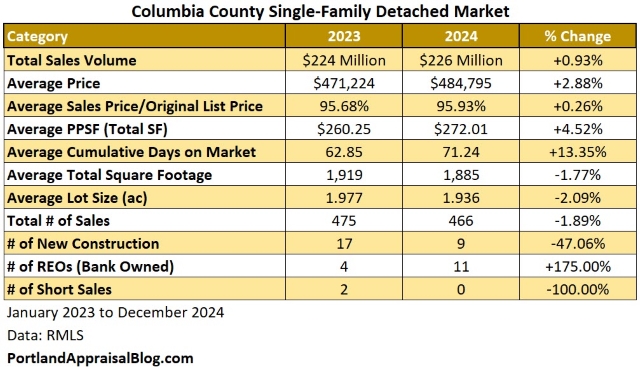
Columbia County Q2 2025 Stats
While this county is 688 square miles it only has a population of approximately 54,000 people. The county is known for timber and wood products. The following table summarizes important metrics for Columbia County:

The total sales volume dollar amount was up over 13% while the total number of sales was up 5.7%. Median and average sales prices also increased, in part due to slightly larger homes on bigger lots selling in 2025 versus its counterpart quarter in 2024. Cumulative days on market climbed nearly 22%, translating to homes taking nearly 16 days longer to find a buyer. Only 2 new construction homes were sold in Q2 2025.
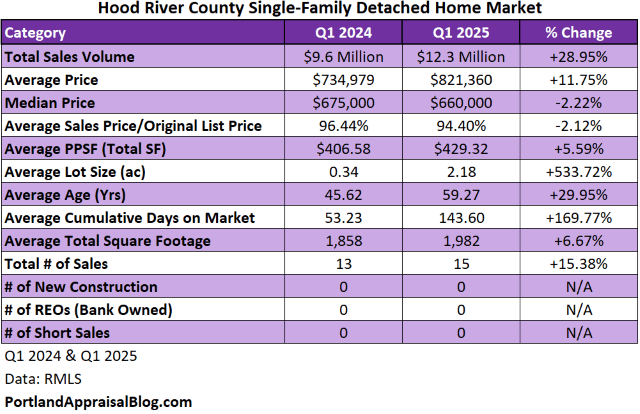
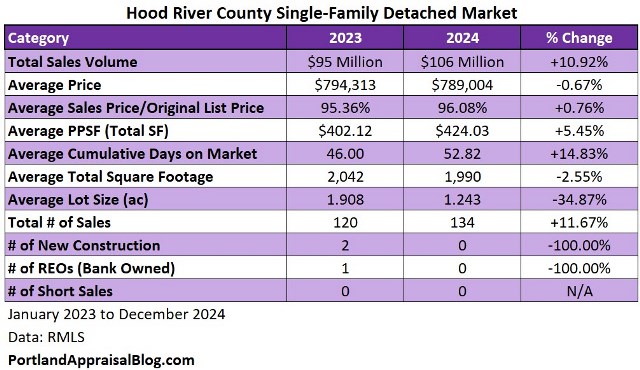
Hood River County Q2 2025 Stats
Hood River is the second smallest county in Oregon by area at 533 square miles. The population is estimated to be about 24,000 people. This county is known for its fruit products and outdoor recreational activities.
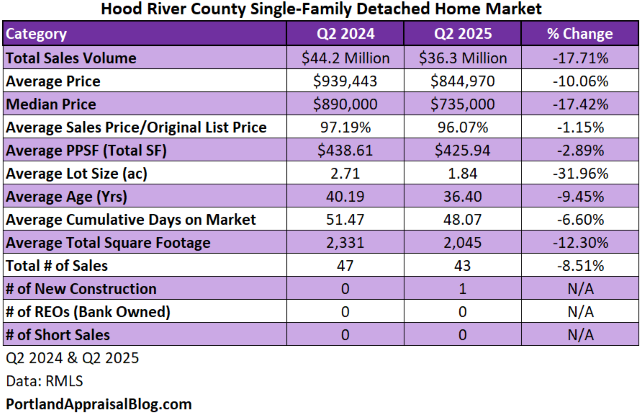
The sales volume dollar amount was down almost 18%, which is much higher than the decrease in the total number of sales (8.5%). Much of the decrease can be attributed to smaller homes on smaller lots selling in 2025 compared to Q2 2024. Due to the small market, Hood River often sees more volatility in price and property metrics quarter to quarter.
There was one new construction sale and no distressed sales.

That completes our look at the Portland Region Q2 2025 single-family market!
Thank you for reading the post! I hope you found some useful or interesting nugget of information. Please consider subscribing.
Question: Do you think Q3 2025 will be more of the same or will Q3 2025 outperform Q3 2024?
CODA
Are you an agent and wonder why appraisers always do “x”? Are you a homeowner who received a report and has one or two questions about appraisal terminology or methodology? If so, please feel free to contact me. I enjoy interacting with various market participants and am always happy to help out where I can! And if you are in need of any appraisal services, feel free to reach out to us!


