

Photo: M.O. Stevens via Wikimedia Commons (CC BY 3.0)
Hillsboro has long been synonymous with high-wage technology employment, anchored by Intel’s extensive campus network. When a dominant employer undergoes significant workforce reduction, the ripple effect can manifest as external obsolescence in the surrounding residential market—reduced buyer demand, extended marketing periods, and downward pressure on realized prices, particularly in segments most tied to that employment base.
Between late 2024 and the end of 2025, Intel eliminated more than 4,400 positions in Oregon, with the vast majority concentrated in Hillsboro facilities. This represented a roughly 20% contraction from peak local headcount. The timeline provides clear inflection points for analyzing market reaction.
Intel Oregon Workforce Reduction Timeline (Hillsboro-Focused)
- October 2024: Approximately 1,300 positions eliminated (separations beginning November 2024).
- July 2025: Roughly 2,400 additional positions cut across Ronler Acres, Jones Farm, Hawthorn Farm, and Aloha sites.
- November 2025: Further 669 roles removed, bringing the 2025 total above 3,100.
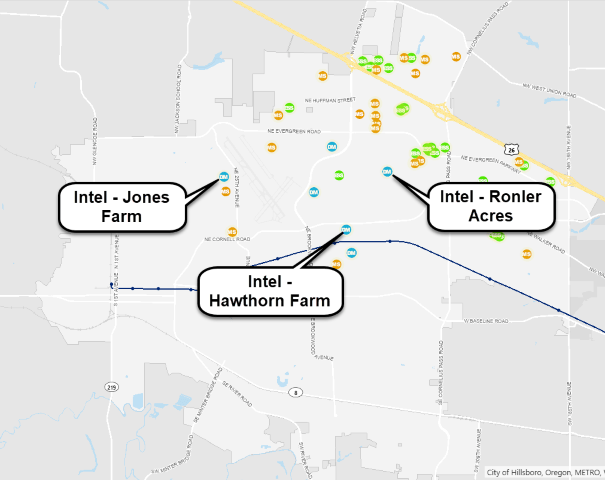
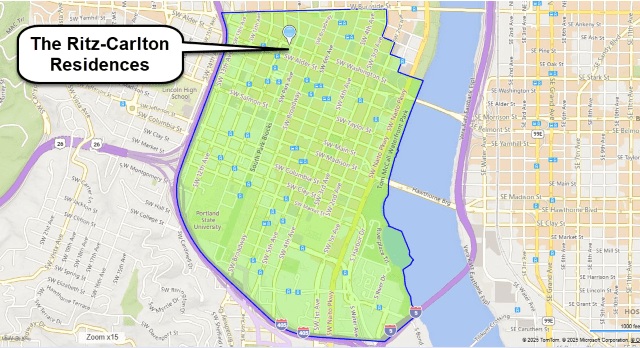
Via Hillsboro GIS
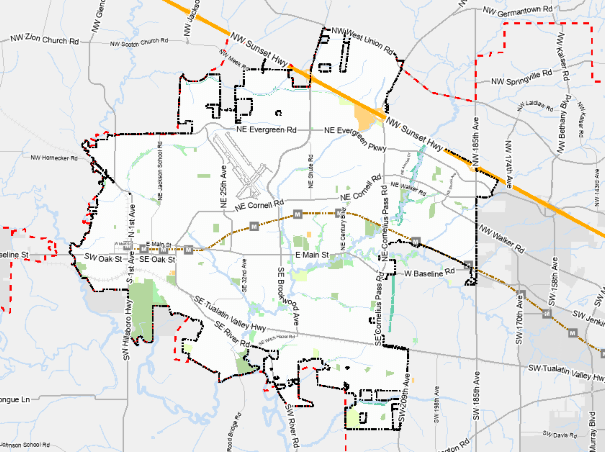
Via Hillsboro GIS
Annual Market Summary (Hillsboro Closed Sales, 2023–2025)
| Type | Year | # of Sales | Avg Price | Avg PPSF | Avg CDOM | SP/OLP % |
|---|---|---|---|---|---|---|
| Condo | 2023 | 90 | $366,533 | $299 | 25 | 99.12% |
| 2024 | 73 | $361,835 | $316 | 37 | 97.66% | |
| 2025 | 88 | $335,105 | $289 | 66 | 94.89% | |
| Attach. | 2023 | 208 | $465,801 | $305 | 31 | 99.02% |
| 2024 | 272 | $477,344 | $298 | 51 | 98.00% | |
| 2025 | 281 | $455,479 | $287 | 72 | 96.83% | |
| Detach. | 2023 | 732 | $589,096 | $314 | 39 | 98.52% |
| 2024 | 757 | $603,627 | $325 | 48 | 98.32% | |
| 2025 | 783 | $586,434 | $313 | 60 | 97.39% |
Data: RMLS | Portland Appraisal Blog
Data reflects single-family residential class properties within Hillsboro city limits (detached homes, attached townhomes/rowhomes, and condominiums).
Price Trends Reveal a Split Market
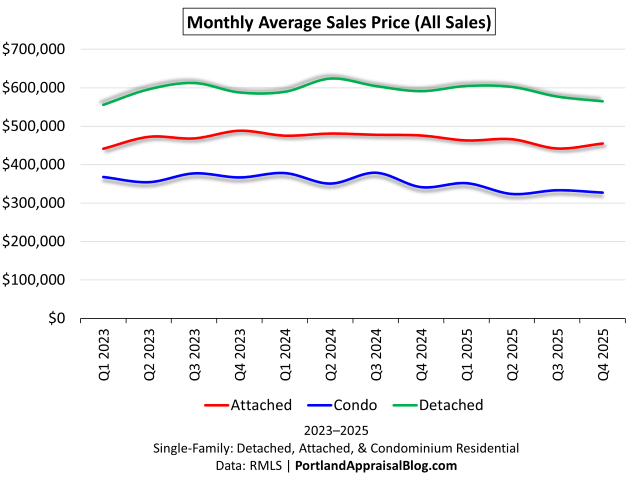
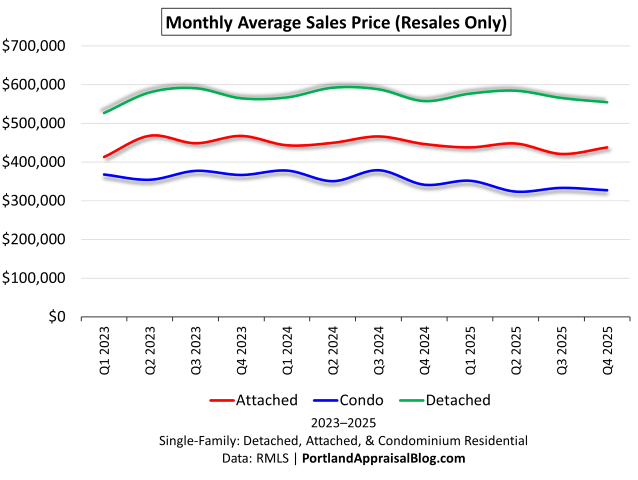
Some local year-end commentary described Hillsboro values as generally stable, citing modest average price gains and balanced overall inventory; this matches the annual market summary table above. However, if you peel back the onion a different picture emerges. The apparent stability reflects the continued delivery of new-construction projects—many planned and entitled well before Intel’s workforce reductions began. When new-construction sales are excluded, existing condominium and attached resale properties show consistent price declines and significantly longer marketing periods—evidence that the employment shock has already exerted measurable external obsolescence on resale stock. The broader market averages may feel the full effect in 2026 and beyond as pre-layoff development pipelines clear.
| Type | 2023 Avg Close | 2024 Avg Close | 2025 Avg Close | 2025 vs 2023 Change | 2025 Avg CDOM | SP/OLP 2025 |
|---|---|---|---|---|---|---|
| Condo | $366,533 | $361,835 | $335,105 | –8.6% | 66 days | 94.89% |
| Attach. | $449,270 | $452,930 | $435,573 | –3.0% | 56 days | 96.22% |
| Detach. | $568,134 | $578,012 | $570,170 | +0.4% | 50 days | 97.37% |
Data: RMLS | Portland Appraisal Blog
The Textbook Signal: Rising Cumulative Days on Market
Perhaps the clearest indicator of external obsolescence is the extension of marketing periods. Prolonged days on market with little to no price premium is a hallmark response to localized employment contraction.
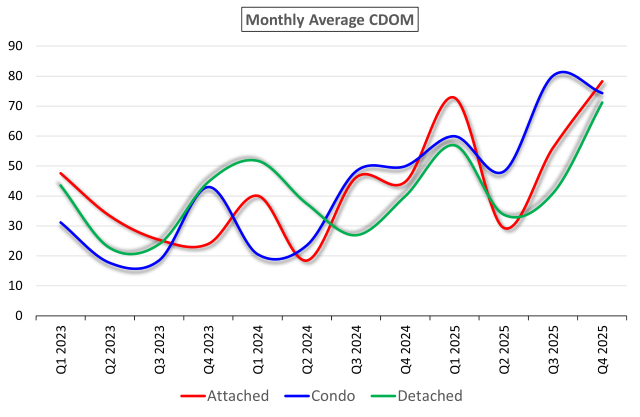
The extension of marketing periods in resale properties offers one of the clearest indicators of external obsolescence. Condominium resale led the trend with sharp increases beginning in mid-2024, followed closely by attached resale. Detached resale, initially more resilient, joined the upward trajectory decisively in late 2025. By Q4 2025, average cumulative days on market across all three resale segments converged in the 74–83 day range—a dramatic shift from the 20–40 day norms prevalent in 2023.
Key CDOM Inflection Points (Resale Properties)
| Type | Avg CDOM Q4 2024 | Avg CDOM Q4 2025 | Increase |
|---|---|---|---|
| Condominium | 50 days | 74 days | +48% |
| Attached | 61 days | 83 days | +36% |
| Detached | 48 days | 78 days | +63% |
Data: RMLS | Portland Appraisal Blog
The near-convergence at 74–83 days by year-end 2025 represents a dramatic shift from pre-2024 norms, when most segments averaged 20–40 days.
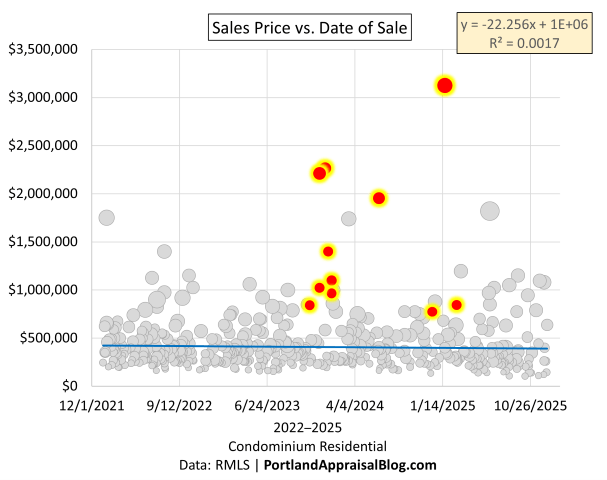
Individual Sale Behavior: No Premium for Extended Marketing Time
Scatter analysis of 2024–2025 closed sales reinforces the aggregate trend.
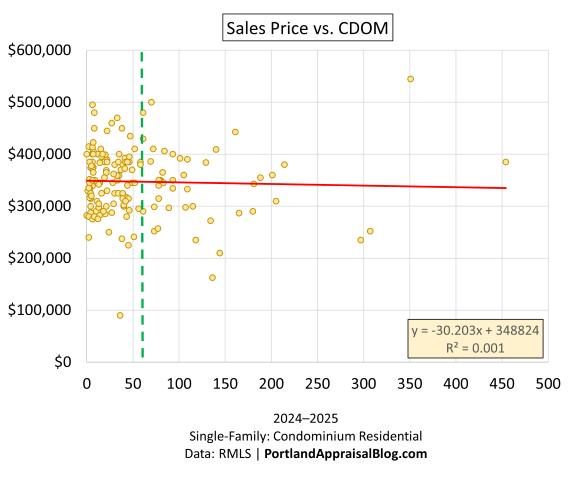
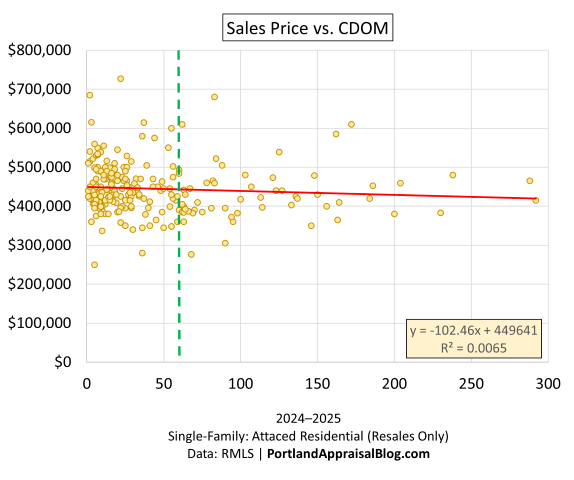
Both distributions exhibit essentially zero correlation between longer marketing time and higher achieved price—a buyer’s market signal where sellers concede on price rather than wait.
Upper-Tier Detached Vulnerability
| Year | # of Resales | Avg Resale Price | # of New Con | Avg New Con Price | % New Con |
|---|---|---|---|---|---|
| 2023 | 24 | $1,006,573 | 17 | $981,111 | 41% |
| 2024 | 24 | $964,685 | 28 | $969,004 | 54% |
| 2025 | 35 | $954,781 | 28 | $901,582 | 44% |
| Total | 83 | $972,592 | 73 | $945,687 | 47% |
Data: RMLS | Portland Appraisal Blog
Even within the more resilient detached segment, properties priced $800,000 and above—often appealing to higher-compensated technology professionals—displayed noticeable softening. Resale upper-tier homes closed at lower average prices in 2025 ($955,000) than in prior years, while new-construction sales in this bracket experienced even sharper erosion, averaging $902,000 in 2025—an 8.1% decline from the 2023 figure.
Appraiser Perspective: Practical Implications
The data presents several direct challenges in current Hillsboro residential appraisals:
- Comparable selection becomes more complex when pre-layoff and post-layoff sales coexist. Appraisers must prioritize recent closings and apply verifiable market condition (time) adjustments, particularly for condominium and attached resale comps.
- Reconciliation weighting should favor sales with similar motivation profiles; distressed or relocation-driven transactions carry greater weight in segments showing extended CDOM.
- Market condition (time) adjustments are warranted when comparable sales bracket the layoff timeline. Sales closing before mid-2024 often reflect stronger demand and may require negative adjustments when applied to current assignments to account for subsequent market erosion; more recent closings in condominium and attached resale segments typically need little or no adjustment, while pre-layoff comps may warrant downward support in reconciliation.
- New vs. resale distinction is critical in attached and upper-tier detached appraisals. Builder sales frequently achieve high sale-to-list ratios through incentives and concessions that are not always reflected in the recorded price, which can distort aggregate trends and make the overall market appear more stable than the resale segment suggests. Generally, appraisers compare new to new and resale to resale. The danger zone arises when comparing a 2–3 year-old near-new resale home to an actual new-construction sale; extensive efforts should be made to verify whether recent new-construction transactions included substantial concessions or favorable financing terms.
New construction accounted for 27.8% of all Hillsboro closed sales from 2023–2025—a notably high share that remained steady year-over-year. These deliveries largely reflect projects planned and entitled before Intel’s workforce reductions began. As that pre-layoff pipeline clears in the coming years, overall market averages may more closely mirror the resale trends observed here.
Lenders, homeowners, and real estate professionals active in Hillsboro should recognize that proximity to the semiconductor corridor no longer commands the same location premium it once did—at least in denser and higher-priced segments. The Portland Appraisal Blog will monitor how the tapering new-construction pipeline shapes broader metrics in 2026 and beyond.
Sources & Further Reading
- Intel October 2024 Oregon layoffs: OPB report
- Intel July 2025 major wave in Oregon: OPB coverage
- Intel November 2025 additional cuts: OPB article
- Hillsboro year-end real estate market advisory on stable values: Herald report
- City of Hillsboro semiconductor cluster map: Official interactive map

Thanks for reading—I hope you found a useful insight or an unexpected nugget along the way. If you enjoyed the post, please consider subscribing for future updates.
CODA
Are you an agent in Portland who wonders why appraisers always do “x”?
A homeowner with questions about appraiser methodology?
If so, feel free to reach out—I enjoy connecting with market participants across Portland and the surrounding counties, and am always happy to help where I can.
And if you’re in need of appraisal services in Portland or anywhere in the Portland Region, we’d be glad to assist.


