Portland Real Estate Appraisal Brief – Friday, December 5, 2025: FHFA Raises 2026 Multifamily Loan Purchase Caps

The FHFA raised the 2026 multifamily loan purchase caps for Fannie Mae and Freddie Mac to $176 billion, a move that supports financing and affects property valuations in the Portland metro area.

Contemporary mid-rise multifamily apartment building in the Portland, Oregon metro area, relevant to FHFA’s 2026 $176 billion combined Fannie Mae/Freddie Mac loan purchase caps.
Modern multifamily building in Portland
Stock photo via Canva Pro

FHFA Announces $176 Billion in 2026 Multifamily Loan Purchase Caps

The Federal Housing Finance Agency (FHFA), regulator of Fannie Mae and Freddie Mac (the Enterprises), has set the annual multifamily loan purchase caps for 2026 at $88 billion for each Enterprise, resulting in a combined total of $176 billion in financing capacity. This figure represents a robust increase of more than 20% from the $73 billion cap per Enterprise in 2025. The expanded capacity is intended to maintain liquidity in the multifamily market, especially as lending activity is projected to stabilize and as older loans mature, requiring refinancing.

For perspective, the combined cap was $140 billion in 2024 ($70 billion each) and $146 billion in 2025 ($73 billion each). The nearly $30 billion increase between 2025 and 2026 is a strong signal of anticipated market strength.

The FHFA confirmed that the caps are a floor, not a ceiling. FHFA Director William J. Pulte stated the agency will monitor lending activity throughout the year and has the discretion to increase the caps further if warranted by market conditions, but will not reduce them—a policy designed to prevent disruption in rental housing finance.

Crucially, the mission-driven focus remains a key mandate: at least 50% of the Enterprises’ multifamily loan purchases must qualify as mission-driven affordable housing.

Bar chart showing combined Fannie Mae and Freddie Mac multifamily loan purchase caps increasing from $140 billion in 2024 to $176 billion in 2026, relevant to Portland metro residential and small multifamily property valuations.
FHFA multifamily loan purchase caps for Fannie Mae and Freddie Mac
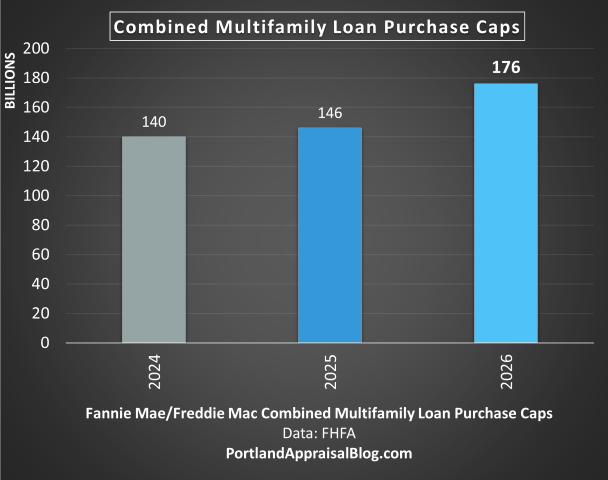
Data: FHFA | Chart: PortlandAppraisalBlog.com

Mission-Driven Focus and Exemptions

The FHFA has maintained specific provisions to support underserved segments of the market:

  • Workforce Housing Exemption: Loans financing workforce housing—properties with rent or income restrictions for at least 10 years or the loan term, typically targeting tenants earning 80% to 120% of area median income (AMI)—are exempt from the volume caps and count fully toward the mission-driven threshold if at least 20% of units meet affordability criteria.
  • Affordability Requirements: The mission-driven criteria also include properties with regulatory agreements (e.g., Low-Income Housing Tax Credit/LIHTC), those in rural areas, and financing for small-scale affordable units in high-cost or cost-burdened markets. The FHFA has also recently complemented these purchase limits by doubling the annual LIHTC investment cap to $2 billion per Enterprise, which could accelerate multifamily construction starts in 2026.

This commitment to affordability ensures that a substantial portion of the capital is directed toward maintaining and increasing the supply of rental housing for lower- and moderate-income residents, a critical need nationwide and across the Portland region.

Appraisal and Valuation Implications for the Portland Region

The increased national lending capacity for multifamily properties has subtle yet important implications for certified residential and commercial appraisers, as well as the homeowners, lenders, and investors they serve across the Portland–Vancouver metro area.

Residential Properties (1–4 Units)

For residential stakeholders, the robust federal support for multifamily lending indirectly influences the single-family market. By increasing the capital flow for new and existing rental properties, the FHFA action helps stabilize the rental supply, which in turn can ease demand pressure that might otherwise shift to single-family inventory in high-demand areas.

In Oregon and Washington counties, including Multnomah, Washington, and Clark, this broader stability aids in appraising the smaller, 2–4 unit residential income properties often financed through conventional Fannie Mae/Freddie Mac channels. Appraisers should note that in the income approach, the assurance of strong capital markets for rental housing—particularly those properties meeting workforce housing needs—provides a stabilizing factor for Gross Rent Multipliers (GRMs) and capitalization rates used in valuation. This financing stability offers a necessary counterbalance to the volatility introduced by local regulations, such as Oregon’s statewide rent increase limits (set at 9.5% for 2026) and Portland’s mandatory relocation assistance policies (triggered by a 10% rent increase or higher). Crucially, the 9.5% state cap means the state maximum increase does not automatically trigger the significant financial liability of relocation assistance within Portland city limits.

Commercial / Multifamily (5+ Units)

For the commercial and investment real estate segment, which includes properties with five or more units, the increased $176 billion cap is a clear positive. It reinforces the Enterprises as a reliable, deep source of capital in the Portland–Vancouver corridor, where investment sales have been concentrated in Vancouver, Milwaukie, and Hillsboro/Beaverton submarkets.

Appraisers valuing these assets should incorporate the following:

  • Cap Rate Stability: The strong financing capacity acts as a floor, limiting upward pressure on capitalization rates that might otherwise result from tighter credit conditions.
  • Workforce Housing Marketability: The explicit cap exemption for workforce housing loans is highly relevant. Appraisers must consider a property’s potential eligibility for this favorable financing when assessing its highest and best use and marketability, especially in submarkets facing high rent growth or in communities like those in Cowlitz and Skamania counties where mission-driven initiatives promote long-term affordability.
  • Market Context: The assurance of this funding stream is timely, as the Portland metro multifamily market currently faces an elevated vacancy rate (ranging from approximately 5.5% to 7.5%, with higher rates for luxury Class A units) due to a wave of recent new deliveries. However, the pipeline is slowing significantly (new construction starts down over 50%), suggesting this capital will be available precisely as the market rebalances and conditions tighten.

Market Context

The FHFA’s decision to increase the combined cap to $176 billion is broadly supported by industry groups like the Mortgage Bankers Association (MBA) and the National Association of Home Builders (NAHB). This federal framework is expected to bolster the long-term rental stability that is crucial for the Portland metro area. The increased lending capacity comes at a pivotal time, mitigating the risk of a future housing shortage that could result from the current dramatic slowdown in new development across the region. The decision aligns the national financial framework with the local market’s need for capital, particularly for mission-driven and workforce housing, which remains a consistent demand factor for appraisers to consider.

Sources & Further Reading

Thanks for reading—I hope you found a useful insight or an unexpected nugget along the way. If you enjoyed the post, please consider subscribing for future updates.

CODA

Are you an agent in Portland and wonder why appraisers always do “x”?

A homeowner, lawyer, or estate planner with questions about appraiser methodology?

If so, feel free to reach out—I enjoy connecting with market participants across Portland and the surrounding counties, and am always happy to help where I can.

And if you’re in need of appraisal services in Portland or anywhere in the Portland Region, we’d be glad to assist.

Portland Real Estate Appraisal Brief – Friday, November 28, 2025: FHFA Q3 2025 House Price Index: National Trends, Oregon Context, and the Role of Appraisers

FHFA Q3 2025 HPI: U.S. +2.2% YoY, Oregon +0.31%, Portland MSA +1.51% — appraisal insights and practical implications for Portland appraisers and lenders.

National Overview & Oregon Statewide Performance

On November 25th, the Federal Housing Finance Agency (FHFA) released its Q3 2025 House Price Index (HPI). Nationally, home prices rose 0.2% quarter‑over‑quarter, and 2.2% year‑over‑year, reflecting a cooling but still positive trajectory across most regions.

Oregon posted +0.31% annual appreciation, ranking 45th nationally, with a –0.16% quarterly decline. These subdued figures mirror the broader West Coast trend: Washington registered +1.37% YoY, while California slipped –0.62% YoY. Oregon’s modest growth reflects a market in balance—neither surging nor contracting sharply.

Map showing Four-Quarter House Price Change by State.

Source: FHFA

Portland-Vancouver-Hillsboro MSA

In the “Purchase-only” FHFA index, the seven‑county Portland‑Vancouver‑Hillsboro MSA outperformed the statewide average slightly, recording +0.16% quarterly growth and +1.51% annual appreciation (” Seasonally Adjusted, Nominal” category). This MSA includes:

  • Oregon counties: Clackamas, Columbia, Multnomah, Washington, and Yamhill.
  • Washington counties: Clark and Skamania.

The inclusion of Clark County (Vancouver metro) is significant. Its size and activity often moderate or amplify Oregon‑centric trends, making the FHFA MSA lens broader than the Oregon‑only focus used in our local reporting.

In the “All-transactions” FHFA index, the values are similar but slightly different, recording -0.36% quarterly decline and +1.91% annual appreciation. This places the Portland‑Vancouver‑Hillsboro MSA 167th among all reporting MSAs.

Comparison with Our Six-County Oregon Focus

In our Q3 2025 Portland region market update (covering Columbia, Clackamas, Hood River, Multnomah, Washington, and Yamhill), we noted:

  • Median closed price flat at $600,000.
  • Cumulative days on market up to 52 (a 13%+ increase).
  • Sales volume essentially unchanged.

The FHFA’s +1.51% YoY for the seven‑county MSA aligns directionally with this stability but reflects slightly stronger performance due to Clark County’s contribution. When Clark and Skamania are excluded, the Oregon counties track closely with our reported flat medians and lengthening market times.

Methodology Matters: How FHFA Builds the HPI

The FHFA HPI is not just another dataset—it’s one of the most authoritative measures of U.S. housing trends. Here’s how it works:

  • Repeat-Sales Index: FHFA tracks the same property across multiple transactions to measure price changes over time.
  • Purchase Transactions: Use the sales price recorded in the mortgage data.
  • Refinance Transactions: Use the appraised value reported at the time of refinance (if an appraisal was ordered). Automated Valuation Models (AVMs) are not used.
  • Coverage: Only conforming conventional mortgages purchased or guaranteed by Fannie Mae and Freddie Mac are included.
  • New Construction: A new home enters the dataset when financed with a conforming mortgage, but it only contributes to the repeat-sales index once a second transaction occurs (sale or refinance).

This methodology ensures consistency and reliability, but it also means the index can lag in capturing brand‑new construction markets.

A Shoutout to Appraisers

Appraisers play a critical role in the FHFA dataset. Every time a refinance transaction includes an appraisal, that value becomes part of the HPI’s foundation. In other words:

  • Appraisal values anchor the index when no new sale price exists.
  • Consistency in appraisal practice ensures the HPI remains credible and defensible.
  • Local expertise matters: Appraisers’ ability to interpret market conditions, select comps, and apply adjustments directly influences the quality of the data feeding into national housing benchmarks.

Without appraisers, the FHFA’s “all‑transactions” index would be incomplete. Their work provides the bridge between raw market activity and standardized national reporting.

Appraisal Implications

Residential Valuations (1–4 Units):

  • Within Oregon counties, the FHFA’s +0.16% quarterly change supports only minimal positive time adjustments in paired‑sales analysis.
  • Of course, submarkets and particular neighborhoods may diverge from the broader trend. Appraisers must carefully define the competitive submarket for each property and measure market‑condition changes within that context.
  • Flat medians and longer days on market suggest no broad market‑condition adjustments are warranted for most single‑family assignments, but localized dynamics can still justify nuanced treatment.

Cross‑Border and Portfolio Work:

  • For assignments involving Clark or Skamania counties, or when lenders request regional context, the FHFA MSA index provides an authoritative benchmark.
  • The modest +1.51% annual growth reinforces conservative expectations for refinance, purchase, and estate‑planning valuations across the full seven‑county footprint.

Why This Matters

Homeowners, lenders, realtors, estate planners, and attorneys benefit from seeing both perspectives:

  • Oregon‑only trends (flat medians, longer marketing times)
  • FHFA’s broader MSA view (slightly stronger due to Clark County)

Together, they provide a fuller picture of market stability and cross‑border dynamics in the Portland metro.

Frequently Asked Questions (FAQ)

What is the FHFA House Price Index (HPI)?

The FHFA HPI is a repeat‑sales index that measures changes in single‑family home values using data from Fannie Mae and Freddie Mac mortgages. It tracks the same property across multiple transactions to calculate price changes over time.

Does the HPI measure home prices directly?

No. The HPI does not report the median or average home price in dollars. Instead, it measures the percentage change in value between two transactions of the same property.

  • Example: If a home sold for $300,000 in 2015 and then $360,000 in 2025, the HPI records a 20% increase.
  • The index is built entirely from these changes, not from raw price levels. This makes the HPI excellent for tracking market movement, while MLS data is better for reporting actual price levels.

How does the repeat‑sales methodology work?

  • The index only includes properties with at least two transactions (purchase or refinance).
  • It measures the change in value between those two points, not the absolute level of prices.
  • This approach reduces noise from property differences and focuses on market movement.

What about new construction?

  • A new construction sale enters the dataset when financed with a conforming conventional mortgage.
  • However, it does not contribute to the repeat‑sales index until a subsequent transaction occurs (another sale or a refinance with an appraisal).
  • In other words, the first sale is logged, but the property only becomes “active” in the index once there’s a second data point.

What are the implications of this approach?

  • Coverage bias: The HPI does not immediately reflect brand‑new construction markets.
  • Lag effect: It takes time for new construction to show up in the index, often when owners refinance or resell.
  • Complementary data: FHFA also publishes purchase‑only indices (sales prices only) and expanded‑data indices (including FHA and county recorder data) to capture broader market activity.

Do refinances count in the FHFA HPI?

Yes. When a refinance includes an appraisal, the appraised value is used as the second transaction point. Automated Valuation Models (AVMs) are not used. This makes appraisers’ work central to the dataset.

Which counties are included in the Portland‑Vancouver‑Hillsboro MSA?

The FHFA defines the Portland MSA as seven counties:

  • Oregon: Clackamas, Columbia, Multnomah, Washington, Yamhill
  • Washington: Clark, Skamania

This differs from our six‑county Oregon‑only focus, which includes Hood River but excludes Clark and Skamania.

How does FHFA data differ from RMLS or local MLS data?

FHFA data is based on conforming conventional mortgage transactions purchased or guaranteed by Fannie Mae and Freddie Mac. It provides a broad index of price changes, useful for regional benchmarking.

By contrast, RMLS (and other local MLS systems) reflect all listing and sales activity, regardless of financing type. This includes transactions financed with FHA, VA, jumbo loans, private financing, and even cash sales. RMLS also reports granular metrics such as median prices, days on market, and sales volume.

👉 In short: FHFA offers a standardized, mortgage‑based view of price movement, while RMLS captures the full spectrum of market activity, making it indispensable for appraisers and analysts who need transaction‑level detail.

Sources & Further Reading

  • FHFA House Price Index Quarterly Report 2025Q3 (full report)
  • FHA All Transactions Quarterly Tables (Q3 2025)

For current market context on inventory and pricing trends in the Portland region, see our Q3 2025 Market Update.

Thanks for reading—I hope you found a useful insight or an unexpected nugget along the way. If you enjoyed the post, please consider subscribing for future updates.

Question: Do you think Q4 2025 will be flat in Oregon, or will see some significant price movement?

CODA

Are you an agent in Portland and wonder why appraisers always do “x”?

A homeowner with questions about appraisal contingencies, comp selection, or reconsiderations of value?

If so, feel free to reach out—I enjoy connecting with market participants across Portland and the surrounding counties, and am always happy to help where I can.

And if you’re in need of appraisal services in Portland or anywhere in the Portland Region, we’d be glad to assist.