

Stock photo via Canva Pro
This week examined regulatory hurdles and supportive federal adjustments defining the Portland–Vancouver metro landscape, from stark rent cap and relocation differences favoring Washington investors in larger properties to a multistate lawsuit challenging HUD’s funding shifts. FHFA’s loan limit expansions and Portland’s code easing for denser apartments offered pathways to enhanced liquidity and infill supply in the region.
Table of Contents
- Sunday, November 30: Oregon vs. Washington Rent Caps
- Monday, December 1: Inherited Rental Property Challenges
- Tuesday, December 2: HUD Funding Changes and Lawsuit
- Wednesday, December 3: 2026 Conforming Loan Limit Increase
- Thursday, December 4: Modest National Home Sales Gains
- Friday, December 5: Multifamily Loan Purchase Caps Raised
- Saturday, December 6: Single-Exit Four-Story Apartment Code Easing
Sunday, November 30: Oregon vs. Washington Rent Caps
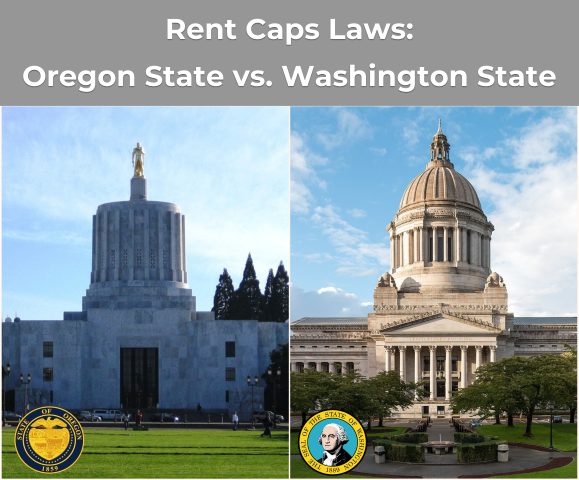
Cross-border differences in rent stabilization create distinct risk profiles for income property investors in the Portland–Vancouver metro area, particularly around the pivotal 4-to-5 unit threshold that shifts financing from conventional to commercial. Both states prohibit rent increases in the first year of tenancy and cap annual hikes at the lesser of 7% plus CPI or 10%, with 90-day notice requirements. Oregon mandates relocation assistance—one month’s rent—for no-cause terminations by landlords owning 5+ units statewide under ORS 90.427, while Portland overlays stricter rules under PCC 30.01.085, requiring payments of $2,900–$4,500 for increases of 10% or more, regardless of landlord size, with penalties up to three times monthly rent.
Washington imposes no statewide relocation mandate, offers exemptions for buildings under 12 years old and owner-occupied 2–4 plexes, and enforces via Attorney General fines up to $7,500. This absence of relocation costs in Washington provides a material cash-flow advantage for 5+ unit owners in Clark County, enhancing refinance eligibility and net operating income stability compared to Oregon counterparts.
For appraisers and investors in the Portland region, these rules promote tenancy predictability but elevate compliance burdens in Oregon, particularly Portland city limits, influencing vacancy allowances and income approach valuations. Properties in high-turnover areas may see dampened risks from stabilized occupancy, while cross-river opportunities in Washington accelerate value growth for newer or exempt developments.
Monday, December 1: Inherited Rental Property Challenges
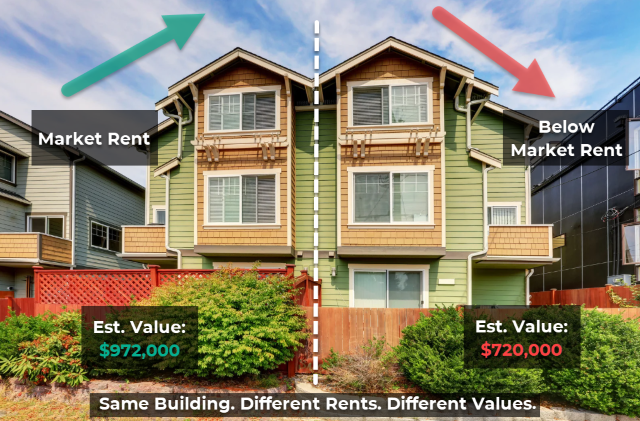
Inheriting 2–4 unit rentals in Oregon frequently involves below-market rents entrenched by statewide caps and Portland’s relocation requirements, creating significant valuation discounts that persist post-death of the original owner. The 2026 rent cap at 9.5% permits gradual increases after 12 months, but no-cause evictions are barred thereafter, and qualifying terminations trigger costs. Appraisers apply gross rent multipliers (typically 165–195 in Portland metro submarkets) to contract rents, yielding discounts of 20–40% versus market-rate scenarios—for instance, a duplex with $4,000 monthly contract rent versus $5,400 market might value at $720,000 instead of $972,000 using a GRM of 180.
Duplexes offer heirs the most flexibility, allowing termination for owner or family move-in with 90-day notice and often exempt from Portland relocation fees if occupying as primary residence. Triplexes and fourplexes face higher barriers, requiring full payments of $4,200+ per unit, often leaving low NOI intact indefinitely. A recent North Portland fourplex sale at $768,000 reflected a 12–14% discount tied to below-market tenancies of $58,026 annual income versus projected $66,120.
In the Portland metro area, this “locked-in tenancy discount” complicates estate planning and probate appraisals, urging documentation of both contract and market rents. Stable cash flow from existing tenants may represent highest and best use, avoiding costly resets—Certified Residential appraisers must carefully scope assignments to reflect these regulatory constraints accurately.
Tuesday, December 2: HUD Funding Changes and Lawsuit

Via Wikimedia Commons
Oregon and Washington joined a coalition of approximately 20 other states in suing HUD over FY 2026 changes to the $3.9 billion Continuum of Care program, capping permanent supportive housing at 30%—down from nearly 90%—while adding service mandates and anti-camping enforcement penalties. This risks a $39 million loss for Oregon and significant cuts to Washington’s $120 million annual grants, much supporting Portland-adjacent counties like Multnomah and Clark. Nationwide, up to 170,000 households face displacement, undermining Housing First models prevalent in the Pacific Northwest.
The lawsuit, filed November 25, 2025, alleges violations of Congressional intent and the Administrative Procedure Act by bypassing proper rulemaking. Local supplements like Metro’s Supportive Housing Services Measure cannot fully replace federal funds.
For the Portland metro region, reduced grants could increase unsubsidized rental demand, pressuring rents and entry-level prices while introducing NOI volatility for subsidy-dependent properties. Appraisers evaluating LIHTC or supportive housing must monitor neighborhood stability and cap rate shifts, as funding instability may alter highest and best use analyses.
Wednesday, December 3: 2026 Conforming Loan Limit Increase

Photo: Ajay Suresh via Wikimedia Commons (CC BY 2.0)
FHFA announced the 2026 baseline conforming loan limit at $832,750 for one-unit properties, a $26,250 increase reflecting 3.26% house price growth. In the Portland–Vancouver MSA, this shifts loans up to the new threshold into lower-rate conventional financing from Fannie Mae and Freddie Mac.
Q3 2025 data showed 99 sales between the old $806,500 limit and new figure, averaging $820,864 closing price with 49-day market time—70 conventionally financed now fully conforming. Overall, 85.48% of 4,682 single-family closings fell under $900,000, with 367 in the $800,000–$899,999 band.
This adjustment eases qualification in mid-to-upper tiers for Portland region buyers and investors, reducing jumbo loan friction and supporting market stability where most activity remains conforming-eligible.
Thursday, December 4: Modest National Home Sales Gains

Photo: Razvan Orendovici via Wikimedia Commons (CC BY 2.0)
October 2025 delivered subtle national improvements, with existing-home sales rising 1.2% month-over-month to a 4.10 million-unit annual rate (up 1.7% year-over-year) and pending sales up 1.9%. Median price reached $415,200 (up 2.1% year-over-year), against 1.52 million units inventory (4.4 months’ supply, up 10.9% annually). Rates around 6.25% supported activity amid regional variances—the West lagged with pending sales down 1.5% monthly and 7.0% annually, median at $628,500.
Portland’s Q3 single-family median held at $600,000, below the West but above national, framing local performance in a high-cost context with decelerating growth.
These trends provide appraisers in the Portland metro area broader stability signals, informing valuations amid affordability constraints and inventory buildup.
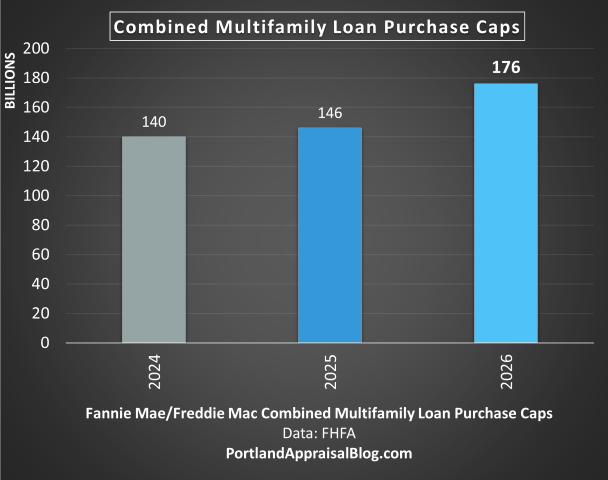
Friday, December 5: Multifamily Loan Purchase Caps Raised

Stock photo via Canva Pro
FHFA increased 2026 multifamily loan purchase caps to a combined $176 billion—up over 20% from 2025—as a floor to maintain liquidity amid maturing debt and construction slowdowns exceeding 50%. At least 50% must be mission-driven affordable housing, including LIHTC or rural projects, with workforce units (80–120% AMI, 10-year restrictions) exempt and counting toward thresholds if 20% qualify.
In the Portland metro, facing 5.5–7.5% vacancy rates, this bolsters refinancing in submarkets like Vancouver and Beaverton, stabilizing cap rates against rent cap headwinds. It supports rental supply essential for easing single-family pressure, enhancing GRMs for 1–4 unit appraisals and marketability of workforce housing.
Investors gain reliable capital for commercial multifamily; appraisers benefit from reduced NOI volatility in a shortage-prone region.
Saturday, December 6: Single-Exit Four-Story Apartment Code Easing
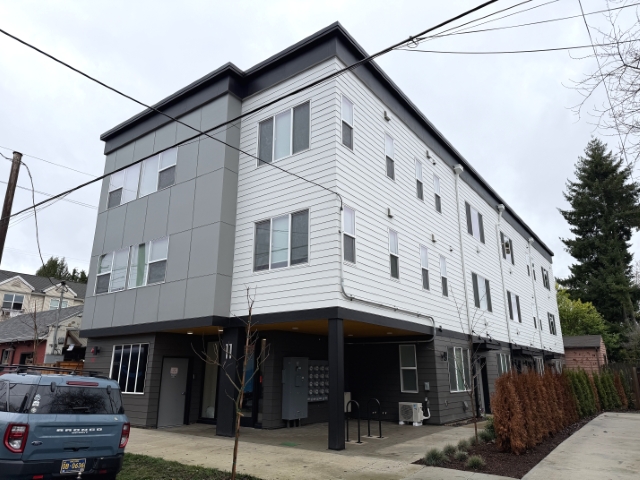
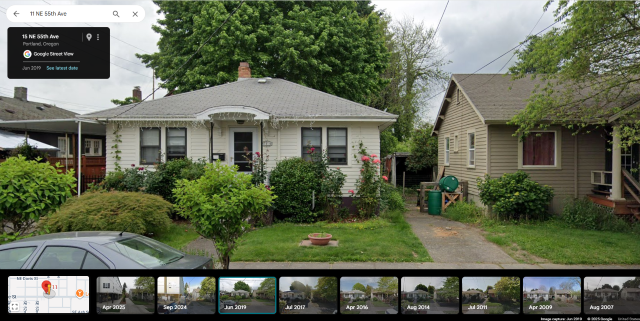
11 NE 55th Ave, Portland, Oregon – December 2025
Photo: Abdur Abdul-Malik, Certified Residential Appraiser
Portland’s Building Code Guide 25–10, approved October 22, 2025, permits single-exit stairwells in four-story apartments under the 2025 Oregon Structural Specialty Code, slashing circulation space to 6.5% from 13–16% and enabling denser infill in RM1/RM2 zones with no maximum unit limits (minimums: RM1 at 1 per 2,500 sq ft; RM2 at 1 per 1,450 sq ft). An example at 11 NE 55th Ave—a three-story 16-unit building on a 5,000 sq ft lot (land sold for $650,000)—demonstrates pro forma value exceeding $3.3 million at a 5.17% cap rate with $256,005 annual income.
This shifts highest and best use toward multifamily on small lots, lifting land values and accelerating medium-density housing amid shortages. Adjacent single-family properties now warrant demolition analyses for redevelopment potential.
Certified Residential appraisers must take this seriously—the increased density often exceeds four units, rendering many RM1/RM2 assignments out-of-scope and requiring Certified General expertise. Concluding four or fewer units as highest and best use risks incomplete analyses if pro formas support higher counts, potentially violating USPAP scope requirements in transitional zones.
Week’s Blog Posts & Further Reading Links
- Sunday’s Brief (11/30): Oregon vs. Washington Rent Caps for Income Properties
- Monday’s Brief (12/1): How Oregon Rent Caps and Eviction Rules Impact Inherited Rental Properties
- Tuesday’s Brief (12/2): HUD Rule Changes Prompt Lawsuit by Oregon and Washington
- Wednesday’s Brief (12/3): FHFA Raises 2026 Conforming Loan Limit to $832,750
- Thursday’s Brief (12/4): National Home Sales Show Modest October Increases
- Friday’s Brief (12/5): FHFA Raises 2026 Multifamily Loan Purchase Caps
- Saturday’s Brief (12/6): Portland Eases Code for Single-Exit Four-Story Apartments
- PortlandAppraisalBlog Q3 2025 Market Update: Post
Closing Remarks
Rent regulation disparities and HUD funding threats underscored valuation pressures on rentals and affordability in the Portland region, countered by FHFA’s expansive financing and local code relaxations promoting supply. National trends added modest context to these evolving dynamics.
Changes to Portland’s building code has made for more challenging valuations of sites in transitional zones (RM1/RM2)—certified residential appraisers will need to be particularly careful appraising properties in such zones as they will very likely require analysis only a certified general appraiser is licensed to do.

Thanks for reading—I hope you found a useful insight or an unexpected nugget along the way. If you enjoyed the post, please consider subscribing for future updates.
Question: With code changes opening denser multifamily and FHFA boosting financing, how might these influence your approach to assignments in Portland’s transitional zones?
CODA
Are you an agent in Portland and wonder why appraisers always do “x”?
A homeowner with questions about appraiser methodology?
If so, feel free to reach out—I enjoy connecting with market participants across Portland and the surrounding counties, and am always happy to help where I can.
And if you’re in need of appraisal services in Portland or anywhere in the Portland Region, we’d be glad to assist.


.jpg)