

Photo: Razvan Orendovici via Wikimedia Commons (CC BY 2.0)
National Home Sales Overview
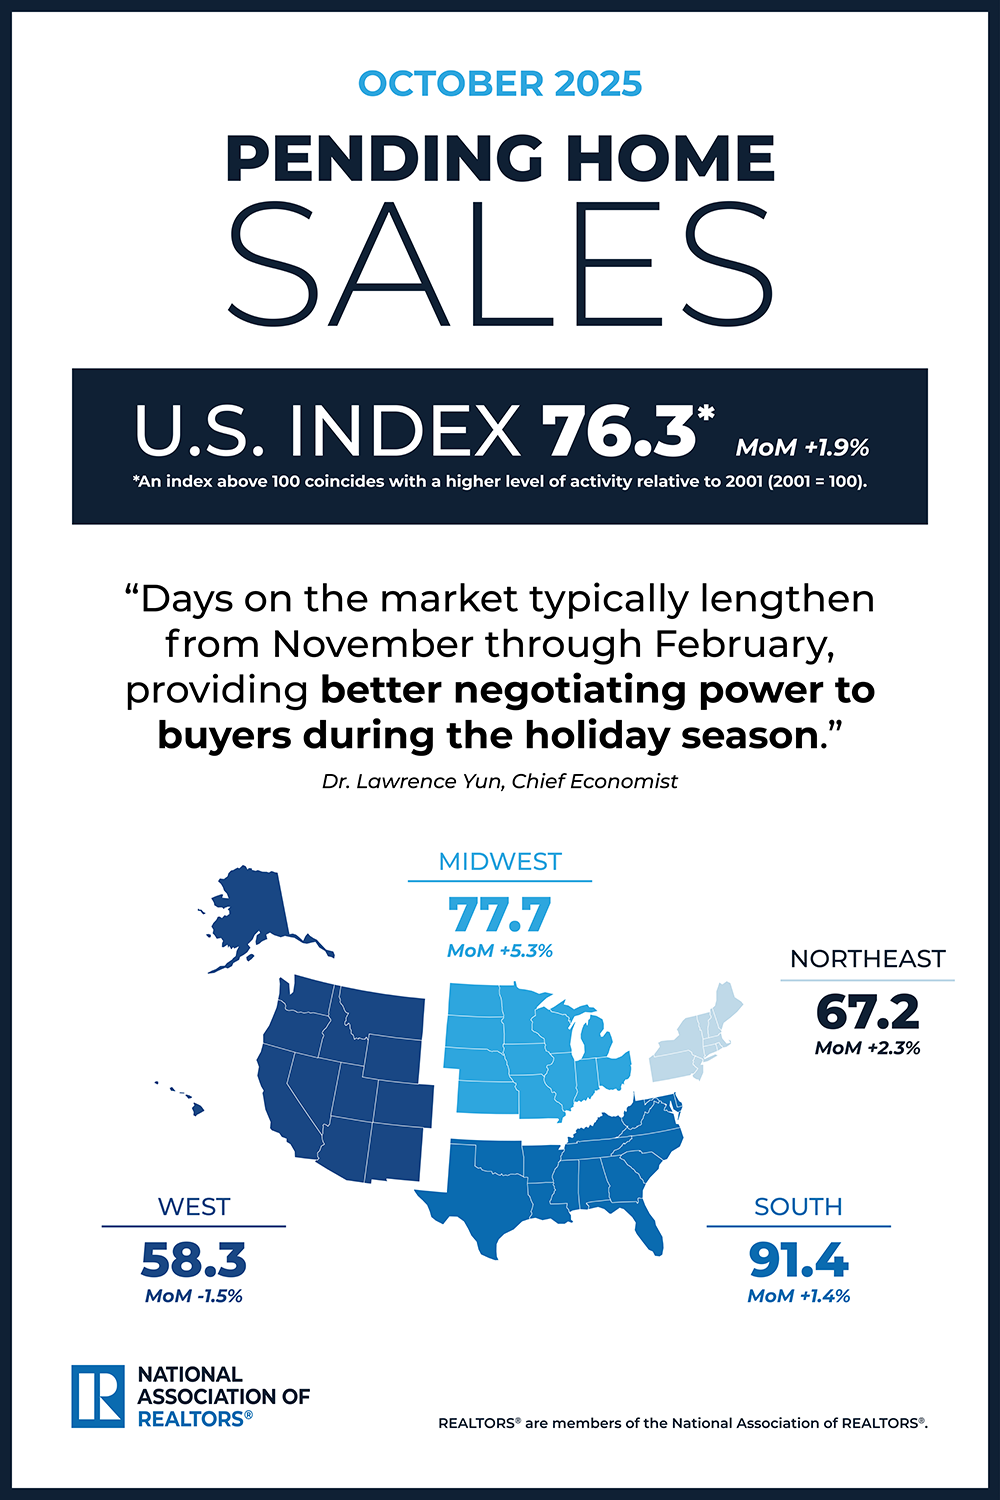
In October 2025, pending home sales across the U.S. rose 1.9% from September, reflecting a modest uptick in contract signings amid lower average mortgage rates(6.25%) for a 30-year fixed loan. Year-over-year, however, pending sales edged down by 0.4%. This monthly gain marks a continuation of buyer activity amid fluctuating economic signals.
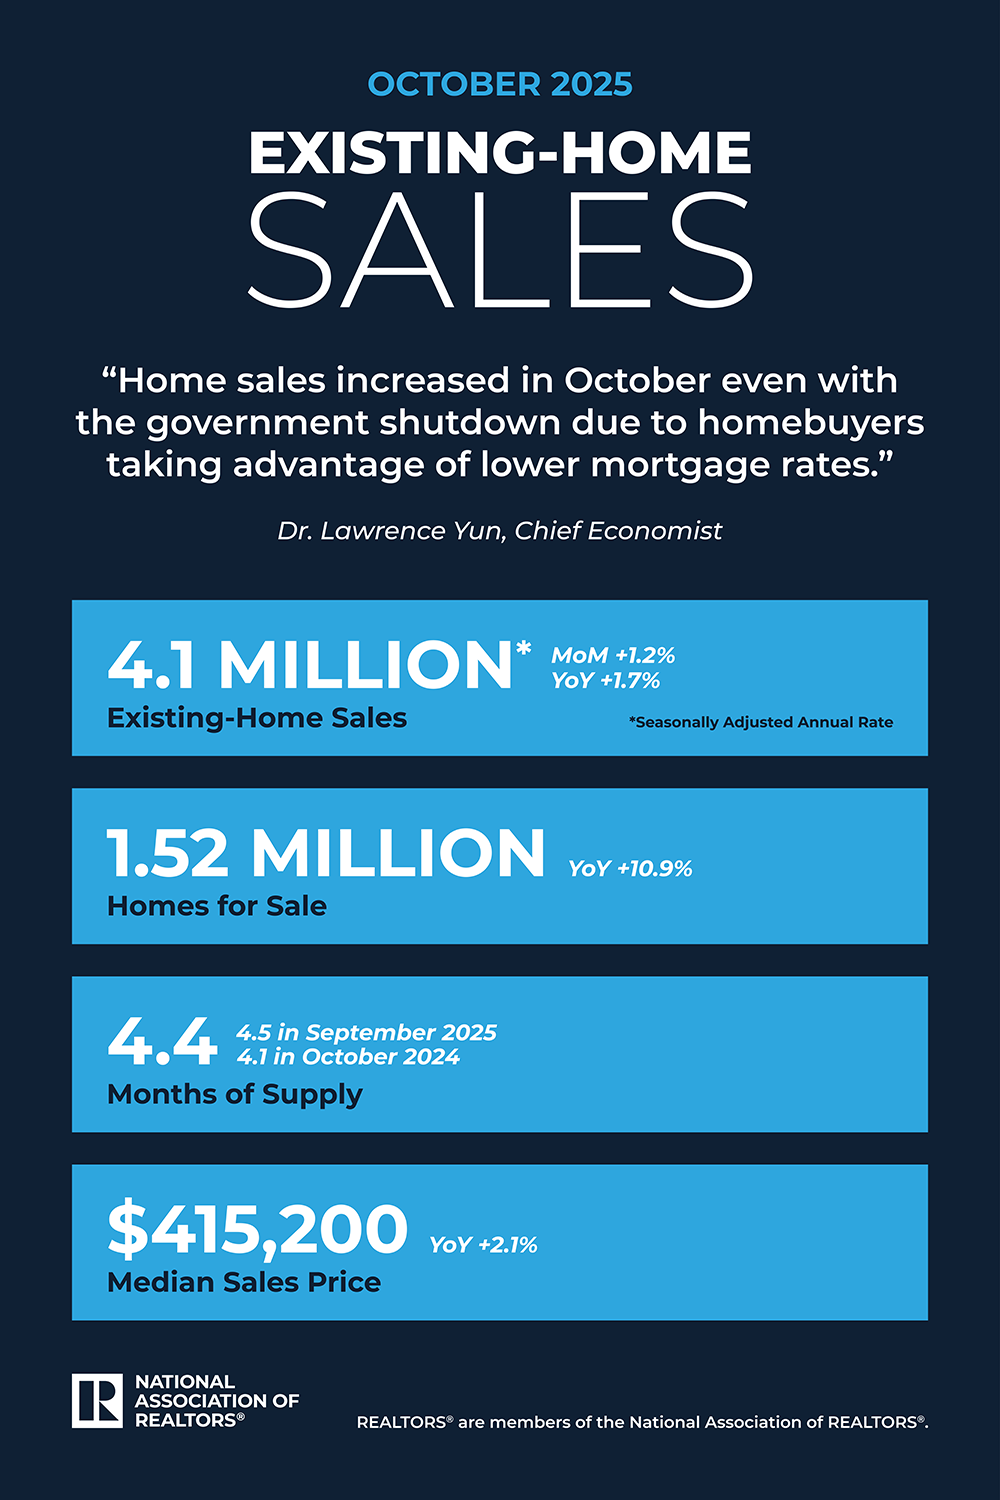
Existing-home sales also increased, climbing 1.2% month-over-month to a seasonally adjusted annual rate of 4.10 million units. On a year-over-year basis, existing sales were up 1.7%, with single-family homes comprising the bulk at 3.71 million units annually. Condominium and co-op sales contributed 390,000 units, showing stronger monthly growth at 5.4%.
The national median existing-home price stood at $415,200 in October, representing a 2.1% increase from the previous year. Single-family homes had a median price of $420,600, while condos and co-ops were at $363,700. These price levels underscore ongoing affordability challenges in certain markets.

Infographic courtesy National Association of REALTORS®
Regional Variations & Inventory
Regionally, pending home sales showed mixed results. The Midwest led with a 5.3% monthly increase and a 0.9% year-over-year gain, attributed to better affordability. The South followed with a 1.4% monthly rise and a 2.0% annual increase. The Northeast gained 2.3% month-over-month but declined 1.0% year-over-year. In contrast, the West saw a 1.5% monthly decrease and a 7.0% annual drop, highlighting price pressures in higher-cost areas.
For existing-home sales, the Midwest again outperformed with a 5.3% monthly increase to 990,000 units annually, up 2.1% year-over-year. The South edged up 0.5% monthly to 1.86 million units, with a 2.8% annual gain. The Northeast held steady monthly at 490,000 units but rose 4.3% year-over-year. The West declined 1.3% monthly to 760,000 units, down 2.6% annually. Median prices varied regionally, with the Northeast at $503,700 (up 6.5% year-over-year), Midwest at $319,500 (up 4.6%), South at $362,300 (up 0.3%), and West at $628,500 (up 0.1%).

Infographic courtesy National Association of REALTORS®
Inventory and Market Conditions
Total housing inventory dipped slightly to 1.52 million units in October, down 0.7% from September but up 10.9% from the prior year. This equates to a 4.4 months’ supply at the current sales pace, a minor decrease from September’s 4.5 months but an improvement from 4.1 months a year ago. These figures indicate a gradual easing in supply constraints nationally.
NAR Chief Economist Lawrence Yun noted that sales advanced despite external factors, with buyers responding to lower mortgage rates averaging 6.25% for a 30-year fixed loan. He emphasized regional disparities, with the Midwest and South benefiting from more affordable inventory, while the Northeast and West face supply shortages and elevated prices. Yun also highlighted decelerating rents potentially aiding inflation control and supporting further rate cuts by the Federal Reserve.
Implications for the Portland Region
These national trends offer context for stakeholders in the Portland metro area, where market dynamics may echo Western region challenges such as higher prices and softer sales growth. For perspective, the median close price for single-family detached residential properties in the Portland region held at $600,000 through Q3 2025. While this is significantly above the national October median of $415,200, it is slightly below the broader West region’s October median of $628,500, suggesting Portland is performing comparably on price relative to its regional peers. For detailed local metrics through September, refer to our Portland region Q3 2025 market update.
Sources & Further Reading
- NAR Pending Home Sales Report for October 2025
- NAR Existing-Home Sales Report for October 2025
- Portland Region Q3 2025 Market Update
Thanks for reading—I hope you found a useful insight or an unexpected nugget along the way. If you enjoyed the post, please consider subscribing for future updates.
CODA
Are you an agent in Portland and wonder why appraisers always do “x”?
A homeowner with questions about appraiser methodology?
If so, feel free to reach out—I enjoy connecting with market participants across Portland and the surrounding counties, and am always happy to help where I can.
And if you’re in need of appraisal services in Portland or anywhere in the Portland Region, we’d be glad to assist.
