

Via Canva Pro
As the first month of 2026 draws to a close, it’s a natural time to look back at how the Portland Region’s single-family detached home market performed in Q4 2025 (October through December). The data reveals a market that has largely maintained stability despite the ongoing influence of higher interest rates that took hold in 2022 and beyond.
Sellers continue to hold firm, often marketing properties for longer periods to connect with the right buyer and minimize concessions on price. At the same time, buyers have gained slightly more leverage in negotiations, reflecting greater selectivity amid elevated borrowing costs. Core and luxury segments exhibited some distinct patterns in response to these dynamics, yet overall the market appears to have settled into a balanced equilibrium—neither surging nor retreating sharply.
Table of Contents
- Data Housekeeping
- Portland Region Q4 2025 Overview
- Multnomah County Q4 2025 Stats
- Washington County Q4 2025 Stats
- Clackamas County Q4 2025 Stats
- Yamhill County Q4 2025 Stats
- Columbia County Q4 2025 Stats
- Hood River Q4 2025 Stats
- Closing Thoughts
- Sources & Further Reading
- Coda
Data Housekeeping
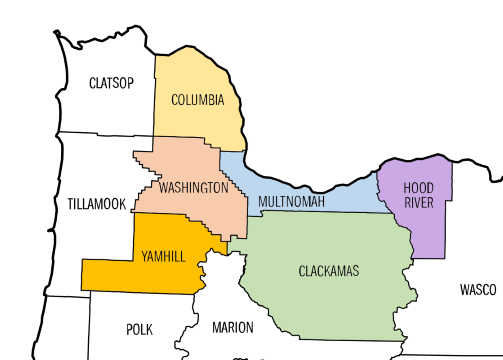
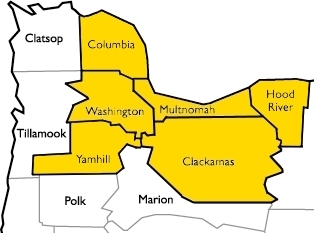
The Portland Region in this update comprises the six Oregon counties of Columbia, Clackamas, Hood River, Multnomah, Washington, and Yamhill. These counties form a contiguous housing ecosystem centered on Portland—Multnomah as the core home county, with the others tightly integrated through commuting patterns, economic ties, and shared market dynamics (e.g., Yamhill’s strong connection via Highway 99W and wine-country adjacency). Beyond Yamhill, the MLS system changes, further distinguishing this six-county area from broader geographic aggregations. For a detailed overview—including county profiles, population data, key value influencers, and why this definition differs from the official seven-county Portland–Vancouver–Hillsboro MSA—see my dedicated page: The Portland Region – Six-County Market Area Overview.
Via SunCatcherStudio
All data is sourced from RMLS and reflects open-market detached single-family residential sales (excluding condos, attached homes, manufactured homes on leased land, and multifamily). SNL (“Sold Not Listed”) entries—off-market transactions entered retroactively—have been excluded to preserve consistency with true market activity.
All figures have undergone my standard cleaning process to address common RMLS accuracy challenges, including misclassifications (e.g., condos listed as detached), square footage/price typos, incomplete fields, status/date mismatches, and non-representative entries. For a detailed overview of these issues, their impact on market analysis, and how I mitigate them through automated flagging, cross-verification, and manual review, see my dedicated page: RMLS Data Accuracy Challenges.
Portland Region 2025 Q4 Overview
The Q4 2025 detached single-family home market in the six-county Portland Region showed signs of continued stabilization. After several quarters of adjustment to elevated interest rates, the data reflects a market that has found a tentative balance—neither accelerating nor declining sharply. Volume edged higher year-over-year, while price metrics remained essentially flat, and days on market continued to lengthen, pointing to buyer selectivity and seller patience.
Overall Regional Trends
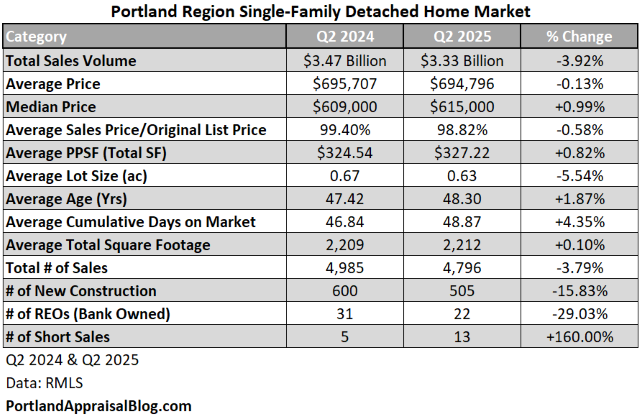
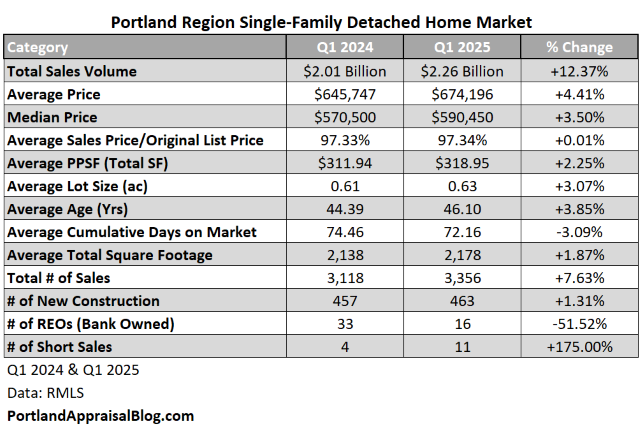
The table below summarizes key metrics for detached single-family residential sales in the Portland Region (Columbia, Clackamas, Hood River, Multnomah, Washington, and Yamhill counties) for Q4 2025 compared with Q4 2024.
| Category | Q4 2024 | Q4 2025 | % Change |
|---|---|---|---|
| Total $ Volume | $2.73 Billion | $2.82 Billion | +3.25% |
| Average Price | $663,713 | $664,118 | +0.06% |
| Median Price | $582,000 | $582,000 | 0.00% |
| Avg SP/OLP | 96.75% | 95.72% | -1.07% |
| Avg PPSF (TSF) | $318.77 | $314.63 | -1.30% |
| Avg Lot Size (ac) | 0.63 | 0.62 | -0.64% |
| Avg Age (Yrs) | 46.20 | 47.17 | +2.10% |
| Avg CDOM | 58.84 | 68.45 | +16.32% |
| Avg Total SF | 2,154 | 2,193 | +1.83% |
| Total # of Sales | 4,112 | 4,243 | +3.19% |
| # of New Constr. | 483 | 463 | -4.14% |
| # of REOs | 18 | 42 | +133.33% |
| # of Short Sales | 7 | 8 | +14.29% |
Data: RMLS | PortlandAppraisalBlog.com
Key Observations From the Aggregate Data
- Sales count rose modestly (+3.19%), driving the overall volume increase (+3.25%), while both average and median prices were virtually unchanged.
- The slight decline in average PPSF (-1.30%) appears largely compositional: average square footage increased +1.83%, and larger homes typically carry lower PPSF unless offset by luxury or new-construction premiums.
- Average cumulative days on market increased significantly (+16.32% to 68.45 days), consistent with buyers remaining selective under higher borrowing costs and sellers holding firm rather than conceding aggressively (reflected in the modest drop in SP/OLP ratio to 95.72%).
- New construction volume retreated further (-4.14%), though the year-over-year drop was less severe than in Q3 2025.
- Distressed activity (REOs + short sales) ticked up to approximately 1.18% of total sales (from 0.61% in Q4 2024), but remains negligible in the broader market context.
Bottom-line Summary
If the Portland Region housing market were a ship, Q4 2025 would be described as “steady as she goes.” The vessel is neither listing sharply nor picking up speed; it is maintaining course through persistent headwinds from higher interest rates. Sellers are exercising patience by allowing longer marketing periods, buyers are exercising discretion by negotiating more effectively, and price levels are holding firm despite the extended exposure time. This equilibrium suggests a market that has largely absorbed the rate shock of 2022–2023 and is now operating in a more normalized, balanced state—albeit one where momentum is subdued and selectivity is elevated.
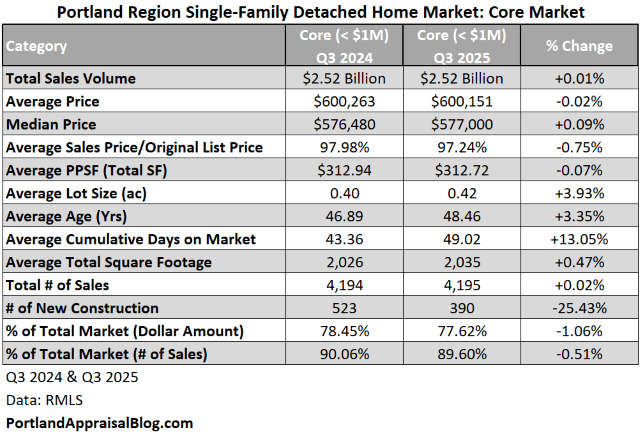
Core Market (< $1M)
The core market—detached single-family homes closing under $1 million—accounts for the overwhelming majority of transactions in the region (91.35% of sales count and 80.55% of dollar volume in Q4 2025). This segment largely drives the overall picture of stability described earlier, with year-over-year changes that are muted but revealing of ongoing buyer caution.
The table below shows core-market metrics for Q4 2025 compared with Q4 2024.
| Category | Core (< $1M) Q4 2024 | Core (< $1M) Q4 2025 | % Change |
|---|---|---|---|
| Total $ Volume | $2.2 Billion | $2.3 Billion | +3.31% |
| Avg Price | $585,561 | $585,609 | +0.01% |
| Median Price | $565,000 | $562,250 | -0.49% |
| Avg SP/OLP | 97.09% | 96.03% | -1.09% |
| Avg PPSF (TSF) | $311.12 | $306.72 | -1.41% |
| Avg Lot Size (ac) | 0.45 | 0.44 | -1.08% |
| Avg Age (Yrs) | 47.01 | 47.51 | +1.06% |
| Avg CDOM | 54.29 | 65.25 | +20.20% |
| Avg Total SF | 1,992 | 2,033 | +2.08% |
| # of Sales | 3,752 | 3,876 | +3.30% |
| # of New Constr. | 432 | 425 | -1.62% |
| % of $ Volume | 80.50% | 80.55% | +0.06% |
| % of Market | 91.25% | 91.35% | +0.12% |
Data: RMLS | PortlandAppraisalBlog.com
The core segment saw a healthy increase in transaction volume (+3.30% in sales count), which translated directly to the modest dollar-volume growth (+3.31%). Price levels, however, remained essentially flat—average price up a negligible 0.01%, median price down slightly (-0.49%). This stability at the median level aligns with the broader regional pattern and suggests that the typical buyer in this price band is still finding properties within reach despite elevated rates.
The most noticeable movement appears in market tempo. Average cumulative days on market climbed +20.20% to 65.25 days, a sharper rise than the regional average as a whole. Buyers in this price-sensitive segment are clearly taking more time to commit, inspecting more options, and negotiating more effectively—the modest decline in the SP/OLP ratio (97.09% → 96.03%) reflects that added leverage. Sellers, meanwhile, appear willing to wait rather than drop asking prices aggressively.
The slight drop in average PPSF (-1.41%) is again largely explained by compositional factors: homes closing in Q4 2025 were, on average, 41 square feet larger (+2.08%). Larger floor plans naturally dilute PPSF unless premium finishes or locations offset the effect, which does not appear to be the case here on a broad scale.
New construction in the core market held up reasonably well, with only a -1.62% drop in count year-over-year. This modest retreat contrasts with sharper declines seen in prior quarters and suggests builders are still finding demand for entry-to-mid-level new homes, even as overall supply pressures ease slightly.
Overall, the core market continues to reflect the realities of affordability-conscious buyers navigating higher borrowing costs: more transactions at stable prices, but with extended decision time and a bit more negotiating power on the buyer side.
Luxury Market (≥ $1M)
The luxury segment—detached single-family homes closing at or above $1 million—remains a smaller but influential portion of the regional market, representing 8.65% of sales count and 19.45% of total dollar volume in Q4 2025. While the core market drives the headline numbers on volume and stability, the luxury segment often reveals early signals of shifting buyer sentiment and supply constraints.
The table below shows luxury-market metrics for Q4 2025 compared with Q4 2024.
| Category | Luxury (≥ $1M) Q4 2024 | Luxury (≥ $1M) Q4 2025 | % Change |
|---|---|---|---|
| Total $ Volume | $532 Million | $548 Million | +2.98% |
| Avg Price | $1,478,221 | $1,493,272 | +1.02% |
| Median Price | $1,259,167 | $1,277,000 | +1.42% |
| Avg SP/OLP | 93.22% | 92.43% | -0.85% |
| Avg PPSF (TSF) | $398.51 | $398.18 | -0.08% |
| Avg Lot Size (ac) | 2.48 | 2.51 | +1.18% |
| Avg Age (Yrs) | 37.79 | 43.61 | +15.40% |
| Avg CDOM | 106.33 | 102.18 | -3.90% |
| Avg Total SF | 3,839 | 3,881 | +1.07% |
| # of Sales | 360 | 367 | +1.94% |
| # of New Constr. | 51 | 38 | -25.49% |
| % of $ Volume | 19.50% | 19.45% | -0.26% |
| % of Market | 8.75% | 8.65% | -1.20% |
Data: RMLS | PortlandAppraisalBlog.com
The luxury segment posted modest gains in both transaction count (+1.94%) and dollar volume (+2.98%), which translated to small but positive price movement: average price up +1.02% and median price up +1.42%. This slight upward pressure contrasts with the flat pricing seen in the core market and contributed an additional ~$15.9 million in total seller proceeds compared with Q4 2024 in this segment.
Market tempo improved somewhat for luxury properties. Average cumulative days on market fell -3.90% to 102.2 days—the only segment to see a reduction in exposure time. This suggests that well-positioned high-end homes are still finding motivated buyers relatively efficiently, even as the broader market lengthens. The SP/OLP ratio continued to soften slightly (93.22% → 92.43%), indicating that sellers in this price band are conceding a bit more ground to close deals.
The most striking shift occurred in new construction. The number of new luxury homes closing dropped sharply (-25.5%), from 51 to 38. This retreat is significantly steeper than the core segment’s mild -1.62% decline and continues a multi-quarter trend of reduced high-end speculative building. Builders appear to be pulling back from the upper end, possibly due to financing costs, buyer selectivity, or uncertainty around future demand.
Another notable change is the jump in average age of sold properties (+15.40% to 43.61 years). A key driver here is the sharp retreat in new construction (-25.49%, from 51 to 38 closings). New homes typically enter and close with near-zero age, pulling the average down when they represent a meaningful share of sales. With far fewer new builds closing this quarter, the sales mix shifted toward existing (and generally older) properties, naturally increasing the average age of transactions. PPSF remained virtually flat (-0.08%), and average square footage edged up modestly (+1.07%), indicating that luxury buyers are not trading down on size or quality but are closing on a different mix of inventory.
From an appraisal perspective, the luxury market’s relative resilience on pricing and CDOM improvement provides a useful contrast for comp selection and market-condition adjustments. However, the sharp drop in new construction supply at this price point may begin to influence highest-and-best-use considerations and functional obsolescence assessments for older luxury improvements in the coming quarters.
Sales Volume
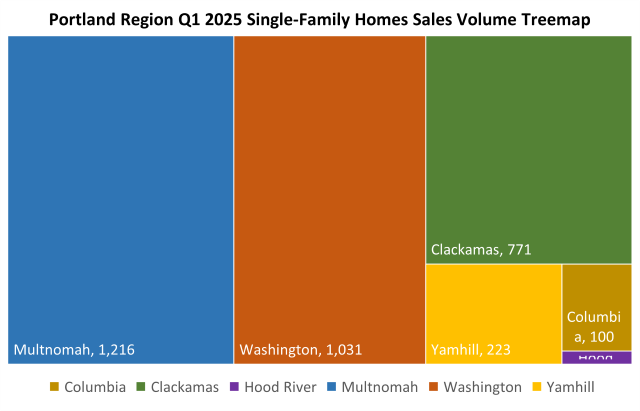
A treemap visualizing the distribution of detached single-family home sales by county in Q4 2025 clearly illustrates the market’s geographic concentration.
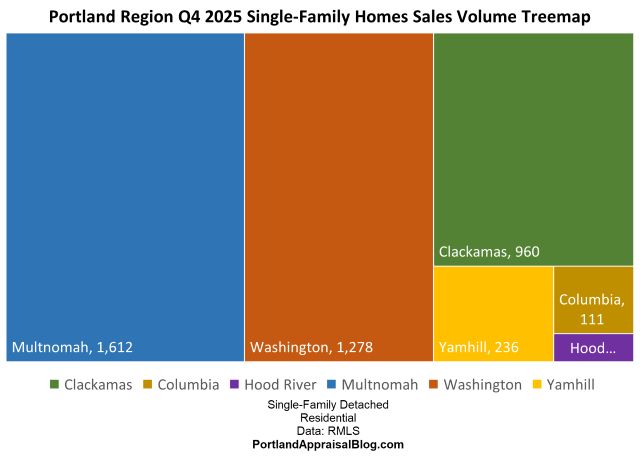
The “Big Three” counties—Multnomah, Washington, and Clackamas—account for over 90% of total transactions and dollar volume, underscoring their role as the dominant drivers of regional activity. Multnomah leads in sheer number of sales (37.99% of the total), followed closely by Washington (30.12%) and Clackamas (22.63%). The remaining three counties (Yamhill, Columbia, and Hood River) together represent less than 10% of sales, highlighting the highly urban/suburban focus of the Portland Region’s detached home market.
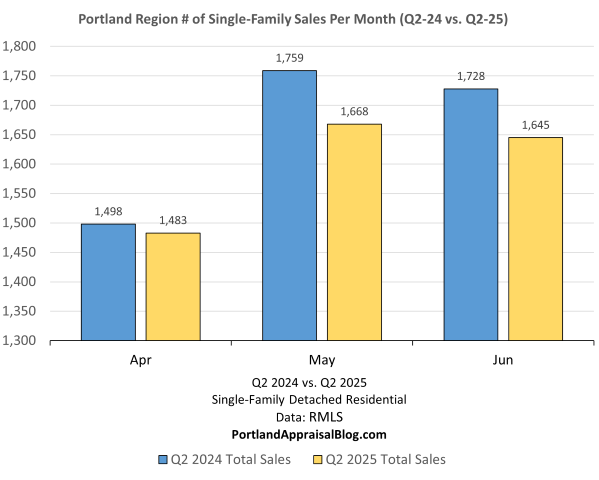
The bar chart below compares monthly sales volume across the three months of Q4 for 2024 and 2025.
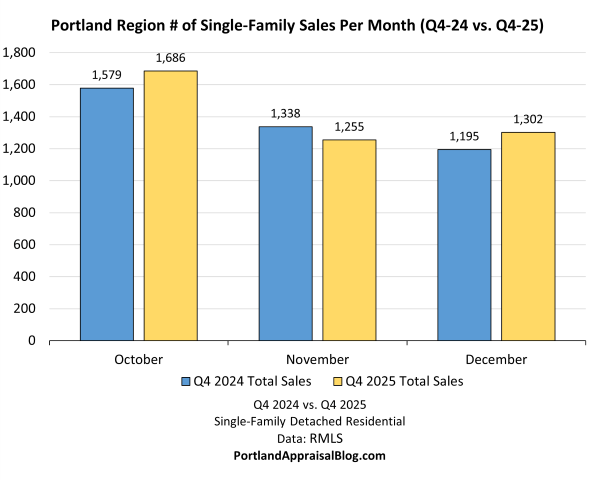
Monthly sales patterns show a mixed picture compared with last year. October 2025 posted a noticeable increase (1,686 vs. 1,579), helping drive the overall quarterly gain in transaction volume. November softened relative to 2024 (1,255 vs. 1,338), reflecting typical holiday slowdown effects, while December rebounded (1,302 vs. 1,195), closing the quarter on a stronger note. The net result is a modest year-over-year increase in total sales (4,243 vs. 4,112), consistent with the regional stabilization theme.
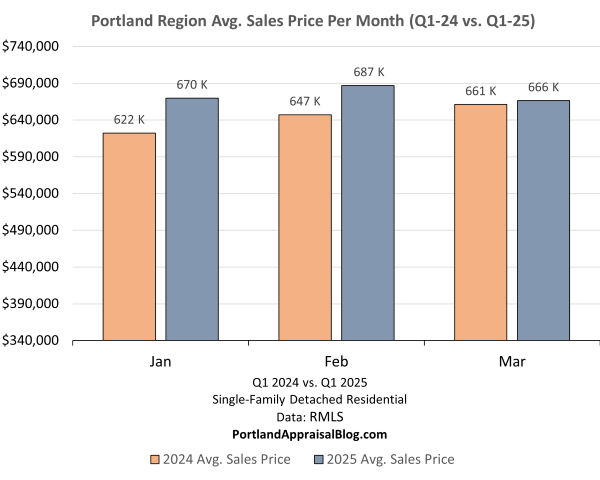
Sales Price
The bar chart below compares monthly average sales prices across the three months of Q4 for 2024 and 2025.
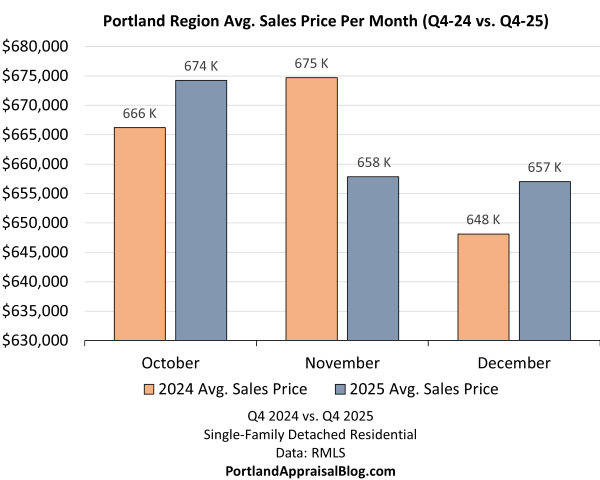
Average sales prices showed only minor month-to-month variation compared with the prior year. October 2025 posted a modest increase over October 2024 ($674,243 vs. $666,189), while November softened ($657,867 vs. $674,704). December then rebounded slightly ($657,031 vs. $648,133). These movements align with the overall quarterly stability, where the average price ended virtually unchanged (+0.06% for the full quarter) despite the shifting monthly pattern. The lack of significant upward or downward momentum reinforces the sense of equilibrium reached in the market after several years of rate-driven adjustment.
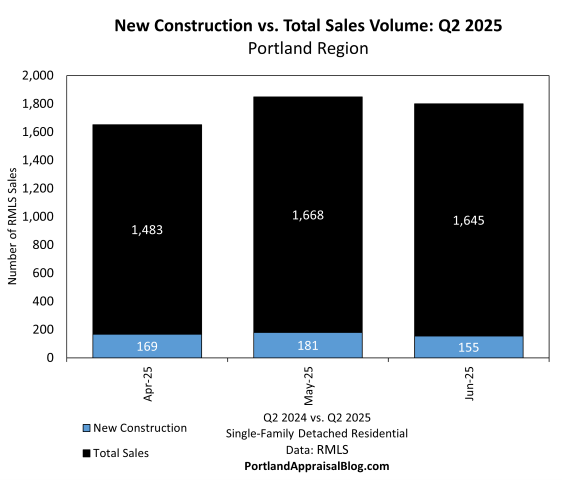
New Construction
The bar graph below shows monthly total detached single-family sales in Q4 2025, with new construction volume nested within each bar to illustrate the portion of sales that were newly built.
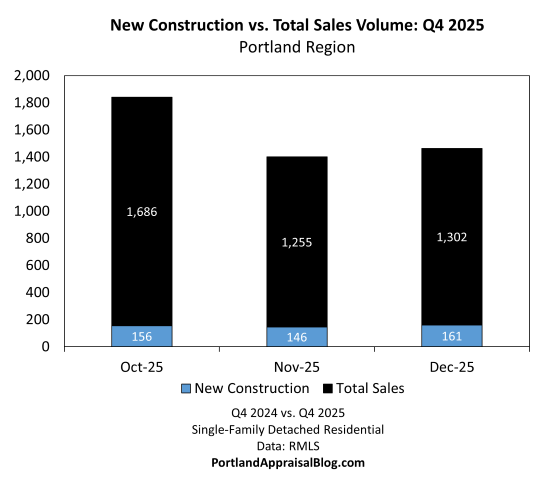
New construction remained a relatively small but visible share of overall activity in Q4 2025, averaging 10.91% of total sales for the quarter. Monthly percentages ranged from 9.25% in October to 12.37% in December, reflecting some seasonal pickup toward year-end. The absolute count of new homes closing (463) was down modestly from Q4 2024 (483, -4.14%), continuing the multi-quarter retreat in new supply observed earlier in the year. This reduction has contributed to the gradual tightening of inventory in certain segments and price bands, particularly at the luxury end where the drop was more pronounced.
A county-level breakout of new construction sales volume in Q4 2025 compared with Q4 2024 reveals significant variation across the region. The bar graph below shows the number of new construction closings by county, with side-by-side bars for 2024 and 2025.
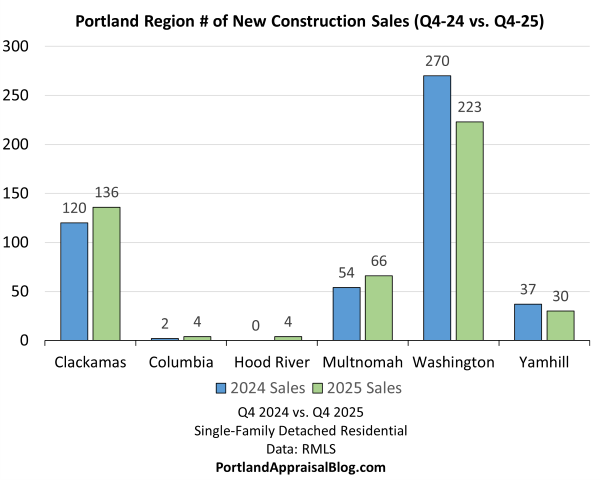
Washington County continued to lead in absolute new construction volume (223 closings in 2025, 48.16% of the regional total), though it experienced the largest absolute drop (-47 units, -17.41%). Clackamas posted the strongest percentage gain (+13.33%) and now represents nearly 30% of all new closings. Multnomah showed solid growth (+22.22%), while Yamhill, Columbia, and Hood River remained small contributors, with Hood River moving from zero to four closings.
The overall regional decline in new construction (-4.14%) masks these internal shifts. The concentration in Washington and Clackamas reflects ongoing builder focus on suburban growth corridors, while the limited activity in outer counties highlights the challenges of scaling new supply in lower-volume, more rural submarkets.
Clackamas County’s recent gain in new construction share (now 29.37% of regional total) may prove short-lived. The ongoing sewer moratorium in Sandy, Oregon—one of the county’s primary growth areas—has already begun to constrain the new-home pipeline. Sandy historically averaged 27% new construction annually for its total sales count over a 28-year period, significantly exceeding available sewer capacity. With the remaining approved projects expected to close by late 2026 or early 2027, Clackamas’s contribution to regional new supply is likely to shrink in the coming quarters. For a full analysis of this shift and its implications for local market dynamics, see my recent deep dive: Sandy Oregon’s Sewer Moratorium.
The dollar value of new construction closings provides additional context on builder activity and investment scale. The table below shows new construction sales volume by dollar amount for Q4 2025 compared with Q4 2024.
| County | 2024 $ Amount | 2025 $ Amount | % Change | % of Total 2025 $ Amount |
|---|---|---|---|---|
| Clackamas | $100,484,661 | $124,588,363 | +23.99% | 4.42% |
| Columbia | $1,169,000 | $2,200,700 | +88.25% | 0.08% |
| Hood River | $0 | $2,511,250 | — | 0.09% |
| Multnomah | $30,948,989 | $33,205,496 | +7.29% | 1.18% |
| Washington | $204,616,369 | $155,310,537 | -24.10% | 5.51% |
| Yamhill | $19,903,315 | $16,491,838 | -17.14% | 0.59% |
| Sum | $357,122,334 | $334,308,184 | -6.39% | 11.86% |
Data: RMLS | PortlandAppraisalBlog.com
The following double bar chart provides the above information at a glance.
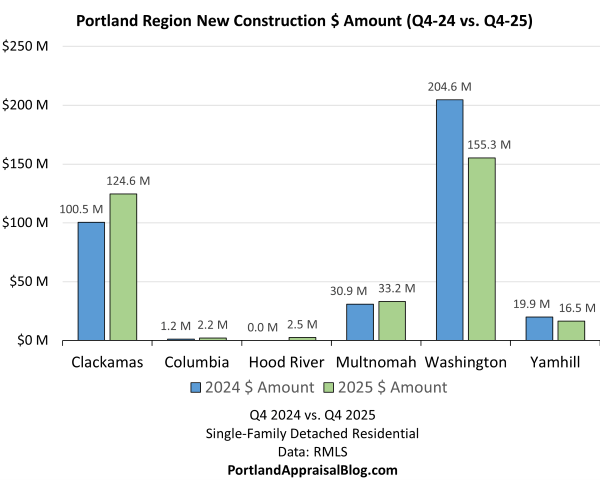
While the count of new construction closings fell modestly (-4.14%), the dollar volume declined more noticeably (-6.39% regionally), reflecting a shift toward relatively lower-priced new homes or fewer ultra-high-end builds. Washington County again dominated in absolute dollars ($155.3M, 5.51% of the total regional value) but saw the largest year-over-year drop (-$49.3M, -24.10%). Clackamas posted the strongest dollar gain (+$24.1M, +23.99%), taking a larger slice of the shrinking pie. These patterns highlight ongoing builder caution in higher-cost segments and continued focus on suburban growth corridors.
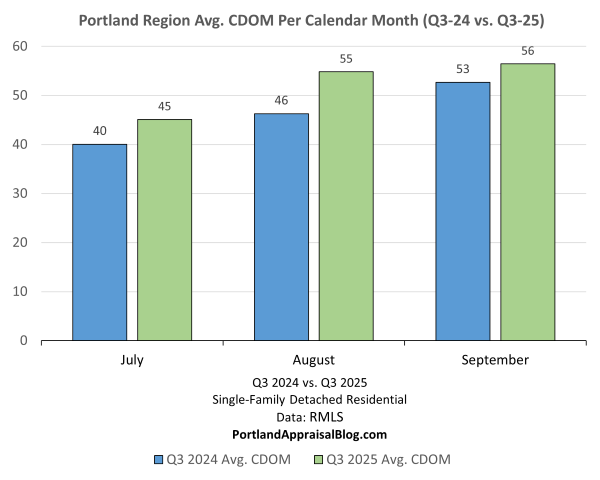
Cumulative Days on Market
The bar chart below compares average cumulative days on market (CDOM) across the three months of Q4 for 2024 and 2025.
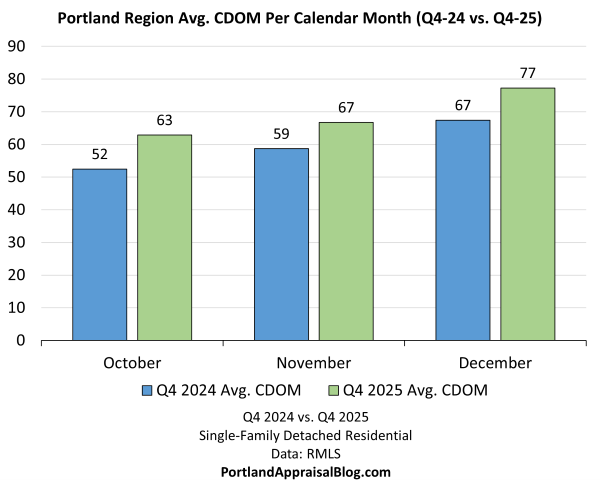
Average cumulative days on market rose across every month in Q4 2025 compared with the prior year, with increases ranging from 13.74% in November to 19.83% in October. The quarterly average CDOM climbed +16.32% overall (58.84 → 68.45 days), reflecting sustained buyer selectivity amid elevated interest rates. Sellers have responded by allowing longer marketing periods rather than making aggressive price concessions, contributing to the market’s current equilibrium. This extended exposure time is a key signal for appraisers when assessing comparable freshness and applying market-condition adjustments in valuations.
The bar chart below breaks out average CDOM by market segment for the three months of Q4 2025, comparing core (< $1M) and luxury (≥ $1M) properties.
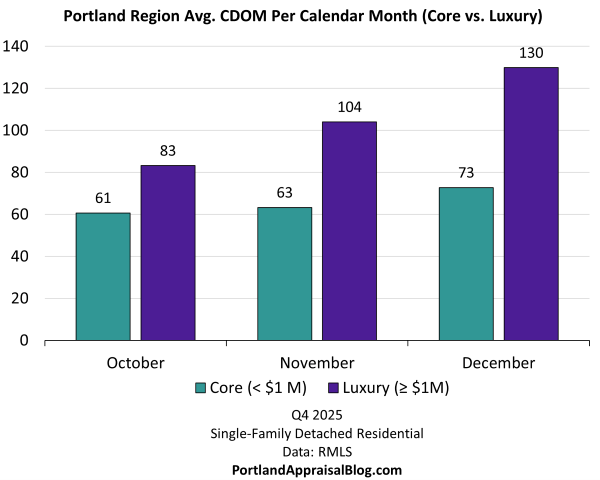
Core-market CDOM rose steadily from 61 days in October to 73 days in December, reflecting the price-sensitive nature of the segment and buyers taking more time to commit. Luxury-market CDOM showed a similar upward trend but from a much higher baseline, increasing from 83 days in October to 130 days in December. The persistent and larger gap between the two segments indicates that luxury buyers remain more selective and willing to wait for properties that precisely match their criteria, even as overall market tempo has slowed, and also the difficulties in finding a buyer than can afford homes in this segment.
Miscellaneous Statistics & Standout Transactions
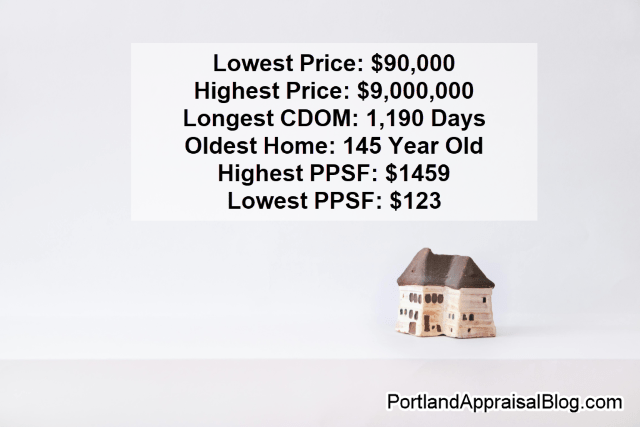
A few notable extremes and outliers from Q4 2025 illustrate the wide range of value drivers across the six-county region.
Lowest close price: $90,000—a 1930s fixer cabin in Forest Grove (Washington County). The property offered original character but required extensive rehabilitation, including interior plumbing repairs and floor work. Photos of this property are currently available online.
Highest close price: $9,000,000—a lakefront estate in Lake Oswego (Clackamas County). The custom-built residence featured premium waterfront amenities, including a private dock, boathouse, and expansive outdoor entertaining spaces. Photos of this property are currently available online.
Longest CDOM: 1,190 days—a $1.9M listing in Multnomah County (Alphabet District) that closed at $1.35M. The 2017-remodeled oversized bungalow included modern updates and a separate ADU, yet required multiple price reductions before finding a buyer. Photos of this property are currently available online.
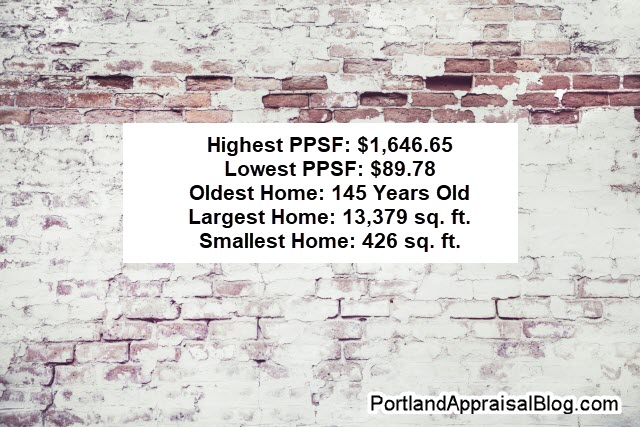
Oldest home sold: Built in 1881—located in Oregon City (Clackamas County). This restored Italianate two-story featured high ceilings, new hardwood floors, and a complete modern kitchen, blending historic character with contemporary systems. Photos of this property are currently available online.
Highest PPSF: $1,459—a small home on 82 acres in Multnomah County. The elevated price per square foot was driven primarily by the large acreage and historic outbuildings rather than the modest improvements. Photos of this property are currently available online.
Lowest PPSF: $123—an REO (bank-owned) sale in Clatskanie (Columbia County). The 2-story home with basement needed significant restoration, with the low per-square-foot price reflecting condition challenges and rural location. Photos of this property are currently available online.
These outliers demonstrate that detached single-family home ownership in the Portland Region can begin around $100,000 for buyers who are patient, flexible, and prepared to address condition or location factors. They stand in contrast to the region’s severely strained affordability, as measured by the Portland Appraisal Blog Affordability Index (PABAI), which stood at 79.2 for Q4 2025. For the full methodology and discussion, see the dedicated page: Portland Appraisal Blog Affordability Index – PABAI. A comprehensive review of 2025 affordability trends is forthcoming.
With the regional aggregate trends, segment splits, monthly patterns, and notable outliers now in view, the remainder of this update turns to a county-level breakdown. The following sections present year-over-year comparisons for each of the six counties in the Portland Region—Multnomah, Washington, Clackamas, Yamhill, Columbia, and Hood River—ordered by Q4 2025 sales volume descending. Each county snapshot includes key metrics, commentary on local drivers, and any segment-specific observations that help explain broader regional patterns.
Multnomah County Q4 2025 Stats
Multnomah County, the urban core of the Portland Region, led in detached single-family home transaction volume for Q4 2025 with 1,612 sales—representing 37.99% of the regional total and a 5.29% increase from Q4 2024. Despite the high count, average and median prices remained below regional figures, reflecting the county’s mix of older homes, smaller lots, and more modest price bands in established neighborhoods.
The table below summarizes key metrics for Multnomah County detached single-family residential sales in Q4 2025 compared with Q4 2024.
| Category | Q4 2024 | Q4 2025 | % Change |
|---|---|---|---|
| Total $ Volume | $928 Million | $986 Million | +6.26% |
| Average Price | $606,203 | $611,760 | +0.92% |
| Median Price | $530,000 | $533,750 | +0.71% |
| Avg SP/OLP | 97.06% | 96.63% | -0.45% |
| Avg PPSF (TSF) | $310.39 | $311.32 | +0.30% |
| Avg Lot Size (ac) | 0.27 | 0.30 | +11.38% |
| Avg Age (Yrs) | 66.04 | 66.30 | +0.38% |
| Avg CDOM | 51.99 | 54.48 | +4.79% |
| Avg Total SF | 2,059 | 2,068 | +0.46% |
| # of Sales | 1,531 | 1,612 | +5.29% |
| # of New Constr. | 54 | 66 | +22.22% |
| # of REOs | 7 | 19 | +171.43% |
| # of Short Sales | 3 | 4 | +33.33% |
Data: RMLS | PortlandAppraisalBlog.com
Multnomah County’s market tempo remained the fastest in the region, with average cumulative days on market at 54.48 days—well below the regional average of 68.45 days. This shorter exposure time reflects sustained urban demand in walkable neighborhoods such as the Alphabet District, Pearl, and inner-eastside areas, where proximity to amenities and transit continues to draw buyers despite elevated rates. The modest rise in CDOM (+4.79%) was less pronounced than the regional increase (+16.32%), indicating relatively stronger buyer interest and quicker decision-making in the core.
Price metrics showed slight upward movement: average price +0.92% to $611,760 and median price +0.71% to $533,750. The SP/OLP ratio softened marginally (97.06% → 96.63%), suggesting buyers retained some negotiating leverage even in a high-volume market. Average PPSF edged up +0.30%, despite the small increase in average square footage (+0.46%). The PPSF increase was likely due to the lot size increase (+11.38%), though the county’s older housing stock (average age 66.30 years) continues to temper broader price gains.
New construction activity increased +22.22% (66 closings), rebounding from a sharp -48% year-over-year drop in Q3 2025. Despite the gain, new builds remained a small share (4.1% of county sales), underscoring persistent infill constraints and builder focus on suburban corridors elsewhere. Distressed sales ticked up (REOs +171.43%, short sales +33.33%), though absolute numbers stayed low and did not materially influence the overall market.
A scatter plot of all Multnomah County sales in Q4 2025 (close price vs. date of sale) shows no strong upward or downward trend across the quarter.
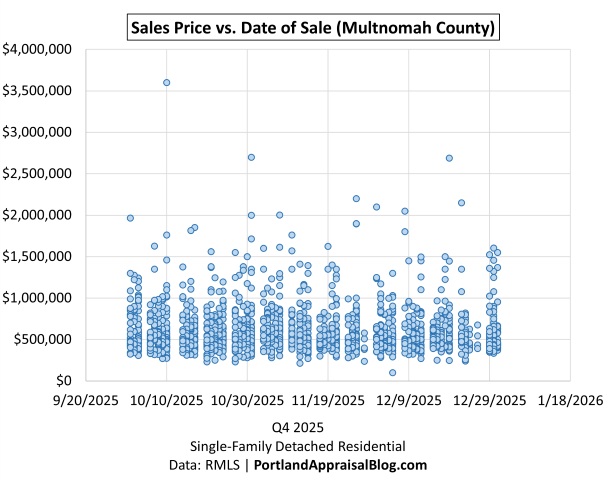
The distribution clusters primarily in the $400k–$800k range with CDOM generally under 100 days, consistent with the county’s efficient urban tempo. A modest number of sales appear above $1.5M, with one notable outlier closing above $3.5M, reflecting continued activity at the upper end despite the broader market’s stability.
From an appraisal perspective, Multnomah County’s combination of high transaction volume, shorter CDOM, and modest price growth provides a stable benchmark for comp selection in urban submarkets. The limited new supply and aging inventory require careful adjustments for condition, functional obsolescence, and location premiums, while the scatter of higher-end sales suggests selective but persistent demand above $1.5M.
Washington County Q4 2025 Stats
Washington County ranked second in detached single-family home transaction volume for Q4 2025 with 1,278 sales (30.12% of the regional total), up +7.58% from Q4 2024. The county experienced noticeable price softening alongside longer market times, reflecting a shift in buyer behavior and supply dynamics in this suburban growth corridor.
The table below summarizes key metrics for Washington County detached single-family residential sales in Q4 2025 compared with Q4 2024.
| Category | Q4 2024 | Q4 2025 | % Change |
|---|---|---|---|
| Total $ Volume | $818 Million | $842 Million | +2.92% |
| Average Price | $688,426 | $658,641 | -4.33% |
| Median Price | $625,000 | $605,000 | -3.20% |
| Avg SP/OLP | 97.13% | 95.50% | -1.68% |
| Avg PPSF (TSF) | $322.16 | $307.84 | -4.45% |
| Avg Lot Size (ac) | 0.36 | 0.41 | +14.24% |
| Avg Age (Yrs) | 29.27 | 32.39 | +10.67% |
| Avg CDOM | 59.63 | 74.24 | +24.49% |
| Avg Total SF | 2,213 | 2,241 | +1.26% |
| # of Sales | 1,188 | 1,278 | +7.58% |
| # of New Constr. | 270 | 223 | -17.41% |
| # of REOs | 2 | 7 | +250.00% |
| # of Short Sales | 3 | 0 | -100.00% |
Data: RMLS | PortlandAppraisalBlog.com
Transaction volume grew solidly (+7.58%), driving a modest increase in total dollar volume (+2.92%). However, both average and median prices declined noticeably (-4.33% and -3.20%, respectively), and average PPSF fell -4.45%. This softening appears partially compositional: new construction retreated sharply (-17.41%, 270 → 223 closings), removing a number of higher-priced new builds from the sales mix. The remaining closings skewed toward older homes (average age +10.67% to 32.39 years) and larger lots (+14.24%), which typically carry lower PPSF in this market.
The weakening in average and median prices can be partially explained by the impact of job loss in Hillsboro. External obsolescence tied to Intel’s 2024–2025 workforce reductions has contributed to declining resale prices and buyer confidence in certain segments. For a detailed analysis of resale trends, condominium/attached impacts, and appraisal implications in Hillsboro, see my recent deep dive: External Obsolescence in Hillsboro — Residential Market Response to Intel’s 2024–2025 Workforce Reductions.
Market tempo slowed significantly, with average cumulative days on market rising +24.49% to 74.24 days—among the longest in the region and well above the prior year’s level. This extension, combined with a softer SP/OLP ratio (97.13% → 95.50%), indicates buyers were more selective and willing to wait, particularly in a county heavily influenced by tech employment centers like Hillsboro.
Distressed activity remained low in absolute terms but showed directional movement (REOs +250.00% to 7, short sales -100.00% to 0), consistent with broader regional patterns where condition-related sales are still rare but present.
A scatter plot of all Washington County sales in Q4 2025 shows no strong upward or downward trend overall.
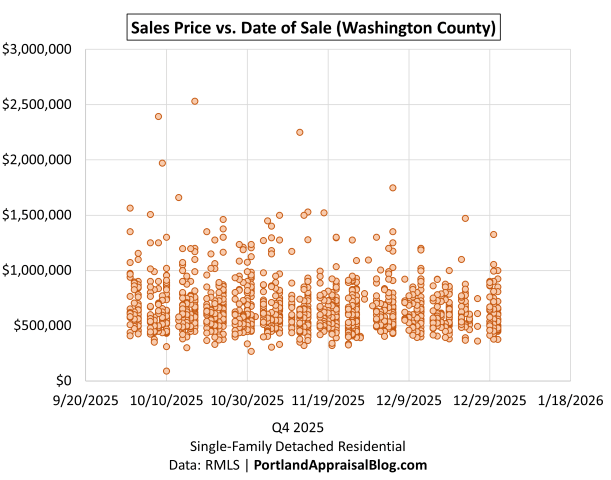
The vast majority of transactions cluster between the high $400,000s and just under $1 million, reflecting the county’s primary move-up and family-oriented price band. Activity thins noticeably above $1 million, with only a handful of points in the $1.5M+ range and just three sales exceeding $2 million, underscoring limited buyer participation at the true upper end of the market.
From an appraisal perspective, Washington County’s volume growth amid price softening and extended CDOM highlights the importance of segment-specific adjustments when selecting comparables. The retreat in new construction and shift toward older/larger existing homes may affect functional obsolescence assessments and market-condition time adjustments, particularly in submarkets sensitive to employment stability.
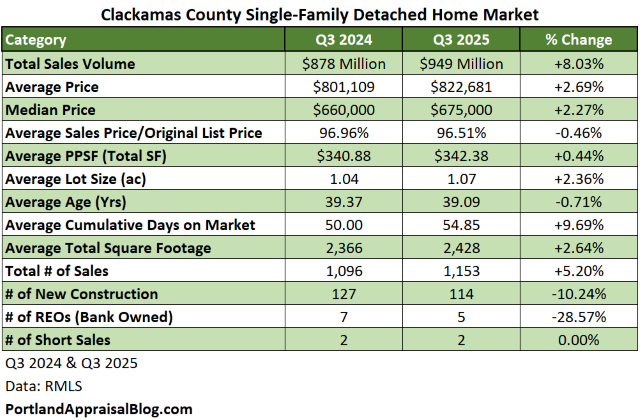
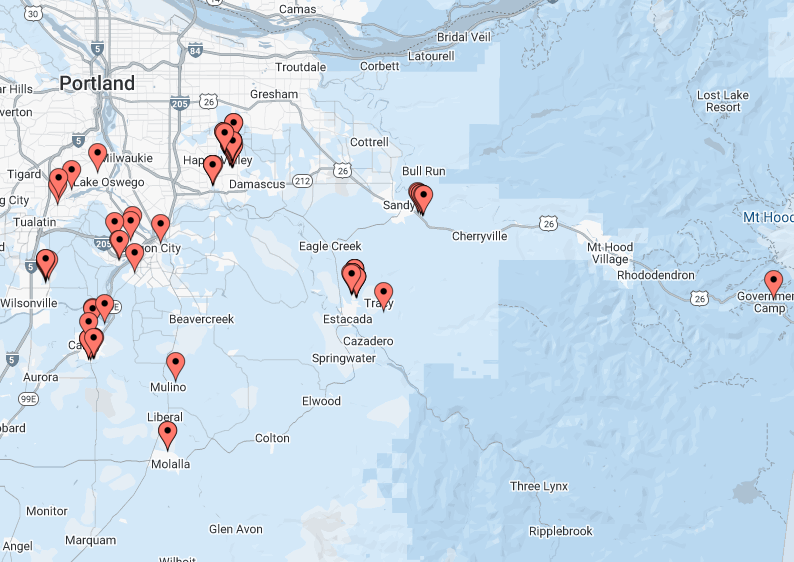
Clackamas County Q4 2025 Stats
Clackamas County ranked third in detached single-family home transaction volume for Q4 2025 with 960 sales (22.63% of the regional total), down slightly -1.13% from Q4 2024. Despite the modest volume decline, the county showed resilience in pricing, with both average and median prices posting gains amid longer market times.
The table below summarizes key metrics for Clackamas County detached single-family residential sales in Q4 2025 compared with Q4 2024.
| Category | Q4 2024 | Q4 2025 | % Change |
|---|---|---|---|
| Total $ Volume | $752 Million | $754 Million | +0.25% |
| Average Price | $774,067 | $784,904 | +1.40% |
| Median Price | $625,583 | $650,000 | +3.90% |
| Avg SP/OLP | 96.02% | 94.95% | -1.11% |
| Avg PPSF (TSF) | $333.13 | $331.95 | -0.35% |
| Avg Lot Size (ac) | 1.08 | 0.84 | -22.65% |
| Avg Age (Yrs) | 37.81 | 37.53 | -0.73% |
| Avg CDOM | 66.08 | 78.50 | +18.80% |
| Avg Total SF | 2,353 | 2,402 | +2.06% |
| # of Sales | 971 | 960 | -1.13% |
| # of New Constr. | 120 | 136 | +13.33% |
| # of REOs | 3 | 13 | +333.33% |
| # of Short Sales | 0 | 1 | — |
Data: RMLS | PortlandAppraisalBlog.com
Clackamas County bucked the regional trend of price stability or softening, with average price up +1.40% to $784,904 and median price up +3.90% to $650,000—the highest median among the six counties. This upward movement occurred despite a slight decline in sales count and a modest drop in PPSF (-0.35%), supported by a small increase in average square footage (+2.06%). The notable reduction in average lot size (-22.65%) appears driven by a compositional shift toward smaller-lot sales in premium and growth-oriented submarkets (e.g., Lake Oswego, West Linn, Happy Valley, Wilsonville), where demand remained strong and prices held firm or increased. New construction gains (+13.33%, 120 → 136 closings) were concentrated in these same corridors (Happy Valley, Wilsonville, Canby, Sandy), adding higher-priced units on compact lots and helping offset softness in more rural areas with larger parcels.
Market tempo slowed, with average cumulative days on market rising +18.80% to 78.50 days—above the regional average. This extension, paired with a softer SP/OLP ratio (96.02% → 94.95%), indicates buyers exercised greater selectivity, though price gains suggest demand held firm in desirable submarkets.
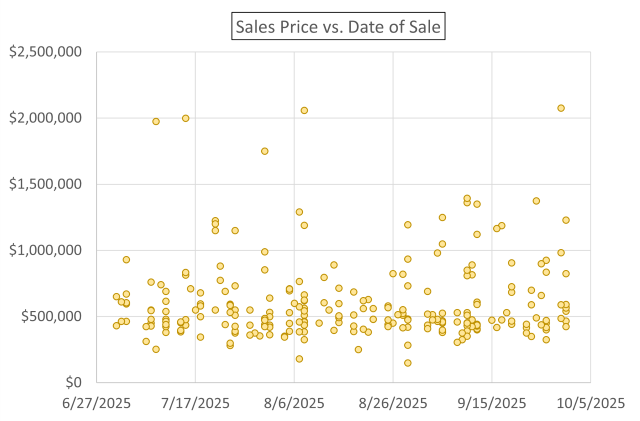
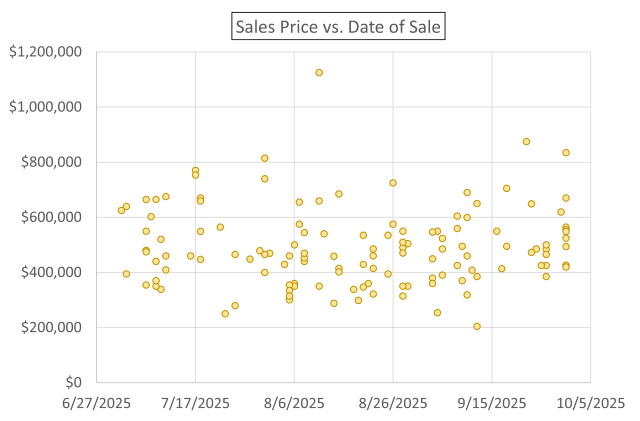
A scatter plot of all Clackamas County sales in Q4 2025 shows no major upward or downward trend overall.
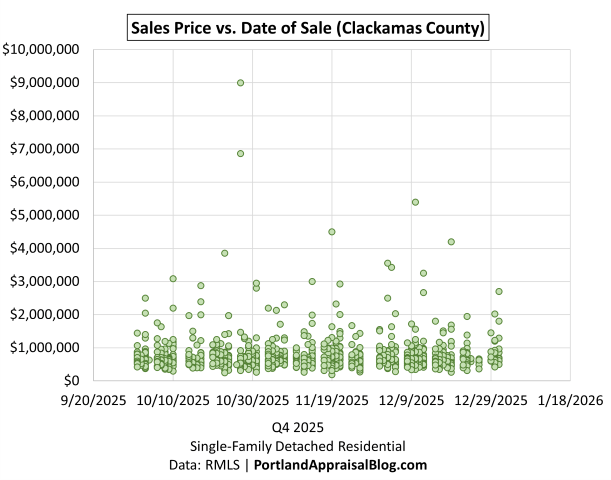
The bulk of transactions cluster between roughly $400k and $1M, with activity thinning considerably above $1 million. Clackamas stands out regionally for its active high-end market, with 30 sales at or above $2M (including the county’s top sale of $9M in Lake Oswego)—far more than any other county. When slicing away these extreme outliers above $2M (leaving 930 data points), the distribution remains flat with no clear directional pattern, consistent with balanced mid-market performance.
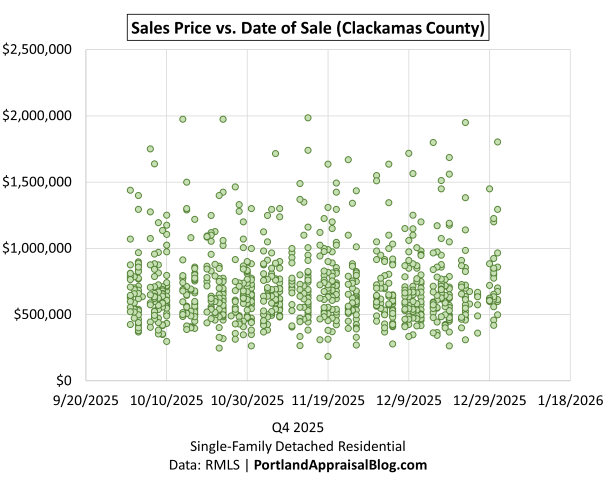
Lake Oswego ZIP codes 97034 and 97035 rank #1 and #3 among areas with appreciable sales volume in the Portland Region, underscoring their role in anchoring the county’s price resilience.
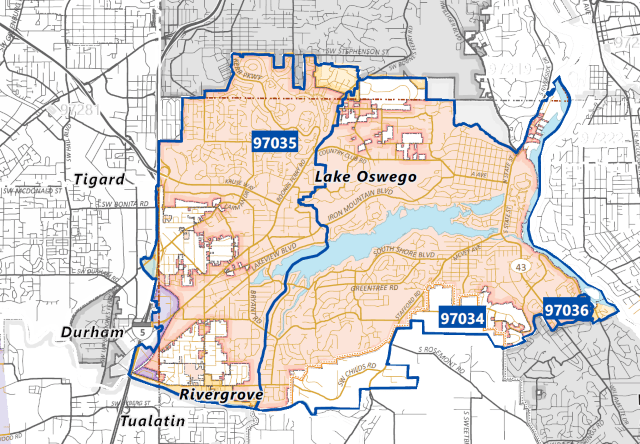
Map via Oregonmetro.gov
From an appraisal perspective, Clackamas County’s price gains amid longer CDOM and reduced lot sizes highlight the need for careful location and size adjustments in comp selection.
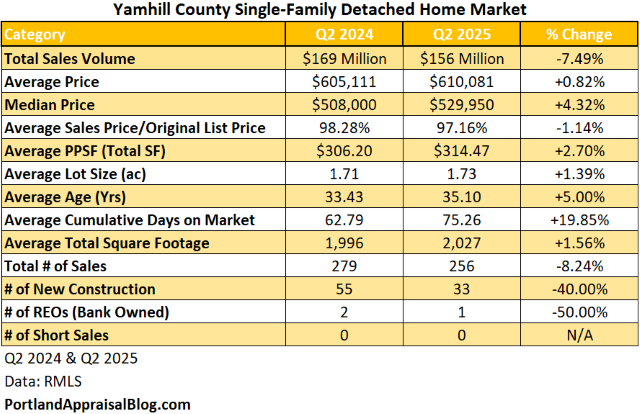
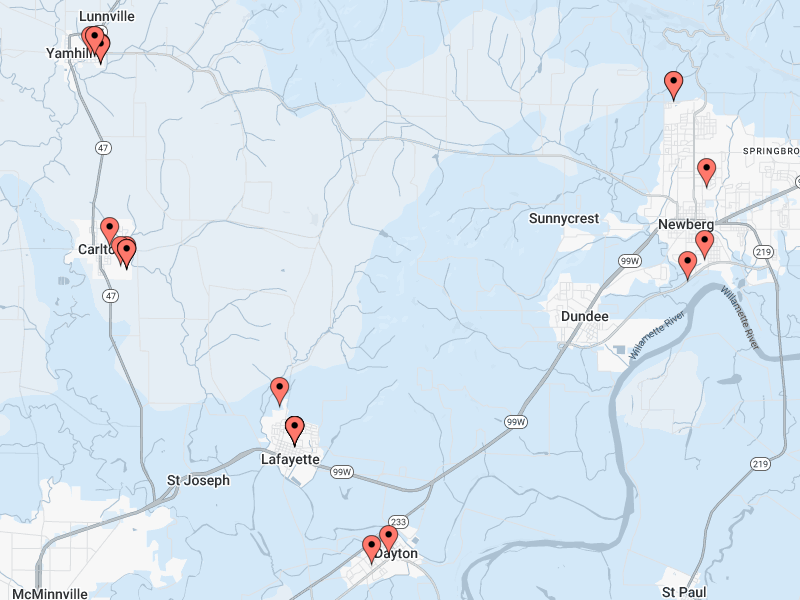
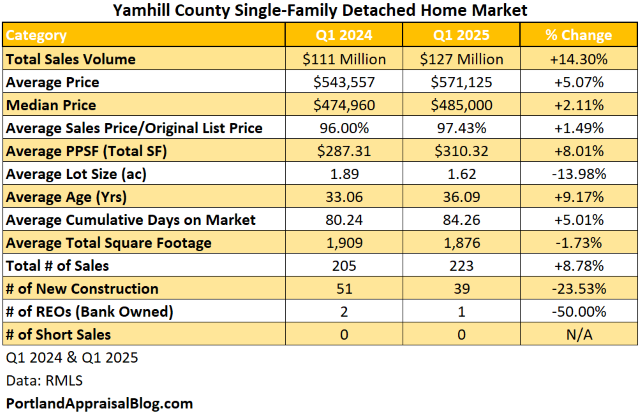
Yamhill County Q4 2025 Stats
Yamhill County ranked fourth in detached single-family home transaction volume for Q4 2025 with 236 sales (5.56% of the regional total), down -9.58% from Q4 2024. The county showed modest price gains despite the volume decline, reflecting a shift toward larger-lot and higher-value closings.
The table below summarizes key metrics for Yamhill County detached single-family residential sales in Q4 2025 compared with Q4 2024.
| Category | Q4 2024 | Q4 2025 | % Change |
|---|---|---|---|
| Total $ Volume | $145 Million | $139 Million | -4.18% |
| Average Price | $555,905 | $589,101 | +5.97% |
| Median Price | $509,900 | $515,000 | +1.00% |
| Avg SP/OLP | 96.59% | 95.01% | -1.63% |
| Avg PPSF (TSF) | $305.05 | $312.27 | +2.37% |
| Avg Lot Size (ac) | 1.49 | 2.05 | +37.40% |
| Avg Age (Yrs) | 36.75 | 35.60 | -3.13% |
| Avg CDOM | 61.02 | 79.34 | +30.03% |
| Avg Total SF | 1,866 | 1,956 | +4.81% |
| # of Sales | 261 | 236 | -9.58% |
| # of New Constr. | 37 | 30 | -18.92% |
| # of REOs | 2 | 1 | -50.00% |
| # of Short Sales | 1 | 3 | +200.00% |
Yamhill County saw a decline in sales count (-9.58%) and total dollar volume (-4.18%), but average price rose +5.97% to $589,101 and median price increased +1.00% to $515,000. This upward movement in pricing was largely compositional: average lot size increased significantly (+37.40% to 2.05 acres) and average square footage rose +4.81%, shifting the sales mix toward larger properties that typically command higher prices in this rural/suburban county. Average PPSF edged up +2.37%, consistent with the larger parcels and slightly newer homes (average age down -3.13% to 35.60 years).
Market tempo slowed considerably, with average cumulative days on market rising +30.03% to 79.34 days—one of the longer exposures in the region. The softer SP/OLP ratio (96.59% → 95.01%) suggests buyers were more selective and willing to negotiate, particularly in a lower-volume county with limited new supply.
New construction continued to retreat (-18.92%, 37 → 30 closings), with Lafayette capturing the majority (21 of 30 county-wide new homes), likely reflecting the final phase of a small subdivision in this growing but still small community.
A scatter plot of all Yamhill County sales in Q4 2025 shows no strong upward or downward trend overall.
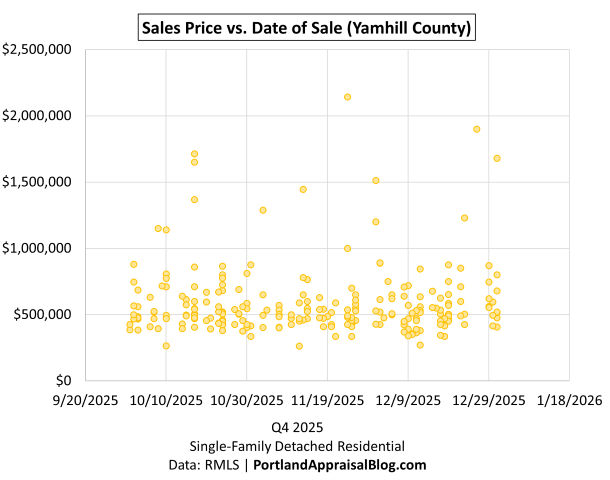
The vast majority of transactions cluster between $400,000 and $700,000 (approximately 61% of sales fall in the $400k–$599k bands), reflecting the county’s primary mid-market focus. Activity thins considerably above $800,000, with only a handful of sales reaching $1 million and just one exceeding $2 million, underscoring limited buyer participation at the upper end.
From an appraisal perspective, Yamhill County’s modest price gains amid declining volume and extended CDOM highlight the importance of size and location adjustments in comp selection. The shift toward larger lots and the retreat in new construction may affect supply considerations and functional obsolescence assessments in this more rural county, while the mid-market concentration provides a stable base for typical valuations.
Columbia County Q4 2025 Stats
Columbia County ranked fifth in detached single-family home transaction volume for Q4 2025 with 111 sales (2.62% of the regional total), down -9.02% from Q4 2024. The county showed modest price gains despite the volume decline, reflecting a shift toward larger homes in this more rural area.
The table below summarizes key metrics for Columbia County detached single-family residential sales in Q4 2025 compared with Q4 2024.
| Category | Q4 2024 | Q4 2025 | % Change |
|---|---|---|---|
| Total $ Volume | $59.7 Million | $56.1 Million | -5.99% |
| Average Price | $489,143 | $505,417 | +3.33% |
| Median Price | $457,650 | $480,000 | +4.88% |
| Avg SP/OLP | 95.69% | 94.58% | -1.16% |
| Avg PPSF (TSF) | $268.23 | $260.02 | -3.06% |
| Avg Lot Size (ac) | 2.37 | 2.16 | -9.00% |
| Avg Age (Yrs) | 49.32 | 49.14 | -0.37% |
| Avg CDOM | 74.80 | 83.37 | +11.45% |
| Avg Total SF | 1,927 | 2,140 | +11.02% |
| # of Sales | 122 | 111 | -9.02% |
| # of New Constr. | 2 | 4 | +100.00% |
| # of REOs | 4 | 2 | -50.00% |
| # of Short Sales | 0 | 0 | — |
Data: RMLS | PortlandAppraisalBlog.com
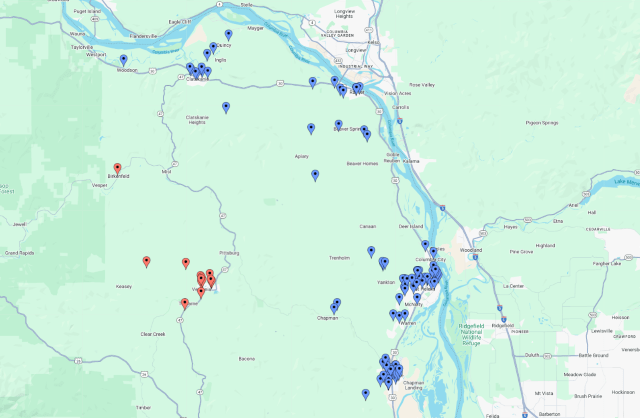
Columbia County’s sales activity is overwhelmingly concentrated along the Columbia River corridor (e.g., St. Helens, Scappoose, Rainier, Columbia City, Deer Island, and Clatskanie), with approximately 97 of the 111 sales occurring in these river-adjacent areas. This geographic focus aptly reflects the county’s name and population distribution.
Average price rose +3.33% to $505,417 and median price increased +4.88% to $480,000 despite a decline in sales count and total dollar volume (-5.99%). This upward movement in pricing was largely compositional: average square footage increased +11.02%, shifting the sales mix toward larger homes that command higher prices in this rural county. Average PPSF fell -3.06%, consistent with the larger floor plans and slightly smaller lots (-9.00%), while average age remained stable (49.14 years).
Market tempo slowed, with average cumulative days on market rising +11.45% to 83.37 days—one of the longer exposures in the region. The softer SP/OLP ratio (95.69% → 94.58%) suggests buyers were more selective, particularly in a lower-volume county with limited new supply.
New construction remained minimal but doubled (2 → 4 closings), a small absolute increase that did not materially impact the overall market. Distressed activity stayed low (REOs -50.00% to 2, short sales 0).
A scatter plot of all Columbia County sales in Q4 2025 shows no major upward or downward trend overall.
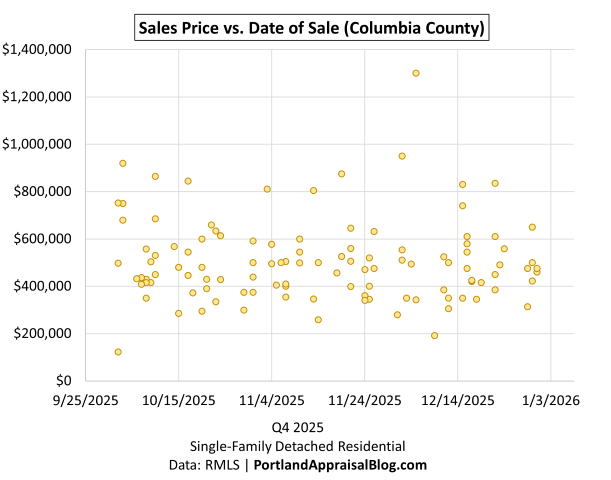
The bulk of transactions cluster between roughly $300k and $600k (approximately 72% of sales fall in the $300k–$599k bands), reflecting the county’s primary mid-market, rural focus. Activity thins considerably above $700k, with only a small number of sales reaching $800k–$900k and one sale above $1 million, underscoring limited buyer participation at the upper end of the market.
From an appraisal perspective, Columbia County’s modest price gains amid declining volume and extended CDOM highlight the influence of property size and location in rural submarkets. The shift toward larger homes and limited new construction require careful adjustments for the contributory value of additional square footage and condition when selecting comparables.
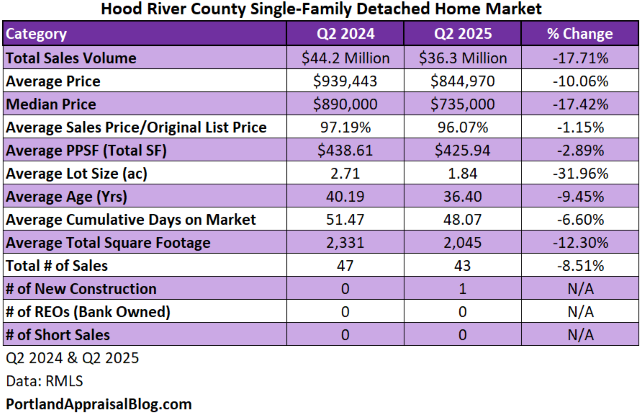
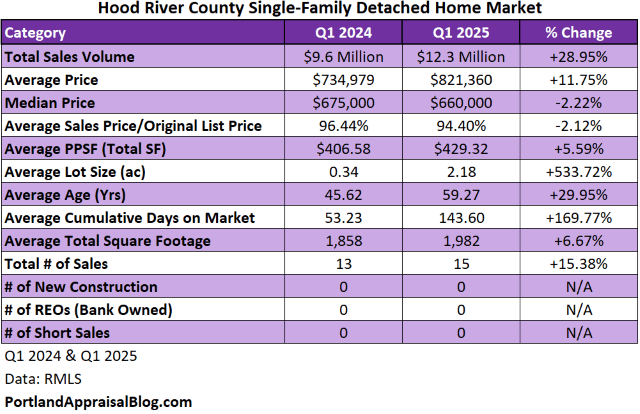
Hood River County Q4 2025 Stats
Hood River County ranked sixth in detached single-family home transaction volume for Q4 2025 with 46 sales (1.08% of the regional total), up +17.95% from Q4 2024. The county posted strong gains in both volume and pricing, reflecting robust demand in this scenic, smaller market.
The table below summarizes key metrics for Hood River County detached single-family residential sales in Q4 2025 compared with Q4 2024.
| Category | Q4 2024 | Q4 2025 | % Change |
|---|---|---|---|
| Total $ Volume | $26.9 Million | $41.3 Million | +53.86% |
| Average Price | $688,544 | $898,167 | +30.44% |
| Median Price | $685,000 | $729,125 | +6.44% |
| Avg SP/OLP | 95.42% | 92.49% | -3.08% |
| Avg PPSF (TSF) | $436.47 | $402.20 | -7.85% |
| Avg Lot Size (ac) | 0.32 | 2.43 | +649.39% |
| Avg Age (Yrs) | 45.79 | 43.57 | -4.87% |
| Avg CDOM | 59.33 | 95.39 | +60.77% |
| Avg Total SF | 1,747 | 2,250 | +28.83% |
| # of Sales | 39 | 46 | +17.95% |
| # of New Constr. | 0 | 4 | — |
| # of REOs | 0 | 0 | — |
| # of Short Sales | 0 | 0 | — |
Data: RMLS | PortlandAppraisalBlog.com
Hood River County saw notable growth in sales count (+17.95%) and total dollar volume (+53.86%), with average price rising +30.44% to $898,167 and median price up +6.44% to $729,125—the highest median in the region. This strong upward pressure was largely compositional: average lot size increased dramatically (+649.39% to 2.43 acres) and average square footage rose +28.83%, shifting the sales mix toward larger properties that command premium prices in this scenic, rural county. Average PPSF declined -7.85%, consistent with the much larger lots and floor plans.
Market tempo slowed significantly, with average cumulative days on market rising +60.77% to 95.39 days—one of the longest exposures in the region. The softer SP/OLP ratio (95.42% → 92.49%) suggests buyers exercised greater selectivity, even as price gains indicate sustained demand for desirable properties.
New construction emerged from zero in Q4 2024 to 4 closings in Q4 2025, a small but positive increase in this low-volume county. Distressed activity remained nonexistent (REOs and short sales zero both quarters).
A scatter plot of all Hood River County sales in Q4 2025 shows no strong upward or downward trend overall.
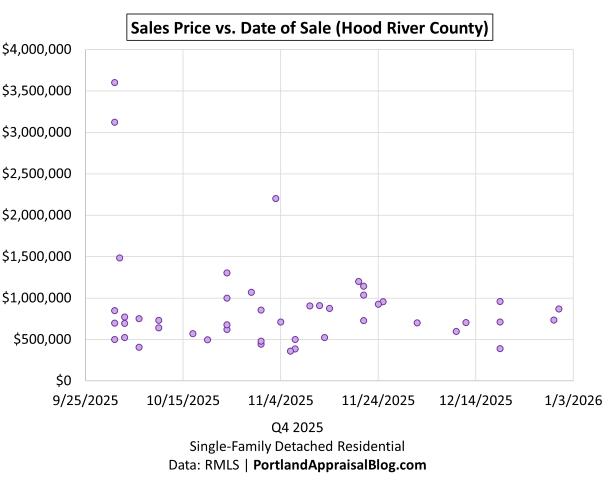
The bulk of transactions cluster in the $500k–$1M range, with decent activity above $1M and three sales exceeding $2M—impressive for a county with only 46 total closings. The lowest sale was $360,000, reflecting limited low-end inventory in this scenic market.
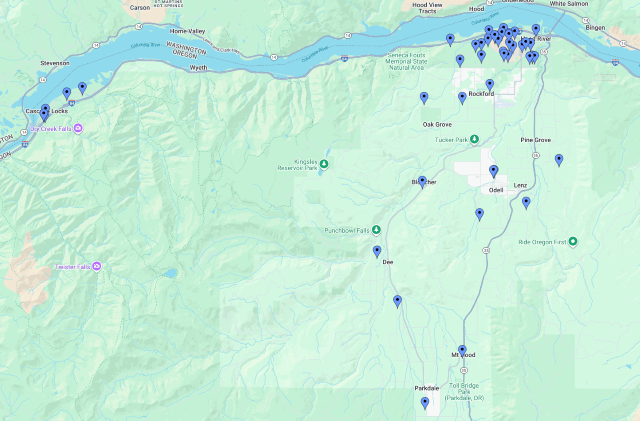
Sales are heavily concentrated in and around Hood River city (including many properties with Hood River addresses but outside official city limits), underscoring the area’s role as the county’s primary population and housing hub.
From an appraisal perspective, Hood River County’s sharp price and volume gains amid longer CDOM and much larger lots highlight the influence of property size and scenic/rural appeal in this smaller market. The emergence of new construction and extended exposure time require careful adjustments for condition, location premiums, and lot size when selecting comparables.
Closing Thoughts
The Portland Region’s detached single-family home market in Q4 2025 displayed clear signs of stabilization after several quarters of adjustment to higher interest rates. Transaction volume edged higher (+3.19%), prices held essentially flat at the median ($582,000) and showed only marginal movement at the average (+0.06%), and days on market continued to lengthen (+16.32% to 68.45 days), reflecting sustained buyer selectivity and seller patience. The core market (< $1M) drove most of the activity while showing more pronounced tempo slowdowns, while the luxury segment (≥ $1M) exhibited relative resilience in pricing and shorter exposure in some cases, though with sharper retreats in new construction supply.
County-level patterns varied, with the urban core (Multnomah) maintaining the fastest tempo and high volume, suburban Washington and Clackamas showing mixed softening and resilience respectively, and the outer counties (Yamhill, Columbia, Hood River) demonstrating more pronounced compositional shifts and longer marketing times. Overall, the market has reached a balanced equilibrium—neither surging nor retreating sharply—yet the extended exposure times and segment-specific supply constraints remain key signals for appraisers, lenders, and realtors navigating valuations and decisions in the coming quarters.
What trends do you expect to see in Q1 2026? I’d love to hear your thoughts—feel free to reply here or reach out directly.
Sources & Further Reading
All data presented in this quarterly update is sourced directly from RMLS and has been subjected to my rigorous cleaning and validation process to ensure reliability for detached single-family residential analysis in the six-county Portland Region. The trends, comparisons, and commentary are the result of original appraisal expertise and independent analysis—not aggregated from secondary sources or news summaries.
- The Portland Region – Six-County Market Area Overview: Portland Appraisal Blog
- RMLS Data Challenges: Portland Appraisal Blog
- The Portland Region Q3 2025 Market Update: Portland Appraisal Blog
- The Portland Region Q2 2025 Market Update: Portland Appraisal Blog
- The Portland Region Q1 2025 Market Update: Portland Appraisal Blog
- Sandy Oregon’s Sewer Moratorium — The End of a 27-Year New Construction Boom: Portland Appraisal Blog
- External Obsolescence in Hillsboro — Residential Market Response to Intel’s 2024–2025 Workforce Reductions: Portland Appraisal Blog
- Portland Affordability Index – PABAI: A Realistic Housing Qualification Metric for the Portland Region: Portland Appraisal Blog

Coda
Thanks for reading—I hope you found a useful insight or an unexpected nugget along the way. If you enjoyed the post, please consider subscribing for future updates.
Are you an agent in Portland who wonders why appraisers always do “x”?
A homeowner with questions about appraiser methodology?
If so, feel free to reach out—I enjoy connecting with market participants across Portland and the surrounding counties, and am always happy to help where I can.
And if you’re in need of appraisal services in Portland or anywhere in the Portland Region, we’d be glad to assist.


