
About This Snapshot
This snapshot summarizes residential sales occurring within the official City of Gresham limits during calendar year 2025 (with some comparisons to calendar year 2024). Included property types are detached homes, attached homes, condominiums, and manufactured homes on owned land. Data are sourced from RMLS and have undergone a rigorous cleaning and validation process. Manufactured homes located in leased-space parks are not included. For additional information regarding data cleaning procedures and common MLS data challenges, see the dedicated page: RMLS Data Accuracy Challenges.
Tables in this snapshot cover important metrics such as:
- Sales price to original list price: SP/OLP
- Price per square foot (total square footage): PPSF (TSF)
- Cumulative days on market: CDOM
- Average lot size in acres: ac
- Number and % of affordable sales
How affordability is defined: The Portland Appraisal Blog Affordability Index (PABAI) was used to evaluate affordability during the study period. PABAI calculates the income needed to buy each home using its actual reported price, taxes, HOA dues, and an insurance estimate, financed at the Freddie Mac 30-year rate in effect at the time of sale. A home is considered affordable if the required income does not exceed the HUD median family income for the Portland-Vancouver-Hillsboro MSA in effect at the time of sale.
Market Overview
Located in eastern Multnomah County, Gresham is Oregon’s fourth-largest city and the second-largest city in the Portland metropolitan region. With a population of approximately 112,000 residents spread across 23.5 square miles, the city serves as an economic and residential center for eastern Multnomah County.
Originally established as an agricultural community, Gresham has evolved into a diverse suburban city with a broad mix of housing types, neighborhoods, and development patterns. The city’s location along Portland’s eastern edge provides residents with access to regional employment centers while supporting a housing market that differs meaningfully from many of the Portland area’s higher-priced communities.
Unlike some of the smaller cities featured in this series, Gresham contains multiple distinct neighborhoods, a wide variety of housing stock, and meaningful concentrations of detached homes, attached homes, condominiums, and manufactured homes on owned land.
Citywide Residential Market Snapshot
The following table summarizes residential sales occurring within Gresham city limits during calendar year 2025. Included property types are detached homes, attached homes, condominiums, and manufactured homes on owned land. Together, these four segments provide a high-level overview of Gresham’s residential market.
| Category | Detached | Attached | Condo | Manuf. |
|---|---|---|---|---|
| Total Dollar Volume | $383,236,603 | $60,231,017 | $20,115,210 | $1,226,000 |
| Average Price | $516,491 | $401,540 | $245,307 | $408,667 |
| Average PPSF (Total SF) | $281.43 | $252.26 | $228.39 | $308.37 |
| Average Total SF | 1,943 | 1,604 | 1,085 | 1,325 |
| Average Lot Size (ac) | 0.2043 | 0.0666 | N/A | 0.1400 |
| Average Age (Yrs) | 39.78 | 7.27 | 41.27 | 29.00 |
| Average CDOM | 55.90 | 54.87 | 89.06 | 33.33 |
| Total # of Sales | 742 | 150 | 82 | 3 |
| % of Market | 75.95% | 15.35% | 8.39% | 0.31% |
| Highest Sale | $2,050,000 | $526,000 | $435,000 | $475,000 |
| Lowest Sale | $230,000 | $215,000 | $126,563 | $362,000 |
| # Affordable | 237 | 126 | 78 | 2 |
| % Affordable | 31.94% | 84.00% | 95.12% | 66.67% |
City of Gresham
January 2025 – December 2025 (977 total residential sales).
Data: RMLS | PortlandAppraisalBlog.com
Gresham generated nearly $465 million in residential sales volume during 2025, with 977 transactions occurring across detached homes, attached homes, condominiums, and manufactured homes on owned land. As Oregon’s fourth-largest city and the Portland region’s second-largest city, Gresham supports a housing market large enough to sustain multiple ownership segments serving different buyer needs and price points.
Detached homes continued to dominate the market, accounting for 742 sales and approximately 82.5% of total residential dollar volume. While detached housing remained the foundation of the ownership market, attached homes and condominiums provided distinct alternatives for buyers seeking lower-cost ownership opportunities.
Attached homes represented a meaningful share of market activity, accounting for 15.35% of all residential sales. The segment was notable for its exceptionally young housing stock, averaging just 7 years old, compared to roughly 40 years for detached homes and 41 years for condominiums. Smaller homes on significantly smaller lots enabled attached housing to deliver newer ownership opportunities at substantially lower prices than detached homes.
Condominiums occupied the lowest-priced ownership tier within the city, averaging approximately $245,000 per sale. Although condos accounted for only 8.39% of total sales, they provided an important ownership option for households seeking lower entry points into the housing market.
Manufactured homes on owned land remained a very small segment, with only 3 sales recorded during 2025. Because of the limited number of transactions, observations regarding manufactured homes should be viewed as descriptive rather than trend-oriented.
Citywide Sales by Housing Type & Neighborhood
While the previous table compared housing activity by segment, the following table examines where those sales occurred. Gresham’s 16 neighborhoods vary considerably in their housing stock, development patterns, and land uses. As a result, different housing types tend to concentrate in different parts of the city.
| Neigh. | # Detached | # Attached | # Condo | #Manuf. |
|---|---|---|---|---|
| Centennial | 50 | 1 | 9 | 0 |
| Central City | 4 | 7 | 0 | 0 |
| Gresham Butte | 94 | 0 | 0 | 0 |
| Gresham Pleasant Valley | 41 | 54 | 0 | 0 |
| Historic Southeast | 31 | 0 | 0 | 2 |
| Hogan Cedars | 29 | 4 | 0 | 0 |
| Hollybrook | 16 | 0 | 14 | 0 |
| Kelly Creek | 135 | 57 | 2 | 0 |
| North Central | 74 | 5 | 1 | 1 |
| North Gresham | 22 | 0 | 1 | 0 |
| Northeast | 18 | 0 | 25 | 0 |
| Northwest | 41 | 6 | 8 | 0 |
| Powell Valley | 47 | 6 | 12 | 0 |
| Rockwood | 56 | 8 | 6 | 0 |
| Southwest | 63 | 1 | 0 | 0 |
| Wilkes East | 21 | 1 | 4 | 0 |
| Total | 742 | 150 | 82 | 3 |
January 2025 – December 2025 (977 total residential sales).
Data: RMLS | PortlandAppraisalBlog.com
All 16 Gresham neighborhoods recorded residential sales during 2025, demonstrating the breadth of housing activity throughout the city. Detached homes generated meaningful sales volume in nearly every neighborhood, reflecting their dominant role within the city’s housing market.
Kelly Creek emerged as Gresham’s most active residential neighborhood, recording 194 total sales across all housing types. The neighborhood led the city in both detached-home sales (135) and attached-home sales (57), making it a significant contributor to overall residential activity.
Attached homes were far more geographically concentrated than detached homes. Kelly Creek and Gresham Pleasant Valley accounted for 111 of the city’s 150 attached-home sales, or approximately 74% of the entire segment. This concentration aligns with the significant amount of recent residential development occurring within those neighborhoods.
Condominium sales were distributed across fewer neighborhoods, with Northeast (25 sales), Hollybrook (14 sales), and Powell Valley (12 sales) recording the highest transaction counts. Together, those three neighborhoods accounted for more than 60% of all condominium sales during the year.
Several neighborhoods were heavily associated with a particular housing type. Gresham Butte recorded 94 detached-home sales with no attached-home or condominium activity, while Central City generated relatively little residential activity overall due to its predominantly non-residential land use pattern.
Detached Homes
Detached homes represent the largest and most active residential housing segment in Gresham. Because detached properties accounted for more than three quarters of residential sales during 2025, this segment provides the clearest view of local market conditions.
Detached Homes Market Statistics
The following table compares detached-home sales activity occurring within Gresham city limits during 2024 and 2025. Metrics include the number of sales, total dollar volume, pricing, property characteristics, marketing times, and affordability.
| Category | 2024 | 2025 | Change |
|---|---|---|---|
| Total $ Volume | $426,573,767 | $383,236,603 | -10.16% |
| Average Price | $520,847 | $516,491 | -0.84% |
| Median Price | $507,530 | $499,700 | -1.54% |
| Avg SP/OLP | 98.87% | 98.11% | -0.77 pts |
| Avg PPSF (TSF) | $282.93 | $281.43 | -0.53% |
| # in HOA | 247 | 152 | -95 homes |
| Avg HOA Dues | $36.64 | $43.42 | +18.50% |
| Avg Total SF | 1,940 | 1,943 | +0.16% |
| Avg Lot Size (ac) | 0.2060 | 0.2043 | -0.80% |
| Avg Age (Yrs) | 35.28 | 39.78 | +4.5 years |
| Avg CDOM | 48.53 | 55.90 | +7.37 days |
| Total # of Sales | 819 | 742 | -77 homes |
| # of New Constr. | 178 | 76 | -102 homes |
| # Affordable | 153 | 237 | +84 homes |
| % Affordable | 18.68% | 31.94% | +13.26 pts |
| Min Required Income | $62,858 | $64,098 | +1.97% |
| Avg Required Income | $141,120 | $139,567 | -1.10% |
City of Gresham
Single-Family Detached Residential | 2024 & 2025
Data: RMLS | PortlandAppraisalBlog.com
Detached-home activity moderated during 2025, though pricing remained remarkably stable. Total sales declined from 819 transactions in 2024 to 742 transactions in 2025, while total dollar volume fell by approximately 10%. However, average price, median price, and price per square foot changed very little, suggesting the market experienced lower transaction volume rather than meaningful price erosion.
One of the more notable shifts occurred within the composition of sales. New-construction detached-home sales declined from 178 homes in 2024 to 76 homes in 2025. When new construction is removed from the equation, resale activity actually increased from an estimated 641 homes in 2024 to 666 homes in 2025. This indicates much of the decline in total sales activity was attributable to fewer newly completed homes reaching the market rather than weakening demand for existing homes.
The reduction in new-construction deliveries also helps explain several other changes within the segment. Average housing age increased by nearly 5 years as fewer newly built homes entered the sales mix, while average home size and lot size remained largely unchanged.
Marketing times increased by approximately one week during 2025, and sellers received slightly lower percentages of their original list prices.
HOA participation declined during 2025—another consequence of fewer new construction homes entering the market. Average HOA dues increased modestly; even with that increase, detached-home HOA costs remained much lower than the attached-home and condominium segments.
Detached Homes Scatter Plots
The following scatter plot provides a visual overview of detached-home sales occurring during 2025. Each point represents a single sale and illustrates the relationship between sale price and date of sale.
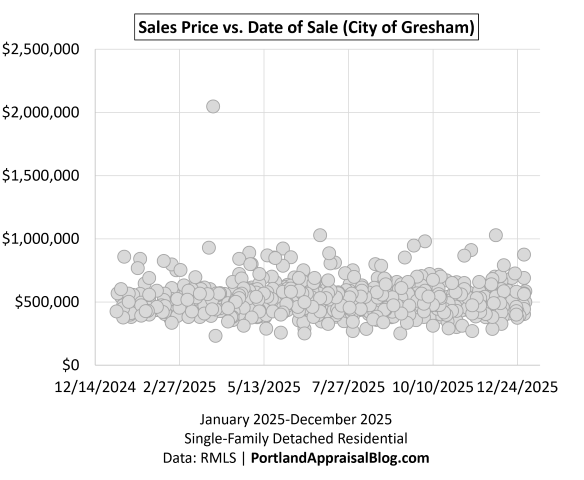
The full scatter plot illustrates the complete range of detached-home sales occurring during 2025, including a detached home that sold for $2.05 million. Because that sale was substantially higher than the rest of the market, it compresses the primary market cluster and makes it more difficult to evaluate pricing patterns among the remaining sales.
The following scatter plot removes that single outlier to provide a clearer view of the detached-home market where the overwhelming majority of transactions occurred.
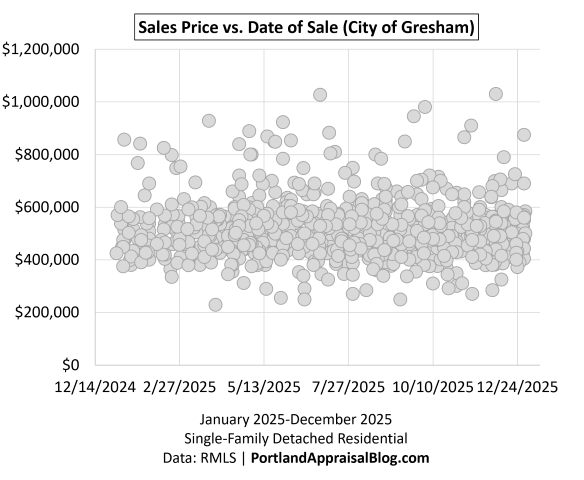
With the $2.05 million sale removed, the primary detached-home market becomes much easier to evaluate. Most transactions clustered between approximately $350,000 and $650,000, reinforcing the concentration of activity within the middle of the market. The concentration of sales within this range reinforces that Gresham’s detached-home market was overwhelmingly middle-market during 2025.
The distribution also appears remarkably stable throughout the year. There is no obvious upward or downward pricing trend visible within the sales cluster, supporting earlier observations that average price, median price, and price-per-square-foot changed very little between 2024 and 2025. Much of the variation visible in the scatter plot reflects differences in individual property characteristics rather than broad shifts in market pricing.
Detached Homes Sales by Price Range
The following table summarizes detached-home sales occurring within Gresham city limits during 2025 by price range. In addition to the number of sales, the table highlights the average price, typical size, construction era, and typical lot size within each price band.
| Price Range | Sales | Avg Close Price | Avg Total SF | Avg Year Built | Avg Acres |
|---|---|---|---|---|---|
| <200K | 0 | — | — | — | — |
| 200K – 249K | 1 | $230,000 | 1,008 | 1955 | 0.230 |
| 250K – 299K | 10 | $273,500 | 1,063 | 1953 | 0.185 |
| 300K – 349K | 15 | $330,407 | 1,365 | 1952 | 0.256 |
| 350K – 399K | 55 | $381,344 | 1,261 | 1964 | 0.181 |
| 400K – 449K | 118 | $425,228 | 1,443 | 1973 | 0.189 |
| 450K – 499K | 176 | $471,933 | 1,729 | 1981 | 0.187 |
| 500K – 549K | 137 | $526,526 | 2,017 | 1994 | 0.178 |
| 550K – 599K | 111 | $570,823 | 2,195 | 1998 | 0.178 |
| 600K – 649K | 43 | $619,687 | 2,457 | 2003 | 0.181 |
| 650K – 699K | 33 | $676,870 | 2,856 | 1993 | 0.234 |
| 700K – 749K | 10 | $723,915 | 3,051 | 2008 | 0.217 |
| 750K – 799K | 8 | $778,775 | 3,075 | 2001 | 0.251 |
| 800K – 849K | 9 | $824,522 | 3,231 | 1990 | 0.406 |
| 850K – 899K | 8 | $867,700 | 3,217 | 1996 | 0.974 |
| 900K – 949K | 4 | $926,665 | 3,826 | 2011 | 0.375 |
| 950K – 999K | 1 | $980,000 | 5,030 | 1992 | 0.670 |
| 1,000K – 1,049K | 2 | $1,028,850 | 3,548 | 2000 | 0.540 |
| 1,050K – 1,099K | 0 | — | — | — | — |
| ≥ 1,100K | 1 | $2,050,000 | 8,612 | 2009 | 2.000 |
| Total/Avg | 742 | $516,491 | 1,943 | 1985 | 0.2043 |
Note: The Total/Avg row reports total sales and all other columns represent averages for the study period.
City of Gresham
Single-Family Detached Residential | 2025
Data: RMLS | PortlandAppraisalBlog.com
Gresham’s detached-home market was heavily concentrated within a relatively narrow range of price points. More than half of all detached-home sales occurred between $450,000 and $600,000, while nearly 90% of all detached sales occurred below $650,000. Although detached homes sold for as much as $2.05 million during 2025, the typical transaction occurred squarely within the middle of the market.
Home size generally increased alongside price. Detached homes in the $400,000–$449,000 range averaged approximately 1,443 square feet, while homes in the $600,000–$649,000 range averaged approximately 2,457 square feet. Buyers generally received more living area as they moved into higher price brackets.
The distribution of new construction homes reveals a clear pattern. Most newly built detached homes sold between $500,000 and $600,000, indicating builders largely targeted the middle portion of the detached-home market rather than either the entry-level or luxury segments.
Price also corresponded with housing age. Lower-priced detached homes were generally built during the 1950s through 1970s, while higher-priced homes tended to be newer. The average construction year generally moves forward as prices increased, reflecting both newer housing stock and larger homes in the upper tiers of the market.
Luxury activity remained limited. Only 25 detached-home sales exceeded $800,000, and only three sales exceeded $1 million.
Detached Homes Required Income & Affordability
The following represents affordability and required income findings for detached homes during 2025 under the Portland Appraisal Blog Affordability Index (PABAI) framework.
| Category | 2024 | 2025 | Change |
|---|---|---|---|
| Total Sales (Detached) | 819 | 742 | -9.40% |
| # of Affordable Sales | 153 | 237 | +84 homes |
| % Affordable | 18.68% | 31.94% | +13.26 pts |
| Min Required Income | $62,857.89 | $64,098.02 | +1.97% |
| Avg Required Income | $141,119.95 | $139,567.00 | -1.10% |
| Median Required Income | $137,238.09 | $134,025.49 | -2.34% |
| Max Required Income | $422,853.10 | $588,101.52 | +39.08% |
City of Gresham
Single-Family Detached Residential | 2025
Data: RMLS | PortlandAppraisalBlog.com
Detached-home affordability improved substantially during 2025. The number of affordable detached-home sales increased by 84 homes, raising the affordability rate from 18.68% to 31.94%. This improvement occurred despite modest changes in pricing, indicating more favorable mortgage rates in 2025 boosted affordability. The detached-home market remained concentrated near the affordability threshold. As a result, shifts in interest rates helped reduce the average and median required incomes. The increase in purchasing power moved a significant number of homes from unaffordable to affordable status.
Entry-level opportunities remained present within the market. The minimum required income changed very little between years, suggesting households at the lower end of the detached-home market encountered similar entry points in both periods. Investigation of the lowest-priced detached-home sales indicates many represented homes requiring some degree of repair or updating.
At the opposite end of the market, a household earning approximately $588,000 annually could have qualified for any detached home that sold during 2025. This figure reflects the upper boundary of the observed market.
The following table summarizes detached-home sales by required income range. In addition to the number of sales, the table highlights the number of affordable sales in each cohort as well as average required income and average close price.
| Income Range | # of Sales | # Affordable | Avg Required Income | Avg Close Price |
|---|---|---|---|---|
| <60K | 0 | — | — | — |
| 60K-69K | 3 | 3 | $66,058 | $250,000 |
| 70K-79K | 6 | 6 | $74,911 | $272,667 |
| 80K-89K | 10 | 10 | $83,937 | $315,010 |
| 90K-99K | 21 | 21 | $95,304 | $361,090 |
| 100K-109K | 70 | 70 | $104,826 | $395,983 |
| 110K-119K | 95 | 90 | $115,545 | $432,677 |
| 120K-129K | 116 | 37 | $124,916 | $466,131 |
| 130K-139K | 98 | 0 | $134,400 | $497,517 |
| 140K-149K | 107 | 0 | $144,846 | $537,276 |
| 150K-159K | 76 | 0 | $154,275 | $568,998 |
| 160K-169K | 51 | 0 | $164,267 | $599,233 |
| 170K-179K | 22 | 0 | $174,499 | $643,932 |
| 180K-189K | 18 | 0 | $184,254 | $682,234 |
| 190K-199K | 14 | 0 | $195,663 | $708,343 |
| ≥200K | 35 | 0 | $245,664 | $880,282 |
| Grand Total | 742 | 237 | $139,567 | $516,491 |
City of Gresham
Single-Family Detached Residential | 2025
Data: RMLS | PortlandAppraisalBlog.com
More than half of all detached-home sales occurred within income bands ranging from approximately $110,000 to $150,000, placing the center of the market close to the region’s median family income.
The largest income cohort was the $120,000–$129,999 range, followed closely by the $140,000–$149,999 and $130,000–$139,999 cohorts. Together, these three groups accounted for more than 43% of all detached-home sales, illustrating how heavily the market was concentrated near the affordability threshold.
Opportunities for households earning less than $100,000 remained present, though they represented a relatively small portion of the market. Only 40 detached-home sales occurred below that level, accounting for approximately 5% of all detached transactions.
Given the HUD median family income for most of 2025 was $124,100, affordability, by definition, vanishes above that required income threshold. However, the adjacent income cohorts ranging from $130,000–$149,999 contained 205 sales, representing 27.6% of the entire detached-home market. Shifts in mortgage rates or larger down payments can place many of those homes within reach of households operating at or near the median family income.
The following table examines required income and affordability within Gresham’s 16 neighborhoods.
| Neigh | # of Sales | Avg Price | # Afford | % Afford | Avg Req Income |
|---|---|---|---|---|---|
| Centennial | 50 | $447,164 | 29 | 58.00% | $118,935 |
| Central City | 4 | $374,500 | 4 | 100.00% | $100,437 |
| Gresham Butte | 94 | $649,823 | 7 | 7.45% | $179,649 |
| Gresham Pleasant Valley | 41 | $563,343 | 2 | 4.88% | $151,846 |
| Historic Southeast | 31 | $460,850 | 17 | 54.84% | $122,297 |
| Hogan Cedars | 29 | $491,374 | 6 | 20.69% | $133,778 |
| Hollybrook | 16 | $471,844 | 8 | 50.00% | $125,387 |
| Kelly Creek | 135 | $542,398 | 18 | 13.33% | $146,909 |
| North Central | 74 | $469,837 | 41 | 55.41% | $125,452 |
| North Gresham | 22 | $441,361 | 13 | 59.09% | $117,468 |
| Northeast | 18 | $476,439 | 6 | 33.33% | $129,985 |
| Northwest | 41 | $498,972 | 8 | 19.51% | $135,326 |
| Powell Valley | 47 | $512,315 | 15 | 31.91% | $138,137 |
| Rockwood | 56 | $394,970 | 48 | 85.71% | $104,361 |
| Southwest | 63 | $564,893 | 5 | 7.94% | $153,254 |
| Wilkes East | 21 | $504,455 | 10 | 47.62% | $135,254 |
| Total/Avg | 742 | $516,491 | 237 | 31.94% | $139,567 |
City of Gresham
Single-Family Detached Residential | 2025
Data: RMLS | PortlandAppraisalBlog.com
Affordability varied considerably across Gresham’s neighborhoods. While the citywide detached-home affordability rate was 31.94%, several neighborhoods substantially exceeded that figure. Rockwood recorded the highest affordability rate among neighborhoods with meaningful sales volume, with 48 of 56 detached-home sales qualifying as affordable. North Gresham, Centennial, North Central, and Historic Southeast also recorded affordability rates exceeding 50%. These neighborhoods benefited from lower average prices and some of the oldest housing stock in the city.
Required incomes generally followed neighborhood pricing. Gresham Butte recorded the highest average sale price and required income, supported by the city’s largest average home size (2,598 SF) and largest average lot size (0.265 acres). Kelly Creek and Gresham Pleasant Valley also generated relatively low affordability rates. Both neighborhoods contain some of the city’s newest detached housing inventory, contributing to higher average sale prices and required incomes.
Attached Homes
Attached homes represent the second largest residential housing segment in Gresham and offer a more compact housing configuration than detached homes while still providing some backyard space.
Attached Homes Market Statistics
The following table compares attached-home sales activity occurring within Gresham city limits during 2024 and 2025. Metrics include the number of sales, total dollar volume, pricing, property characteristics, marketing times, and affordability.
| Category | 2024 | 2025 | Change |
|---|---|---|---|
| Total $ Volume | $25,861,950 | $60,231,017 | +132.89% |
| Average Price | $364,253 | $401,540 | +10.24% |
| Median Price | $373,000 | $409,995 | +9.92% |
| Avg SP/OLP | 98.87% | 98.77% | -0.105 pts |
| Avg PPSF (TSF) | $255.58 | $252.26 | -1.30% |
| # in HOA | 53 | 130 | +77 homes |
| Avg HOA Dues | $210.63 | $166.04 | -21.17% |
| Avg Total SF | 1,451 | 1,604 | +10.56% |
| Avg Lot Size (ac) | 0.0679 | 0.0666 | -1.84% |
| Avg Age (Yrs) | 22.89 | 7.27 | -15.62 years |
| Avg CDOM | 52.58 | 54.87 | +2.29 days |
| Total # of Sales | 71 | 150 | +79 homes |
| # of New Constr. | 7 | 107 | +100 homes |
| # Affordable | 61 | 126 | +65 homes |
| % Affordable | 85.92% | 84.00% | -1.92 pts |
| Min Required Income | $65,597 | $63,400 | -3.35% |
| Avg Required Income | $104,929 | $113,482 | +8.15% |
City of Gresham
Single-Family Attached Residential | 2024 & 2025
Data: RMLS | PortlandAppraisalBlog.com
The attached-home segment expanded dramatically during 2025, with sales volume more than doubling from 71 transactions to 150 transactions. This increase was driven by a substantial increase in new deliveries. The segment added 100 more newly constructed homes, which accounted for 71% of all attached-home sales during 2025.
The influx of newly built inventory reshaped the market. Average home size increased by more than 150 square feet, while average age declined by more than 15 years as newly constructed units came to dominate the sales mix. The increase in average and median sale prices largely reflects this shift toward newer and larger homes rather than broad-based market appreciation.
Lot sizes remained virtually unchanged despite larger homes entering the market, indicating builders were delivering additional living area through more efficient land utilization.
Average HOA dues declined despite a sharp increase in HOA-governed sales. An investigation of new-construction transactions indicates newer attached-home developments generally carried lower HOA obligations than many resale properties within the segment.
Attached Homes Sales Scatter Plot
The following scatter plot provides a visual overview of attached-home sales occurring during 2025. Each point represents a single sale and illustrates the relationship between sale price and date of sale.
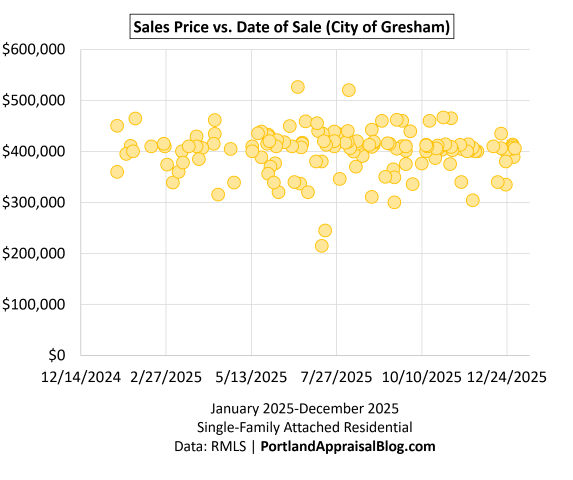
The attached-home market exhibited a remarkably compact price distribution during 2025. Most sales clustered between approximately $350,000 and $450,000.
The scatter plot also shows little evidence of a meaningful upward or downward price trend during the year. Pricing remained relatively stable throughout 2025, suggesting the new deliveries were received by the market without significant price volatility.
Attached Homes Sales by Price Range
The following table summarizes attached-home sales occurring within Gresham city limits during 2025 by price range. In addition to the number of sales, the table highlights the average price, typical size, construction era, and typical lot size within each price band.
| Price Range | Sales | Avg Close Price | Avg Total SF | Avg Year Built | Avg Acres |
|---|---|---|---|---|---|
| <200K | 0 | — | — | — | — |
| 200K – 249K | 2 | $230,000 | 1,124 | 2006 | 0.035 |
| 250K – 299K | 0 | — | — | — | — |
| 300K – 349K | 18 | $331,097 | 1,380 | 2000 | 0.039 |
| 350K – 399K | 28 | $382,514 | 1,536 | 2016 | 0.064 |
| 400K – 449K | 89 | $415,633 | 1,631 | 2023 | 0.070 |
| 450K – 499K | 11 | $460,325 | 1,917 | 2018 | 0.086 |
| 500K – 549K | 2 | $523,000 | 2,142 | 1991 | 0.139 |
| ≥550K | 0 | — | — | — | — |
| Total | 150 | $401,540 | 1,604 | 2018 | 0.0666 |
Note: The Total/Avg row reports total sales and all other columns represent averages for the study period.
City of Gresham
Single-Family Attached Residential | 2025
Data: RMLS | PortlandAppraisalBlog.com
The attached-home market was concentrated within a narrow range of price points. More than 91% of all attached-home sales occurred below $450,000, while nearly 60% occurred within the $400,000–$449,999 price band alone.
New construction activity was similarly concentrated. An investigation of new-construction sales indicates nearly all newly built attached homes sold between $350,000 and $500,000, with the majority falling within the $400,000–$449,999 range. Builders appear to have targeted a specific segment of the ownership market rather than a broad range of price points.
Home size generally increased alongside sale price. Attached homes in the dominant $400,000–$449,999 cohort averaged approximately 1,631 square feet, while homes selling between $450,000 and $549,999 averaged near or above 2,000 square feet.
The table also highlights the relatively standardized nature of attached housing. Lot sizes changed little across the major price cohorts despite meaningful differences in home size and price. No attached-home sales exceeded $549,999 during 2025, reinforcing the segment’s position as a middle-market ownership option within Gresham.
Attached Homes Required Income & Affordability
The following represents affordability and required income findings for attached homes during 2025 under the PABAI framework.
| Category | 2024 | 2025 | Change |
|---|---|---|---|
| Total Sales (Attached) | 71 | 150 | +111.27% |
| # of Affordable Sales | 61 | 126 | +65 homes |
| % Affordable | 85.92% | 84.00% | -1.92 pts |
| Min Required Income | $65,597.43 | $63,399.90 | -3.35% |
| Avg Required Income | $104,929.46 | $113,481.67 | +8.15% |
| Median Required Income | $107,037.41 | $114,806.95 | +7.26% |
| Max Required Income | $132,891.52 | $148,591.79 | +11.81% |
City of Gresham
Single-Family Attached Residential | 2025
Data: RMLS | PortlandAppraisalBlog.com
The attached-home segment remained highly affordable despite a substantial increase in new-construction activity. Affordable sales increased from 61 homes in 2024 to 126 homes in 2025, adding 65 additional affordable attached-home sales. While the volume of affordable homes changed, the affordability rate remained remarkably consistent in both years.
Required incomes increased alongside pricing. Average required income increased by approximately 8%, reflecting the larger and newer homes entering the market. Given average and median prices increased by roughly 10% year over year, the increase in average required income is consistent.
The entry point into the attached-home market changed very little. The minimum required income remained near $64,000, indicating households at the lower end of the market encountered similar ownership opportunities in both years.
At the upper end of the market, a household earning approximately $149,000 annually could have qualified for any attached home that sold during 2025. This figure reflects the upper boundary of the observed market.
The following table summarizes attached-home sales by required income range. In addition to the number of sales, the table highlights the number of affordable sales in each cohort as well as average required income and average close price.
| Income Range | # of Sales | # Afford | Avg Req Income | Avg Close Price |
|---|---|---|---|---|
| <60K | 0 | — | — | — |
| 60K-69K | 1 | 1 | $63,400 | $215,000 |
| 70K-79K | 2 | 2 | $77,091 | $274,450 |
| 80K-89K | 4 | 4 | $87,765 | $326,538 |
| 90K-99K | 10 | 10 | $94,062 | $339,990 |
| 100K-109K | 28 | 28 | $107,521 | $388,195 |
| 110K-119K | 62 | 56 | $115,336 | $404,680 |
| 120K-129K | 40 | 25 | $123,037 | $432,411 |
| 130K-139K | 0 | — | — | — |
| ≥140K | 3 | 0 | $143,366 | $501,667 |
| Grand Total | 150 | 126 | $113,482 | $401,540 |
City of Gresham
Single-Family Attached Residential | 2025
Data: RMLS | PortlandAppraisalBlog.com
The attached-home market was concentrated within a narrow range of required incomes. Approximately 87% of all attached-home sales required between $100,000 and $130,000 of household income, with the $110,000–$119,999 cohort accounting for the largest share of transactions.
The distribution closely mirrors the regional HUD median family income. The largest concentrations of sales occurred within the income ranges immediately surrounding the $124,100 income threshold, indicating builders largely targeted households operating near the middle of the regional income spectrum.
Opportunities for households earning less than $100,000 remained available, though they represented a smaller share of the market. Only 17 attached-home sales (11.3%) required less than $100,000 of household income, while the overwhelming majority of transactions occurred between $100,000 and $130,000.
Relatively little activity occurred at the upper end of the income spectrum. Only three attached-home sales required more than $140,000 of household income, reinforcing the segment’s role as a middle-income ownership option.
| Neigh | # of Sales | Avg Price | # Afford | % Afford | Avg Req Income |
|---|---|---|---|---|---|
| Centennial | 1 | $315,200 | 1 | 100.00% | $84,808 |
| Central City | 7 | $360,129 | 6 | 85.71% | $106,977 |
| Gresham Butte | 0 | — | 0 | — | — |
| Gresham Pleasant Valley | 54 | $422,870 | 42 | 77.78% | $116,551 |
| Historic Southeast | 0 | — | 0 | — | — |
| Hogan Cedars | 4 | $393,075 | 4 | 100.00% | $115,042 |
| Hollybrook | 0 | 0 | — | ||
| Kelly Creek | 57 | $405,022 | 50 | 87.72% | $116,303 |
| North Central | 5 | $389,121 | 4 | 80.00% | $104,772 |
| North Gresham | 0 | — | 0 | — | — |
| Northeast | 0 | — | 0 | — | — |
| Northwest | 6 | $349,983 | 6 | 100.00% | $109,412 |
| Powell Valley | 6 | $408,167 | 3 | 50.00% | $119,113 |
| Rockwood | 8 | $325,231 | 8 | 100.00% | $86,696 |
| Southwest | 1 | $420,000 | 1 | 100.00% | $112,158 |
| Wilkes East | 1 | $385,000 | 1 | 100.00% | $104,697 |
| Total/Avg | 150 | $401,540 | 126 | 84.00% | $113,482 |
City of Gresham
Single-Family Attached Residential | 2025
Data: RMLS | PortlandAppraisalBlog.com
Attached-home activity was heavily concentrated within two neighborhoods. Kelly Creek and Gresham Pleasant Valley accounted for 111 of the city’s 150 attached-home sales, representing approximately 74% of the entire segment. Both neighborhoods were also the primary beneficiaries of the substantial new-construction activity discussed previously.
The two dominant neighborhoods exhibited remarkably similar affordability profiles. Average required incomes were approximately $116,000 in both neighborhoods, suggesting builders targeted a consistent ownership market despite delivering homes in different locations.
Affordability variation was considerably narrower than in the detached-home market. Among neighborhoods with meaningful attached-home activity, affordability generally ranged from approximately 78% to 100%, indicating attached housing remained broadly attainable regardless of neighborhood.
Rockwood once again appeared among the city’s most attainable housing markets. Attached homes in Rockwood averaged approximately $325,000 and required about $86,700 of household income, substantially below the citywide attached-home average.
Condominium Housing
Condominium housing represents the third largest residential housing segment in Gresham and offers a different ownership structure than detached or attached homes. Condominium owners typically own the living area within their unit while sharing ownership of common areas through a homeowners association.
Condominium Housing Market Statistics
The following table compares condominium sales activity occurring within Gresham city limits during 2024 and 2025. Metrics include the number of sales, total dollar volume, pricing, property characteristics, marketing times, and affordability.
| Category | 2024 | 2025 | Change |
|---|---|---|---|
| Total $ Volume | $17,200,824 | $20,115,210 | +16.94% |
| Average Price | $245,726 | $245,307 | -0.17% |
| Median Price | $241,688 | $242,500 | +0.34% |
| Avg SP/OLP | 97.13% | 93.86% | -3.27 pts |
| Avg PPSF (TSF) | $242.03 | $228.39 | -5.63% |
| # in HOA | 70 | 82 | +12 homes |
| Avg HOA Dues | $386.11 | $444.42 | +15.10% |
| Avg Total SF | 1,032 | 1,085 | +5.20% |
| Avg Age (Yrs) | 41.70 | 41.27 | -0.43 years |
| Avg CDOM | 53.03 | 89.06 | +36.03 days |
| Total # of Sales | 70 | 82 | +12 homes |
| # of New Constr. | 0 | 0 | No Change |
| # Affordable | 70 | 78 | +8 homes |
| % Affordable | 100.00% | 95.12% | -4.88 pts |
| Min Required Income | $53,869 | $52,942 | -1.72% |
| Avg Required Income | $82,310 | $85,158 | +3.46% |
City of Gresham
Single-Family Condominium Residential | 2024 & 2025
Data: RMLS | PortlandAppraisalBlog.com
Condominium sales activity increased modestly during 2025, though the underlying market changed very little. Average price, median price, and required incomes were all remarkably stable, indicating the increase in sales volume reflected additional transactions rather than changing market values.
Unlike the attached-home segment, condominiums saw no new-construction activity in either year. The average age of sold units remained approximately 41 years, reinforcing the condominium market’s role as an established resale segment rather than an expanding source of new housing supply.
One of the more notable changes occurred in marketing times. Condominiums required approximately 36 additional days to sell during 2025, while sellers received lower percentages of their original list prices. Even so, prices remained largely unchanged, suggesting longer exposure times did not translate into meaningful price declines.
HOA dues continued to increase, a pattern observed throughout much of the Portland metropolitan region. Condominiums also carried the highest average HOA obligations among Gresham’s major housing segments, reflecting the shared ownership and maintenance structure common to condominium communities.
Average living area increased modestly during 2025 while price per square foot declined. This relationship suggests some of the variation in condominium pricing was attributable to differences in unit size rather than broad shifts in market value.
Condominium Sales Scatter Plot
The following scatter plot provides a visual overview of condominium sales occurring during 2025. Each point represents a single sale and illustrates the relationship between sale price and date of sale with the dots sized by the total square footage of the unit.
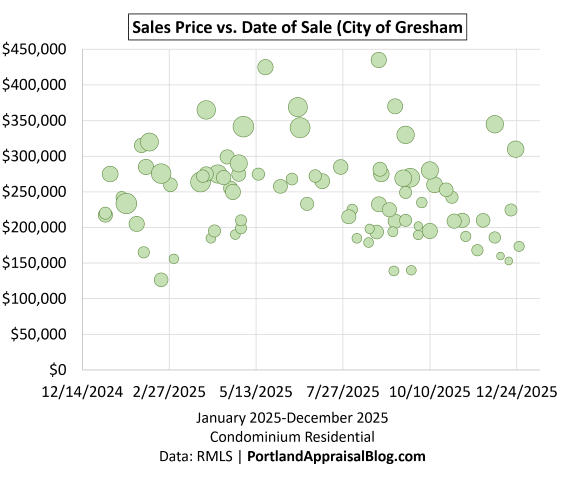
The condominium market exhibited a wider range of prices than attached housing, though most sales remained concentrated below $300,000.
The scatter plot shows little evidence of a sustained upward or downward pricing trend during 2025 when unit size is considered. The apparent variation reflects differences in condominium characteristics rather than changing market conditions. This observation is consistent with the stable average and median prices reported in the previous table.
Condominium Housing Sales by Price Range
The following table summarizes condominium sales occurring within Gresham city limits during 2025 by price range. In addition to the number of sales, the table highlights the average price, typical size, construction era, and typical lot size within each price band.
| Price Range | Sales | Avg Close Price | Avg Total SF | Avg Year Built | Avg HOA $ |
|---|---|---|---|---|---|
| <100K | 0 | — | — | — | — |
| 100K – 149K | 3 | $135,188 | 878 | 1975 | $506.00 |
| 150K – 199K | 19 | $181,681 | 831 | 1982 | $435.16 |
| 200K – 249K | 21 | $221,910 | 1,039 | 1978 | $461.57 |
| 250K – 299K | 27 | $271,560 | 1,198 | 1981 | $449.30 |
| 300K – 349K | 7 | $328,786 | 1,400 | 2004 | $540.07 |
| 350K – 399K | 3 | $368,000 | 1,396 | 2004 | $244.00 |
| 400K – 449K | 2 | $430,000 | 1,210 | 2004 | $160.00 |
| ≥450K | 0 | — | — | — | — |
| Total/Avg | 82 | $245,307 | 1,085 | 1984 | $444.42 |
City of Gresham
Single-Family Condominium Residential | 2025
Data: RMLS | PortlandAppraisalBlog.com
Condominium activity was concentrated within the lower price tiers of the ownership market. More than 81% of condominium sales occurred between $150,000 and $299,999, while approximately 85% of all condominium sales occurred below $300,000.
The distribution highlights the distinct role condominiums play within Gresham’s housing market. While detached and attached homes were concentrated near or above $400,000, most condominium activity occurred at substantially lower price points.
Unit size generally increased alongside price. Condominiums selling below $200,000 typically averaged less than 900 square feet, while units in the upper price ranges commonly exceeded 1,200 square feet.
The age profile of the market also shifted with price. Lower-priced condominiums were generally built during the late 1970s and early 1980s, while the highest-priced units were typically constructed around 2004. The newer construction vintages contributed to the higher prices observed in the upper condominium tiers.
Only 12 condominium sales exceeded $300,000 during 2025, reinforcing the segment’s position as one of the city’s most attainable ownership options.
Condominium Housing Required Income & Affordability
The following represents affordability and required income findings for condominiums during 2025 under the PABAI framework.
| Category | 2024 | 2025 | Change |
|---|---|---|---|
| Total Sales (Condo) | 70 | 82 | +17.14% |
| # of Affordable Sales | 70 | 78 | +8 homes |
| % Affordable | 100.00% | 95.12% | -4.88 pts |
| Min Required Income | $53,868.78 | $52,941.70 | -1.72% |
| Avg Required Income | $82,310.40 | $85,158.34 | +3.46% |
| Median Required Income | $81,961.07 | $82,248.35 | +0.35% |
| Max Required Income | $112,886.42 | $127,977.95 | +13.37% |
City of Gresham
Single-Family Condominium Residential | 2025
Data: RMLS | PortlandAppraisalBlog.com
Condominiums remained the most affordable ownership segment in Gresham during 2025. Seventy-eight of 82 condominium sales qualified as affordable under the PABAI framework, producing an affordability rate of 95.12%.
Required incomes changed very little between years. Average required income increased by approximately 3.5%, while median required income was effectively unchanged. The stability of required incomes mirrors the stability observed in condominium pricing.
Entry-level ownership opportunities remained available throughout the market. The minimum required income remained near $53,000, providing a lower entry point than either detached or attached housing. In fact, the average condominium required approximately $85,000 in household income, substantially below the average required incomes for the detached and attached-home segments.
At the upper end of the market, a household earning approximately $128,000 annually could have qualified for any condominium that sold during 2025. This figure reflects the upper boundary of the observed market.
The following table summarizes condominium sales by required income range. In addition to the number of sales, the table highlights the number of affordable sales in each cohort as well as average required income and average close price.
| Income Range | # of Sales | # Afford | Avg Req Income | Avg Close Price |
|---|---|---|---|---|
| <50K | 0 | — | — | — |
| 50K-59K | 6 | 6 | $55,225 | $151,477 |
| 60K-69K | 11 | 11 | $66,530 | $183,372 |
| 70K-79K | 19 | 19 | $76,519 | $210,592 |
| 80K-89K | 13 | 13 | $83,389 | $246,974 |
| 90K-99K | 19 | 19 | $94,339 | $272,834 |
| 100K-109K | 6 | 6 | $104,742 | $315,333 |
| 110K-119K | 6 | 4 | $117,974 | $370,000 |
| 120K-129K | 2 | 0 | $126,568 | $340,750 |
| ≥130K | 0 | — | — | — |
| Grand Total | 82 | 78 | $85,158 | $245,307 |
City of Gresham
Single-Family Condominium Residential | 2025
Data: RMLS | PortlandAppraisalBlog.com
Condominium sales were concentrated at income levels well below those observed in the detached and attached-home segments. More than 75% of condominium sales required less than $100,000 of household income, with the $70,000–$79,999 and $90,000–$99,999 cohorts accounting for the largest share of transactions.
Condominiums also provided meaningful ownership opportunities for households earning less than $80,000 annually. A total of 36 condominium sales required less than $80,000 of household income, while 17 sales required less than $70,000.
The distribution places the center of the condominium market well below the regional HUD median family income of $124,100. Unlike detached and attached homes, which clustered near the median-income threshold, most condominium activity occurred at income levels comfortably below it.
Relatively little activity occurred at the upper end of the income spectrum. Only eight condominium sales required more than $110,000 of household income, and no condominium sale required more than $130,000. This narrow income distribution reinforces the condominium segment’s role as Gresham’s most attainable ownership option.
The following table examines required income and affordability within Gresham’s 16 neighborhoods for condominiums.
| Neigh | # of Sales | Avg Price | # Afford | % Afford | Avg Req Income |
|---|---|---|---|---|---|
| Centennial | 9 | $301,733 | 9 | 100.00% | $94,777 |
| Central City | 0 | — | 0 | — | |
| Gresham Butte | 0 | — | 0 | — | |
| Gresham Pleasant Valley | 0 | — | 0 | — | |
| Historic Southeast | 0 | — | 0 | — | |
| Hogan Cedars | 0 | — | 0 | — | |
| Hollybrook | 14 | $208,254 | 14 | 100.00% | $71,818 |
| Kelly Creek | 2 | $339,500 | 2 | 100.00% | $95,469 |
| North Central | 1 | $268,000 | 1 | 100.00% | $82,017 |
| North Gresham | 1 | $255,200 | 1 | 100.00% | $85,914 |
| Northeast | 25 | $232,342 | 25 | 100.00% | $85,202 |
| Northwest | 8 | $316,675 | 4 | 50.00% | $111,245 |
| Powell Valley | 12 | $233,181 | 12 | 100.00% | $82,317 |
| Rockwood | 6 | $198,915 | 6 | 100.00% | $72,545 |
| Southwest | 0 | — | 0 | — | |
| Wilkes East | 4 | $237,063 | 4 | 100.00% | $80,648 |
| Total/Avg | 82 | $245,307 | 78 | 95.12% | $85,158 |
City of Gresham
Single-Family Condominium Residential | 2025
Data: RMLS | PortlandAppraisalBlog.com
Condominium activity was concentrated within a handful of neighborhoods. Northeast recorded the highest sales volume with 25 sales, followed by Hollybrook with 14 sales and Powell Valley with 12 sales. Together, these three neighborhoods accounted for more than 62% of all condominium sales during 2025.
Affordability remained remarkably consistent across most neighborhoods. Nearly every neighborhood with condominium activity recorded 100% affordability, with Northwest standing as the primary exception. All four condominium sales that failed to qualify as affordable occurred within that neighborhood.
Hollybrook and Rockwood recorded the lowest average required incomes at approximately $72,000, while Northwest recorded the highest at approximately $111,000.
Manufactured Homes
Manufactured homes represent the smallest residential housing segment in Gresham. While uncommon, they remain part of the city’s ownership market.
Manufactured Homes Market Statistics
The following table compares manufactured-home sales activity occurring within Gresham city limits during 2024 and 2025. Metrics include the number of sales, total dollar volume, pricing, property characteristics, marketing times, and affordability.
| Category | 2024 | 2025 | Change |
|---|---|---|---|
| Total $ Volume | $510,000 | $1,226,000 | +140.39% |
| Average Price | $510,000 | $408,667 | -19.87% |
| Median Price | $510,000 | $389,000 | -23.73% |
| Avg SP/OLP | 94.46% | 98.50% | +4.04 pts |
| Avg PPSF (TSF) | $199.53 | $308.37 | +54.55% |
| # in HOA | 0 | 0 | No Change |
| Avg HOA Dues | — | — | — |
| Avg Total SF | 2,556 | 1,325 | -48.17% |
| Avg Lot Size (ac) | 0.17 | 0.14 | -17.65% |
| Avg Age (Yrs) | 29.00 | 29.00 | No Change |
| Avg CDOM | 390.00 | 33.33 | -356.67 days |
| Total # of Sales | 1 | 3 | + 2 homes |
| # of New Constr. | 0 | 0 | No Change |
| # Affordable | 0 | 2 | +2 homes |
| % Affordable | 0.00% | 66.67% | +66.67 pts |
| Min Required Income | $130,445 | $92,465 | -29.12% |
| Avg Required Income | $130,445 | $107,607 | -17.51% |
City of Gresham
Single-Family Manufactured Residential | 2024 & 2025
Data: RMLS | PortlandAppraisalBlog.com
Manufactured-home sales on owned land remained a very small component of Gresham’s housing market during 2025. With only 3 sales occurring during the year, the figures presented in this section should be viewed as descriptive observations rather than evidence of market trends.
Two of the three manufactured-home sales qualified as affordable under the PABAI framework. The segment required approximately $108,000 of household income on average, placing it between condominiums and attached homes in terms of ownership cost during 2025.
No new manufactured-home construction was recorded in either year, and the average age of sold homes remained unchanged. Unlike the detached, attached, and condominium segments, the limited number of transactions does not permit meaningful conclusions regarding pricing trends, market conditions, or changes in buyer behavior.
Key Takeaways
Gresham’s housing market occupies a unique position within the Portland metropolitan area. While detached homes remained the dominant housing type during 2025, the city offered ownership opportunities across a broad range of price points and housing configurations. Nearly 1,000 residential sales occurred during the year, providing significantly more inventory and choice than many smaller communities throughout the region.
The data suggest Gresham functions primarily as a middle-income housing market. Detached homes were concentrated near the regional median family income, while attached homes and condominiums provided ownership opportunities at lower price points. Affordability outcomes were particularly strong within the attached-home and condominium segments, which remained accessible to many households operating near or below the regional median income.
New construction activity remained concentrated within the detached and attached-home segments. Together, builders delivered 183 newly constructed homes during 2025, with attached housing accounting for the majority of the growth. The attached-home market, in particular, demonstrates how newer ownership housing can be added to the market at price points that remain attainable for a significant share of local households.
Neighborhood differences also played an important role. Affordability, required income, and housing type concentrations varied considerably across the city. Neighborhoods such as Rockwood consistently appeared among the most attainable ownership markets, while newer-growth areas such as Kelly Creek and Gresham Pleasant Valley were characterized by newer housing stock and higher required incomes.
For households seeking homeownership opportunities within commuting distance of Portland, Gresham offers one of the region’s more diverse housing markets. Detached homes, attached homes, condominiums, and manufactured homes on owned land were all present during 2025, allowing buyers to pursue different ownership paths depending on their budget, housing preferences, and income level.
Sources & Further Reading
All data presented in this housing market snapshot is sourced directly from RMLS and has been subjected to a rigorous cleaning and validation process to ensure reliability for single-family residential analysis for the City of Gresham. The trends, comparisons, and commentary are the result of original appraisal expertise and independent analysis—not aggregated from secondary sources or news summaries.
Boundary Definition: Analysis boundaries were established using the official neighborhood map.
- RMLS Data Challenges: Portland Appraisal Blog
- The Portland Region – Six-County Market Area Overview: Portland Appraisal Blog
- Portland Affordability Index – PABAI: A Realistic Housing Qualification Metric for the Portland Region: Portland Appraisal Blog
- Mortgage Rates & the Portland Region Housing Market: Portland Appraisal Blog
- HUD Portland-Vancouver-Hillsboro, OR-WA MSA: Median Household Income
- City of Gresham: Neighborhood Map
- Population & Area Size: City of Grehsam
- Gresham Overview: Wikipedia

Coda
Thanks for reading—I hope you found a useful insight or an unexpected nugget along the way. If you enjoyed the post, please consider subscribing for future updates.
Are you an agent in Portland who wonders why appraisers always do “x”?
A homeowner with questions about appraiser methodology?
If so, feel free to reach out—I enjoy connecting with market participants across Portland and the surrounding counties, and am always happy to help where I can.
And if you’re in need of appraisal services in Portland or anywhere in the Portland Region, we’d be glad to assist.
About the Author — Abdur Abdul‑Malik, SRA, ASA
Abdur Abdul‑Malik is the founder, author, and publisher of the Portland Appraisal Blog, where he produces original regional and neighborhood‑level housing analytics for the Portland Region. He is a certified residential appraiser serving Oregon and Washington, drawing on RMLS transaction data, public records, and custom segmentation models he has built.
He developed the Portland Appraisal Blog Affordability Index (PABAI), a payment‑based affordability metric built from actual RMLS sales. PABAI incorporates weekly updates based on the prevailing 30‑year fixed mortgage rate, providing a locally grounded measure of housing affordability across the region.
Learn more → PABAI explainer • mortgage rate series • full author bio


