Appraisal Deep Dive: Portland Seniors and the Condo Dream — Q3 2025 Data Shows Only 5% of Sales Are Truly Affordable

Dramatic upward view of the entrance facade of the Empress Condominiums at 20 NW 16th Avenue in Northwest Portland, Oregon. Built in 1927 as the Empress Hotel, this five-story brick building was later converted to condominiums. The photo emphasizes the tiled signage, arched window, and vintage lanterns in the Nob Hill/Alphabet District.
Entrance detail of the Empress Condominiums in Northwest Portland—a 1927 building exemplifying the historic character of many pre-1970 condominium conversions in the region.
Photo: Abdur, Abdul-Malik, Portland Appraisal Blog (CC BY-SA 4.0)

Condominiums have long been viewed as an ideal downsizing option for seniors seeking lower-maintenance ownership, potential aging-in-place features, and proximity to urban amenities. National narratives—including recent discussions of a “silver tsunami” of baby boomer downsizers—often highlight condos as a key solution for older households looking to “rightsize.”

Yet Q3 2025 condominium closed-sales data from the Portland Region reveals a starkly different reality for seniors reliant on typical fixed incomes.

Using the Portland Appraisal Blog Affordability Index (PABAI)—a distribution-averaged metric calculated individually for each transaction based on actual sale price, reported HOA dues, and property taxes, combined with current mortgage rates, insurance estimates, and a conservative 20% down payment with 28% qualifying ratio—only 5.4% of the 651 condominium sales (35 units) generated a monthly carrying cost affordable on a median senior household income of approximately $68,284.

This analysis focuses exclusively on single-family residential class condominiums across the Portland Region—the six-county area that is the focus of this blog.

The Equity Divide in the Condo Market

Financing terms, as reported by listing agents in RMLS, tell much of the story (see table below). Cash purchasers accounted for 33.8% of transactions (220 sales) and paid the highest average price ($407,000) while accepting the highest average monthly HOA dues ($669). Conventional financing dominated another 54.1%, reflecting buyers with strong credit and often substantial down payments.

Financing Type% of Sales# SalesAvg Close PriceAvg Monthly HOA
Cash33.8%220$407,000$669
Conv.54.1%352$365,000$460
FHA8.0%52$283,000$403
VA2.6%17$340,000$356
Q3 2025 Portland Region condominium financing terms as reported by listing agents in RMLS, showing average close price and monthly HOA dues by type. (Top 4 financing types only.)
Data: RMLS | Portland Appraisal Blog

In contrast, FHA financing—typically associated with lower down payments and more income-sensitive qualification—represented only 8.0% of sales, with an average close price of $283,000 and more moderate HOA dues ($403 monthly).

This segmentation underscores a clear divide: equity-rich seniors downsizing from detached homes can readily access the market, often paying cash or leveraging large down payments to absorb elevated carrying costs. Seniors without significant prior home equity, reliant primarily on Social Security, pensions, or modest retirement savings, face severe barriers.

Price Distribution and the Narrow Affordable Tier

Q3 2025 condominium sales clustered heavily in the $200,000–$400,000 range, but the truly affordable segment for median senior incomes proved far smaller.

Price Band# Sales% of TotalAvg Close PriceAvg Year BuiltAvg Monthly HOA
Under $200k538%$164,0001968$461
$200–299k21633%$255,0001984$500
$300–399k20331%$346,0001997$431
$400–499k8914%$443,0001999$492
$500k+9014%$779,0001997$889
Q3 2025 Portland Region condominium sales distribution by price band, with average year built and monthly HOA dues.
Data: RMLS | Portland Appraisal Blog

The 35 units affordable under conservative PABAI assumptions were overwhelmingly concentrated in the under-$200,000 and lower $200,000–$299,000 bands—older, smaller properties that appear accessible on purchase price alone.

Age, Obsolescence, and Elevated Carrying Costs

Older condominiums—many conversions of pre-1970 apartment buildings — present particular valuation challenges. The table below excludes new construction deliveries, as agent-reported HOA dues for newly completed projects are often provisional or incomplete.

Year Built Bracket# SalesAvg Close PriceAvg Sq FtAvg Monthly HOAAvg HOA per Sq Ft
Pre-197095$304,000977$572$0.67
1970–1989194$309,0001,146$575$0.52
1990–199943$388,0001,117$555$0.52
2000–2009199$443,0001,265$661$0.54
2010+51$474,0001,394$284$0.26
Average Q3 2025 condominium characteristics by year-built bracket (new construction excluded due to provisional HOA reporting). Pre-2010 stock shows markedly higher HOA burden per square foot.
Data: RMLS | Portland Appraisal Blog

Pre-1970 stock carries the highest average HOA dues per square foot ($0.67), reflecting ongoing capital needs for aging systems, reserves, and occasional special assessments. This elevated recurring cost creates meaningful external obsolescence for income-constrained buyers, even when entry prices appear lower.

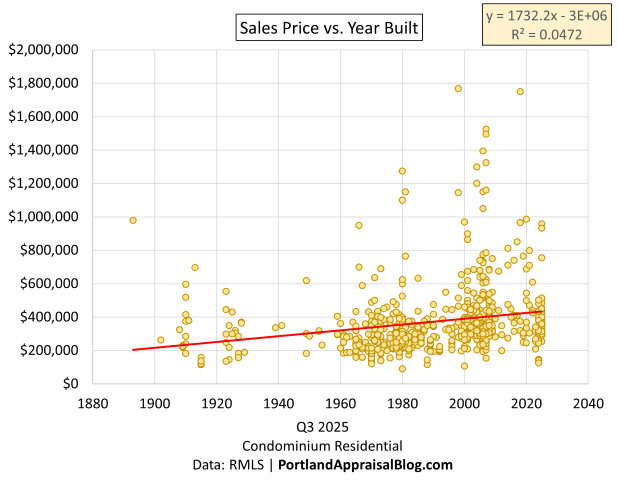
A scatterplot of sales price against year built further illustrates this dynamic. While newer construction generally commands higher prices, the weak correlation (R² = 0.047) confirms that factors beyond age—location, views, amenities, and building quality—dominate value. Older units cluster at lower prices, yet as shown above, they often carry disproportionately high recurring costs.

Scatterplot of condominium sales prices versus year built in the Portland Region for Q3 2025, showing weak correlation between age and value with most sales clustering between $200,000 and $800,000 across 1980–2010 construction.
Sales Price vs. Year Built — Q3 2025 Portland Region condominiums (651 sales). The weak correlation (R² = 0.047) illustrates that location, amenities, and building quality drive value far more than age alone.

County-Level Consistency

The challenge persists across the Portland Region:

County# Sales% Affordable for Seniors
Multnomah4266.3%
Washington1443.5%
Clackamas694.4%
Portland Region Total6515.4%
Share of Q3 2025 condominium sales affordable under conservative PABAI assumptions, by county.
Data: RMLS | Portland Appraisal Blog

No county offers a meaningful suburban relief valve for fixed-income seniors. (Over 98% of Q3 2025 condominium sales occurred in the three counties in the table above.)

Even FHA Terms Do Not Meaningfully Expand Access

Conventional wisdom might suggest FHA financing—with 3.5% down payments and more lenient debt-to-income ratios—would open the market wider for seniors with limited savings. Yet when mortgage insurance premium (0.55% annual) and the resulting larger loan are included, the share of affordable units actually declines to 3.8%.

Higher principal and interest, combined with permanent MIP, outweigh the benefits of lower upfront equity for households with constrained monthly cash flow.

Appraiser Perspective: Comparable Selection and Reconciliation Challenges

When appraising condominiums, comparable selection must account for competitive market segments defined by building age, location, complex-specific amenities, and HOA structure. Units in markedly different projects—for example, a 1960s conversion versus a 2000s high-amenity tower—are rarely direct substitutes.

Differences in functional utility, functional obsolescence, and market-perceived recurring costs often require careful adjustments or exclusion from the primary grid.

Conclusion

While condominiums remain a logical theoretical choice for seniors seeking reduced maintenance and urban access, Q3 2025 condo data demonstrates that ownership is realistically attainable only for those with substantial prior home equity. For senior households reliant primarily on fixed incomes near the median, monthly carrying costs—particularly in older stock with higher HOA burdens—render the vast majority of the market out of reach without additional equity or savings.

Many will continue to rely on rental options or supportive housing models, such as the recently opened Julia West House in Portland, which provides dedicated affordable senior housing.

Senior couple happily moving into a new condominium home, representative of the downsizing dream for many older households in the Portland Region.
For many seniors, condominiums represent an appealing downsizing opportunity—yet Q3 2025 data shows monthly carrying costs limit access for those without substantial equity.
Via Canva Pro

Sources & Further Reading

Decorative text divider.

Thanks for reading—I hope you found a useful insight or an unexpected nugget along the way. If you enjoyed the post, please consider subscribing for future updates.

CODA

Are you an agent in Portland who wonders why appraisers always do “x”?

A homeowner with questions about appraiser methodology?

If so, feel free to reach out—I enjoy connecting with market participants across Portland and the surrounding counties, and am always happy to help where I can.

And if you’re in need of appraisal services in Portland or anywhere in the Portland Region, we’d be glad to assist.

Appraisal Deep Dive: Portland’s First-Time Buyers Have No Choice But to Wait Until 40 — Q3 2025 Data Explains Why

Q3 2025 data shows only 10% of detached homes in the Portland Region were affordable to typical 25–44 households under realistic PITI assumptions using the Portland Appraisal Blog Affordability Index—explaining why first-time buyers have little choice but to wait until age 40.

Two classic homes in a Portland neighborhood, with the right house having sold for $1.1M in Q3 2025.
Classic Craftsman bungalows homes in a Portland neighborhood. While older detached stock like this offered relatively better access for younger buyers in Q3 2025 (15% affordable in Multnomah County under realistic PITI assumptions), many close-in properties commanded premium prices—this example on the right sold for $1.1 million.
Photo: Abdur Abdul-Malik, Portland Appraisal Blog

The National Association of Realtors recently reported that the median age of first-time home buyers has reached 40—the highest on record—with their share of purchases falling to a historic low of 21%. These trends are driven by affordability challenges that national indices like NAR’s Housing Affordability Index attempt to measure.

Using NAR’s standard methodology (principal and interest only, 25% qualifying ratio), approximately 28% of Q3 2025 detached single-family sales in the six-county Portland region were affordable to a household earning the area’s median income of $124,100.

In reality, no buyer escapes property taxes or homeowners insurance. When we incorporate actual taxes from listings and a conservative insurance estimate into the full monthly payment (PITI, 28% ratio), affordability drops to 20% for that same benchmark household.

To provide a more accurate local measure, this analysis introduces the Portland Appraisal Blog Affordability Index (PABAI)—a PITI-based index designed for the Portland Region’s residential market. Like traditional housing affordability indices, the PABAI expresses affordability as an index value where 100 means a household at the reference median income can exactly qualify for the typical home under realistic lending conditions. Values below 100 indicate unaffordability. A secondary calculation—the percentage of sales affordable to that reference household—derives directly from the index and serves as the primary insight in this post. For the overall Portland Region benchmark (using HUD’s Area Median Income of $124,100), the PABAI stood at approximately 78—confirming an unaffordable market even before drilling into younger households.

The challenge is even more severe for the cohort most people associate with first-time buyers: households headed by someone aged 25–44. With a median income of approximately $110,000 (2024 American Community Survey estimate), the PABAI drops to 69—meaning the typical younger household fell 31% short, with only 9.8% of Q3 detached sales (460 homes out of 4,682) within reach. The typical $600,000 detached home required roughly $159,000 in household income—45% above the cohort median.

Q3 2025 Affordability for Younger Buyers — County by County

Q3 2025 PABAI modeling reveals stark geographic variation for households aged 25–44.

CountyMedian Q3 PriceRequired Income for Median Home% of Sales Affordable: 25–44 Age Group
Columbia$471,000$122,00034%
Yamhill$510,000$132,00023%
Multnomah$555,000$150,00015%
Clackamas$675,000$178,0005%
Washington$625,000$165,0003%
Hood River$773,000$195,0003%
Regional$600,000$159,00010%
Percentage of Q3 2025 detached sales affordable to typical 25–44 household under the PABAI (PITI model). Affordability modeled using 20% down payment, 28% front-end ratio, actual weekly rates, listing taxes, and 0.40% annual insurance estimate.
Data: RMLS | Portland Appraisal Blog

Under the PABAI, outer counties like Columbia (34%) and Yamhill (23%) offered the highest shares of reachable detached homes, but this comes with trade-offs. Homes in these more rural areas typically involve longer commute times to Portland’s core amenities, job markets, and urban services—a key consideration for households prioritizing proximity over initial affordability. More urban Multnomah (15%) outperformed the pricier suburban counties of Washington (3%) and Clackamas (5%). Hood River’s premium inventory made it effectively inaccessible at just 3%.

The suburban counties’ low accessibility reflects their inventory mix. Clackamas County’s average lot size in Q3 sales was 1.07 acres—significantly larger than Washington County’s 0.36 acres or Multnomah’s 0.27 acres—contributing to higher median prices and required incomes well above the 25–44 cohort median. Larger lots and newer improvements demand stronger buyer qualifications, while Multnomah’s denser, older stock provided relatively more options for younger households.

Horizontal bar chart showing the percentage of Q3 2025 detached single-family home sales affordable to a typical household aged 25–44 in the Portland region under the Portland Appraisal Blog Affordability Index (PABAI PITI Model). Columbia County leads at 34%, followed by Yamhill (23%), Multnomah (15%), Clackamas (5%), Washington (3%), Hood River (3%), with the regional average at 10%. Data source: RMLS | PortlandAppraisalBlog.com

The Realistic Paths to Ownership for Younger Buyers

For most households in their 20s and 30s, entry into the detached-home market in Q3 2025 required one of three things:

  1. Substantial family assistance (gift for down payment, co-signer, or direct equity help).
  2. Extreme lifestyle sacrifice (aggressive saving for larger down payment, renting with multiple roommates far longer, minimal discretionary spending).
  3. Outlier household income (well above the cohort median—e.g., $150,000+ dual incomes early in careers).

Without one of these, even well-qualified younger buyers were effectively priced out until they aged into higher earnings—typically the late 30s or early 40s. Or they had to consider alternative housing options, like condominiums or townhouses.

This dynamic directly explains the national shift toward older first-time buyers and underscores the limited market participation of younger cohorts in the current environment.

Methodology Note

This analysis introduces the Portland Appraisal Blog Affordability Index (PABAI)—a PITI-based metric designed for the Portland region’s residential market (detached single-family, attached homes, condominiums, and manufactured homes on owned land). The PABAI measures the percentage of sales affordable to a reference household under realistic lending conditions. The PABAI can be calculated for distinct property types or the residential market as a whole. For this post, the PABAI is calculated for detached single-family homes only.

Affordability is modeled using a 20% down payment, 28% front-end housing expense ratio (per Freddie Mac guidelines), actual weekly 30-year fixed rates at closing, property taxes from listings, and a conservative 0.40% annual homeowners insurance rate (aligned with 2025 Oregon averages per Bankrate). Unlike national indices that rely on principal and interest only, the PABAI incorporates full PITI for a more accurate reflection of buyer qualification in the Portland region.

For an overall regional benchmark, the PABAI uses HUD’s Area Median Income for a 4-person household in the Portland–Vancouver–Hillsboro MSA ($124,100 as of 2025). In Q3 2025, the PABAI for this benchmark stood at approximately 78—meaning the typical household at the area median income could afford about 20% of detached sales under realistic PITI assumptions.

Reference incomes for specific age cohorts are estimated from the U.S. Census Bureau’s 2024 American Community Survey (Table B19037) using standard linear interpolation on grouped income data. For households aged 25–44, this yields an estimated median of approximately $110,000. This lowers the PABAI to approximately 69 for this age band, placing only 9.8% of Q3 2025 detached sales within reach.

For quarterly market context, see the Q3 2025 detached single-family update.

Sources & Further Reading

Decorative text divider.

Thanks for reading—I hope you found a useful insight or an unexpected nugget along the way. If you enjoyed the post, please consider subscribing for future updates.

CODA

Are you an agent in Portland who wonders why appraisers always do “x”?

A homeowner with questions about appraiser methodology?

If so, feel free to reach out—I enjoy connecting with market participants across Portland and the surrounding counties, and am always happy to help where I can.

And if you’re in need of appraisal services in Portland or anywhere in the Portland Region, we’d be glad to assist.