
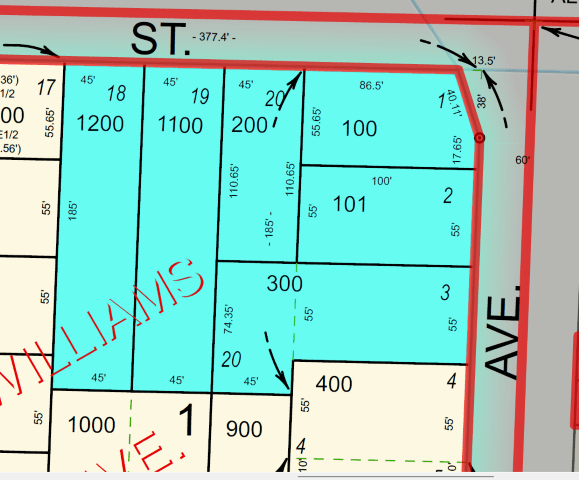
Photo: Abdur Abdul-Malik, Portland Appraisal Blog
Portland’s Quiet Experiment: Turning Spare Rooms into Distributed SROs
Portland is running a quiet housing experiment in 2026, and it requires no new construction, no zoning fights, and no multimillion‑dollar bond measures. The city is simply trying to activate something already sitting inside thousands of local homes: the spare bedrooms.
Launched in February 2026, the Portland Home‑Sharing Pilot Program offers owner‑occupants a one‑time grant—$1,000 for the first room and $500 for each additional room—to make at least one bedroom available for rent at a capped rate of $200 per week, utilities included. Homeowners must live on site, commit to keeping the room(s) available for 12 months, and work through approved providers (currently PadSplit and Ecumenical Ministries of Oregon). Rooms must meet basic habitability standards under ORS 90.320 and be registered under Portland’s Rental Registration Program. Because the tenant must live inside the same dwelling unit as the homeowner, renters share the home’s kitchen and bathroom facilities in virtually all cases.
This is not short‑term rental housing like Airbnb, nor is it a traditional apartment or ADU. It is something different: an informal, distributed form of single‑room occupancy (SRO) housing.
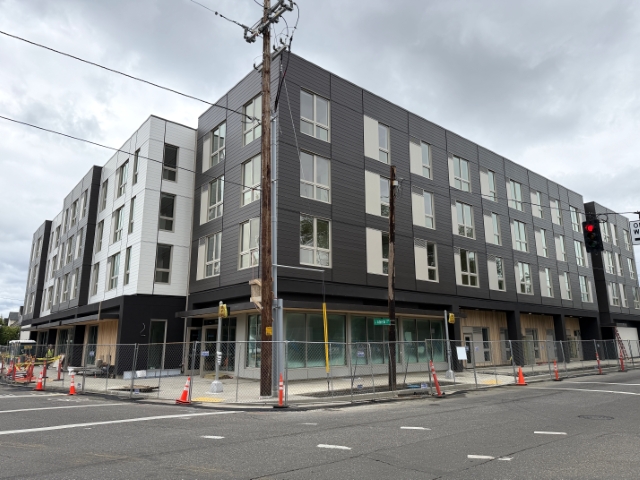
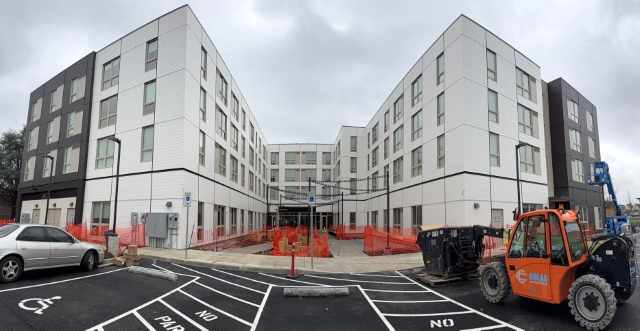
Oregon’s 2023 statewide SRO legalization (ORS 197A.430) laid the legal groundwork. The pilot operationalizes the same concept—private rooms with shared facilities—without requiring new buildings. A purpose‑built SRO like the Alder House in the Pearl District features small private rooms, shared kitchens and baths, and centralized management. The pilot recreates that basic form, but scatters it across hundreds of existing single‑family homes.

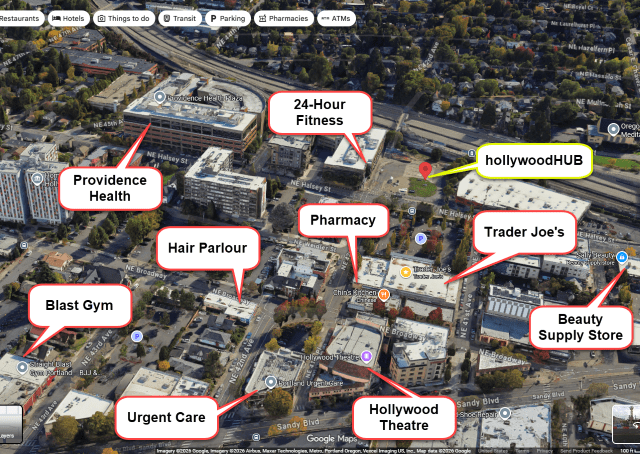
Photo: Abdur Abdul-Malik, Portland Appraisal Blog
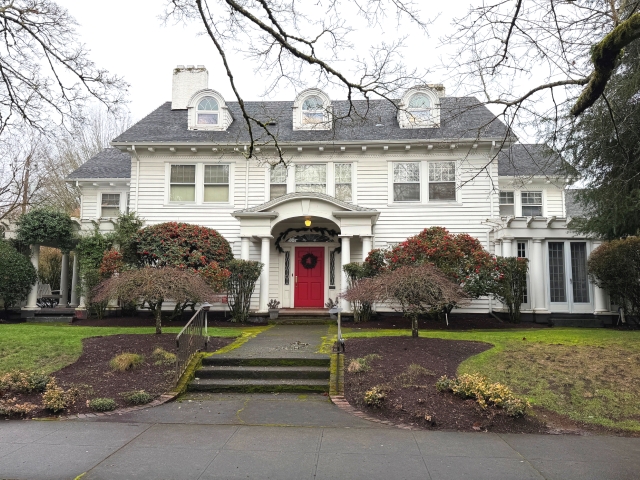
Portland’s housing stock is unusually well‑suited for this model. Many early‑1900s homes contain four, five, or six bedrooms spread across three levels, often with basements that provide natural separation between owner and boarder. Few West Coast cities of similar size have this volume of large, compartmentalized older homes, and that architectural quirk gives the pilot room to function.
Portland is joining a growing list of cities experimenting with room‑rental models as a tool for housing availability. The logic is pragmatic: constructing new deeply affordable units is slow and expensive, while spare bedrooms represent low‑cost “latent capacity.” By requiring owner occupancy, rent caps, and habitability checks, the city hopes to expand housing options without fostering unsafe or absentee‑landlord situations.
It is a creative policy experiment. Yet turning spare rooms into housing supply is not the same as convincing homeowners to participate. The economics, risks, and valuation implications are substantial—and that is where the story becomes especially relevant for appraisers.
Why Homeowners Might Hesitate: Practical, Financial, and Interpersonal Friction
If unlocking spare bedrooms were simply a matter of latent capacity, participation would be straightforward. In reality, those bedrooms sit inside someone’s primary residence. Converting them into rental space introduces proximity, financial, and lifestyle trade‑offs that most homeowners have never faced.
Unlike renting a self‑contained ADU or a fully independent basement apartment, this arrangement means sharing circulation paths, noise, kitchen, and bathroom facilities with a stranger. Even in large early‑1900s Portland homes with three levels and partial separation, daily life overlaps—cooking smells, laundry schedules, late‑night activity, and visitors. For many households, the loss of privacy and control is a significant deterrent.
Financially, the upside is modest. The program caps rent at $200 per week—about $867 per month or $10,400 per year. After increased wear‑and‑tear, higher utility costs, management time, and potential vacancy between tenants, net income for a single room often falls to $500–$650 per month. The one‑time grant ($1,000 for the first room, $500 thereafter) helps with setup but does little for the long‑term picture. Only when homeowners rent multiple rooms does the supplemental income become more meaningful—and at that point, the arrangement begins to resemble a small, owner‑occupied micro‑SRO with all the operational complexity that implies.
A commenter in Willamette Week’s coverage of the pilot captured the prevailing sentiment:
“The potential economic liabilities of participating in this program far outweigh the economic benefits.”
Many Portland homes already use their bedrooms intensively—for children, multigenerational living, home offices, or simply as flexible guest space. A “spare” bedroom is not always functionally spare. Adding a tenant can disrupt household dynamics in ways that are difficult to quantify.
These frictions matter beyond participation rates. They directly influence how appraisers evaluate highest and best use, potential functional obsolescence from increased wear or altered circulation, and long‑term marketability. A home that operates comfortably with one or two boarders may appeal to a narrower pool of future buyers, even if the rental income itself is largely ignored in the appraisal.
The pilot’s success will ultimately hinge on whether enough homeowners decide the trade‑offs are worth it. For appraisers and market participants, that uncertainty is precisely what makes the program worth watching.
Structural Capacity vs. Market Reality
While the previous section outlined why many homeowners may hesitate, the pilot’s very existence rests on a simple fact: Portland’s detached housing stock contains an unusually high number of homes that are structurally well‑suited for room‑rental arrangements. The city’s early‑1900s building patterns, three‑level layouts, and prevalence of basements create a natural foundation for shared‑housing models—at least on paper.
Bedroom Distribution: Portland Has More Large Homes Than People Assume
Detached home sales in 2025 skewed larger than many expect. Nearly 36% of sales had four or more bedrooms, and almost 10% had five or more—precisely the segment most compatible with renting multiple rooms. Since the pilot’s economics only begin to feel meaningful when a homeowner rents two or more bedrooms, this upper tier of the housing stock is where most of the structural feasibility lives.
| Bedrooms | No. Sales | % of Total |
|---|---|---|
| 2 BR | 957 | 17.2% |
| 3 BR | 2,580 | 46.3% |
| 4 BR | 1,466 | 26.3% |
| 5 BR | 430 | 7.7% |
| 6+ BR | 87 | 1.6% |
Single-Family Detached Residential | 2025
Data: RMLS | PortlandAppraisalBlog.com
These larger homes are the natural candidates for the pilot’s model. A homeowner with four, five, or six bedrooms has the physical inventory to rent multiple rooms without displacing household needs—a key distinction from smaller homes where “spare” bedrooms are often functionally occupied.
Basements and Separation: Where Feasibility Improves
Basements are not required for participation, but they meaningfully reduce friction. They create partial separation, allow quieter circulation, and soften the proximity concerns described earlier. Portland’s older housing stock delivers here as well: basement prevalence rises sharply with bedroom count.
| Bedrooms | % With Basement |
|---|---|
| 2 BR | 44.1% |
| 3 BR | 53.9% |
| 4 BR | 75.7% |
| 5 BR | 82.3% |
| 6+ BR | 92.5% |
Data: RMLS | PortlandAppraisalBlog.com
For appraisers, this matters because basements influence functional utility. A compartmentalized three‑level home with a basement offers natural circulation paths that can reduce (but not eliminate) the friction of shared living. At the same time, these same layouts can signal potential functional obsolescence if the home is modified for multiple tenants—keyed bedroom doors, partitioned spaces, mini‑fridges, or heavier wear patterns that diverge from typical single‑family use.
Structural Capacity Does Not Equal Market Acceptance
Portland’s early‑1900s Craftsman, Foursquare, and bungalow stock—with its compartmentalized floor plans rather than open‑concept designs—creates more “latent capacity” for distributed SRO‑style use than is typical in newer, ranch‑heavy suburbs. But structural suitability is only half the equation. A home that functions well for an owner with two or three boarders may appeal to a narrower pool of future buyers, affecting marketability, comparable selection, and the interpretation of contributory value.
This is where the appraisal lens becomes essential. The housing stock provides the physical opportunity, but the market ultimately determines whether that opportunity translates into value, neutrality, or even a discount.
In short, Portland has the physical inventory. The real question—and the one that matters most for appraisers—is how the market treats homes that participate in the pilot. That requires looking beyond structural feasibility and into the valuation mechanics: GRMs, Fannie Mae’s treatment of boarder income, highest and best use, and the limits of value‑in‑use.
That’s where the next section picks up.
The Valuation Blind Spot: Why Room‑Rental Income Rarely Translates Into Market Value
At first glance, the valuation question appears straightforward: if a homeowner rents out one or more bedrooms in their primary residence under the pilot, does the property become an income‑producing asset? Under conventional GSE guidelines and most VA loans, the answer is generally no. FHA is more flexible, but even there the income must be well‑documented and capped. For the overwhelming majority of transactions, the income generated is treated as value‑in‑use for the current owner rather than market value recognizable by buyers and lenders. That distinction is fundamental.
Why the Income Approach Does Not Apply
The pilot’s temporary 12‑month structure alone prevents capitalization. GRM or income‑approach analysis requires a revenue stream that is durable, predictable, and market‑supported. A pilot program—by definition experimental—does not meet that test. Even if the income were otherwise eligible, appraisers cannot assume it will continue beyond the pilot window.
Fannie Mae’s Selling Guide (B3‑3.8‑01) is clear: “generally, rental income from the borrower’s principal residence…cannot be used to qualify the borrower,” and any qualifying rental income must come from a unit that is separate from the primary residence. A bedroom does not meet that standard—it lacks independent living facilities, so the income it produces is not considered rental income for qualifying or valuation purposes. Limited exceptions exist, such as boarder income with a documented 12‑month history or rental income from a true ADU, but neither applies to a bedroom within the primary dwelling.
Freddie Mac’s guidance (Section 5306.1) follows the same logic. Room‑rental income inside the primary residence is treated as boarder income and is ineligible for qualification except under narrow Home Possible exceptions, which cap boarder income at 30% of qualifying income with a 12‑month history.
FHA is more flexible. Mortgagee Letter 2025‑04 allows boarder income with a 12‑month history (at least 9 of the most recent 12 months documented), capped at 30% of effective income, and supported by bank statements, canceled checks, tax returns, shared‑address documentation, and a written agreement. Even so, the income must be stable, well‑documented, and clearly likely to continue.
VA’s treatment is similarly restrictive, though for different reasons. VA does allow temporary boarder income, but only with two years of signed tax returns showing the income, and only when the rental does not impair the residential character of the property or exceed 25% of the total floor area. The underwriter must also determine that the income has a reasonable likelihood of continued success and justify its inclusion on VA Form 26‑6393. In practice, residual‑income requirements and lender overlays mean many VA lenders exclude boarder income entirely unless it has a long, well‑documented history.
Across all major lending frameworks, the conclusion is consistent: room‑rental income under this pilot is not considered stable rental income. It cannot be capitalized, and it carries no weight in the income approach.
Highest and Best Use Implications
For the vast majority of participating homes, highest and best use remains single‑family residential. Renting bedrooms may provide supplemental cash flow for the current owner, but it does not create a new, financially feasible use that changes the legally permissible or maximally productive use of the property.
There are limited exceptions at the margins. In transitional RM1–RM2 zones—where older single‑family homes sit on land with redevelopment potential—stable boarder income could theoretically support an interim highest and best use if the program persists beyond the pilot window. For aging owners, modest supplemental income may extend the economic life of a marginal property. These situations remain rare and highly property‑specific.
Functional Utility and Marketability
Shared‑living arrangements can also affect functional utility. Homes with multiple boarders frequently show keyed bedroom doors, partitioned spaces, additional refrigerators or mini‑kitchens, heavier wear on shared bathrooms, and circulation patterns that feel more communal than private. While most modifications are reversible, they introduce functional obsolescence relative to typical single‑family buyers and often require additional expense or concessions to restore the home to standard configuration.
Marketability can suffer in subtler ways: more vehicles, increased activity, reduced privacy, and access issues during showings. Sellers may also need to vacate the home before listing, and because these occupants are tenants—not ADU tenants, but tenants under Portland’s relocation‑assistance rules—relocation payments may be required. We covered these rules in detail in our November 2025 post on Portland’s tenant protections.
True SRO vs. Distributed Room Rental
Some homeowners may perceive their property as operating like a micro‑SRO, especially when renting two or three rooms. The comparison does not hold for valuation purposes. Legitimate SROs feature separate leases, independent facilities, and regulatory treatment as income properties. A single‑family home with rented bedrooms may have partial separation—some SFRs do have ADU‑like lower levels with their own kitchens, bathrooms, and entrances—but unless the space meets the definition of a separate dwelling unit, the market continues to value it as a standard single‑family residence.
Bottom Line for Appraisers
The income is real to the participating owner, and in isolated cases a niche buyer may pay a modest premium to continue the arrangement. Unpermitted SRO‑style use already exists quietly in some Portland neighborhoods. If the pilot persists and scales, subtle patterns may eventually emerge in comp selection or marketability adjustments.
Under current rules and market evidence, however, room‑rental income from this program does not contribute meaningfully to market value in typical single‑family transactions. For appraisers, the real blind spot is not ambiguity in the guidelines—it is the gap between public perception and how the lending and valuation system actually treats these arrangements.
Portland’s “Noodles on the Wall” Housing Strategy
The Home‑Sharing Pilot is not an isolated policy experiment. It is one piece of Portland’s broader pattern of trying every available tool to address a persistent housing shortage—from large‑scale capital projects to low‑cost, homeowner‑driven solutions.
The city’s current approach runs on two distinct tracks. The first is the traditional capital‑intensive path: supportive housing, regulated affordable multifamily developments, and publicly funded projects that require years of entitlement, bonding, and construction. These are essential but slow and expensive. The second track is distributed and incremental—ADUs, accessory conversions, and programs like home‑sharing that seek to activate capacity already embedded in the existing housing stock. These approaches rely heavily on voluntary homeowner participation and can scale more quickly when incentives align.
The pilot clearly belongs to the second track. It is inexpensive to launch, fast to implement, and attractive because it demonstrates action without massive upfront capital. Yet its success hinges on the same variable that has challenged similar distributed efforts in Portland: homeowner willingness. ADUs took years of code changes, fee reductions, and cultural normalization before meaningful uptake occurred. Inviting a vetted tenant into one’s primary residence through a city program may require an even larger shift in comfort and risk tolerance.
From an appraisal perspective, this dual‑track reality intersects with a deeper structural issue. Portland’s affordability constraints remain severe. The latest Portland Appraisal Blog Affordability Index (PABAI) reading for detached homes stands at 79.2—firmly in the “severely constrained” range. Median‑income households cannot qualify for the typical detached home under standard lending assumptions, so they remain renters longer. That downstream pressure tightens the rental market for the very individuals the home‑sharing pilot hopes to serve as tenants.
Even if participation grows, the valuation and lending system largely ignores the resulting room‑rental income. As detailed earlier, GSE guidelines, FHA flexibilities, and VA restrictions treat most boarder income as non‑qualifying or incidental. This disconnect means the pilot may expand functional housing supply without meaningfully affecting how properties are financed or valued in the marketplace.
Whether the pilot becomes a meaningful contributor to supply or remains a modest experiment will ultimately depend on participation rates, program durability, and homeowner comfort with shared‑living arrangements. For appraisers, the real takeaway is not the program’s potential scale, but what it reveals about the limits of distributed solutions in a market where income from spare bedrooms still does not reliably translate into recognized market value.
Readers interested in how this fits into Portland’s larger affordability efforts can explore our ongoing series on affordable housing and related policy shifts.
Conclusion
Portland deserves credit for experimentation. The Home‑Sharing Pilot represents a low‑cost, low‑friction attempt to activate latent capacity already embedded in the city’s existing housing stock. At the individual level, it may create workable arrangements for both homeowners and renters while revealing how people actually use their homes under sustained affordability pressure.
Yet the pilot also underscores a structural reality that appraisers see every day: the valuation and lending system ultimately sets the practical ceiling for distributed housing solutions. Room‑rental income inside a primary residence is not treated as qualifying rental income by Fannie Mae, Freddie Mac, FHA, or most VA lenders. The result is a meaningful disconnect—the program can improve lived experience for participants without materially changing how properties are financed, underwritten, or valued in the marketplace.
Whether home‑sharing evolves into a meaningful contributor to supply or remains a modest, low‑uptake experiment will depend on participation rates, program durability, and broader cultural comfort with shared‑living arrangements. For appraisers and market participants, the key takeaway is straightforward: watch closely how—and if—these arrangements begin appearing in listings, seller disclosures, and comparable sales. The policy may change over time, but the valuation framework will continue to define its real‑world impact.
Sources & Further Reading
- City of Portland Launches Home Sharing Pilot Program: Announcement
- Home Sharing Pilot Program: Overview
- PadSplit: Website
- EMOregon: Website
- ORS 197A.430: Single Room Occupancies
- ORS 90.320: Landlord To Maintain Premises in Habitable Condition
- Portland Offers $1,000 to Homeowners Who Rent Spare Rooms for 12 Months: Willamette Weekly
- B3-3.8-01, Rental Income: Fannie Mae
- 5306.1 Rental income: Freddie Mac
- Mortgagee Letter 2025-04: FHA
- Pamphlet VAP26-7 Chapter 04 Credit Underwriting: VA
- Oregon Rent Laws vs. Portland’s Tenant Protections: PortlandAppraisalBlog
- The 2025 Portland Region Detached Homes Market in Review: Portland Appraisal Blog
- Portland Affordable Housing: Portland Appraisal Blog
- Portland Affordability Index – PABAI: A Realistic Housing Qualification Metric for the Portland Region: Portland Appraisal Blog

Thanks for reading—I hope you found a useful insight or an unexpected nugget along the way. If you enjoyed the post, please consider subscribing for future updates.
CODA
Are you an agent in Portland who wonders why appraisers always do “x”?
A homeowner with questions about appraiser methodology?
If so, feel free to reach out—I enjoy connecting with market participants across Portland and the surrounding counties, and am always happy to help where I can.
And if you’re in need of appraisal services in Portland or anywhere in the Portland Region, we’d be glad to assist.


.jpg)
.jpg)
.jpg)