Q3 2025 data shows only 10% of detached homes in the Portland Region were affordable to typical 25–44 households under realistic PITI assumptions using the Portland Appraisal Blog Affordability Index—explaining why first-time buyers have little choice but to wait until age 40.
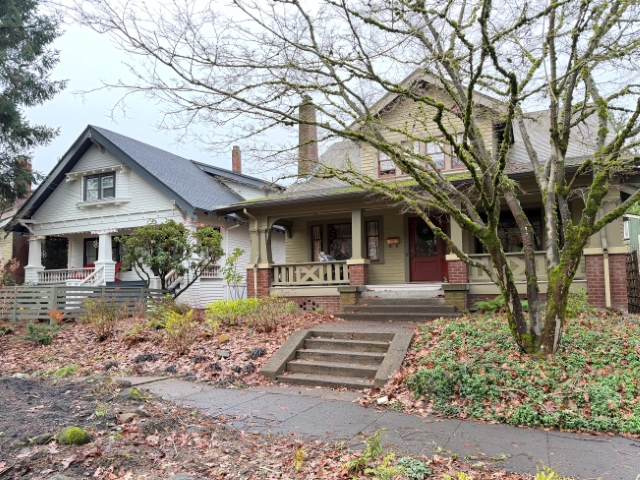
Classic Craftsman bungalows homes in a Portland neighborhood. While older detached stock like this offered relatively better access for younger buyers in Q3 2025 (15% affordable in Multnomah County under realistic PITI assumptions), many close-in properties commanded premium prices—this example on the right sold for $1.1 million. Photo: Abdur Abdul-Malik, Portland Appraisal Blog
The National Association of Realtors recently reported that the median age of first-time home buyers has reached 40—the highest on record—with their share of purchases falling to a historic low of 21%. These trends are driven by affordability challenges that national indices like NAR’s Housing Affordability Index attempt to measure.
Using NAR’s standard methodology (principal and interest only, 25% qualifying ratio), approximately 28% of Q3 2025 detached single-family sales in the six-county Portland region were affordable to a household earning the area’s median income of $124,100.
In reality, no buyer escapes property taxes or homeowners insurance. When we incorporate actual taxes from listings and a conservative insurance estimate into the full monthly payment (PITI, 28% ratio), affordability drops to 20% for that same benchmark household.
To provide a more accurate local measure, this analysis introduces the Portland Appraisal Blog Affordability Index (PABAI)—a PITI-based index designed for the Portland Region’s residential market. Like traditional housing affordability indices, the PABAI expresses affordability as an index value where 100 means a household at the reference median income can exactly qualify for the typical home under realistic lending conditions. Values below 100 indicate unaffordability. A secondary calculation—the percentage of sales affordable to that reference household—derives directly from the index and serves as the primary insight in this post. For the overall Portland Region benchmark (using HUD’s Area Median Income of $124,100), the PABAI stood at approximately 78—confirming an unaffordable market even before drilling into younger households.
The challenge is even more severe for the cohort most people associate with first-time buyers: households headed by someone aged 25–44. With a median income of approximately $110,000 (2024 American Community Survey estimate), the PABAI drops to 69—meaning the typical younger household fell 31% short, with only 9.8% of Q3 detached sales (460 homes out of 4,682) within reach. The typical $600,000 detached home required roughly $159,000 in household income—45% above the cohort median.
Q3 2025 Affordability for Younger Buyers — County by County
Q3 2025 PABAI modeling reveals stark geographic variation for households aged 25–44.
County
Median Q3 Price
Required Income for Median Home
% of Sales Affordable: 25–44 Age Group
Columbia
$471,000
$122,000
34%
Yamhill
$510,000
$132,000
23%
Multnomah
$555,000
$150,000
15%
Clackamas
$675,000
$178,000
5%
Washington
$625,000
$165,000
3%
Hood River
$773,000
$195,000
3%
Regional
$600,000
$159,000
10%
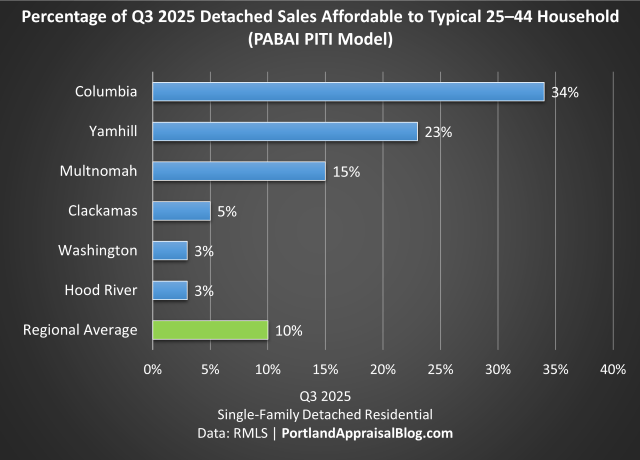
Percentage of Q3 2025 detached sales affordable to typical 25–44 household under the PABAI (PITI model). Affordability modeled using 20% down payment, 28% front-end ratio, actual weekly rates, listing taxes, and 0.40% annual insurance estimate. Data: RMLS | Portland Appraisal Blog
Under the PABAI, outer counties like Columbia (34%) and Yamhill (23%) offered the highest shares of reachable detached homes, but this comes with trade-offs. Homes in these more rural areas typically involve longer commute times to Portland’s core amenities, job markets, and urban services—a key consideration for households prioritizing proximity over initial affordability. More urban Multnomah (15%) outperformed the pricier suburban counties of Washington (3%) and Clackamas (5%). Hood River’s premium inventory made it effectively inaccessible at just 3%.
The suburban counties’ low accessibility reflects their inventory mix. Clackamas County’s average lot size in Q3 sales was 1.07 acres—significantly larger than Washington County’s 0.36 acres or Multnomah’s 0.27 acres—contributing to higher median prices and required incomes well above the 25–44 cohort median. Larger lots and newer improvements demand stronger buyer qualifications, while Multnomah’s denser, older stock provided relatively more options for younger households.
The Realistic Paths to Ownership for Younger Buyers
For most households in their 20s and 30s, entry into the detached-home market in Q3 2025 required one of three things:
Substantial family assistance (gift for down payment, co-signer, or direct equity help).
Extreme lifestyle sacrifice (aggressive saving for larger down payment, renting with multiple roommates far longer, minimal discretionary spending).
Outlier household income (well above the cohort median—e.g., $150,000+ dual incomes early in careers).
Without one of these, even well-qualified younger buyers were effectively priced out until they aged into higher earnings—typically the late 30s or early 40s. Or they had to consider alternative housing options, like condominiums or townhouses.
This dynamic directly explains the national shift toward older first-time buyers and underscores the limited market participation of younger cohorts in the current environment.
Methodology Note
This analysis introduces the Portland Appraisal Blog Affordability Index (PABAI)—a PITI-based metric designed for the Portland region’s residential market (detached single-family, attached homes, condominiums, and manufactured homes on owned land). The PABAI measures the percentage of sales affordable to a reference household under realistic lending conditions. The PABAI can be calculated for distinct property types or the residential market as a whole. For this post, the PABAI is calculated for detached single-family homes only.
Affordability is modeled using a 20% down payment, 28% front-end housing expense ratio (per Freddie Mac guidelines), actual weekly 30-year fixed rates at closing, property taxes from listings, and a conservative 0.40% annual homeowners insurance rate (aligned with 2025 Oregon averages per Bankrate). Unlike national indices that rely on principal and interest only, the PABAI incorporates full PITI for a more accurate reflection of buyer qualification in the Portland region.
For an overall regional benchmark, the PABAI uses HUD’s Area Median Income for a 4-person household in the Portland–Vancouver–Hillsboro MSA ($124,100 as of 2025). In Q3 2025, the PABAI for this benchmark stood at approximately 78—meaning the typical household at the area median income could afford about 20% of detached sales under realistic PITI assumptions.
Reference incomes for specific age cohorts are estimated from the U.S. Census Bureau’s 2024 American Community Survey (Table B19037) using standard linear interpolation on grouped income data. For households aged 25–44, this yields an estimated median of approximately $110,000. This lowers the PABAI to approximately 69 for this age band, placing only 9.8% of Q3 2025 detached sales within reach.
Thanks for reading—I hope you found a useful insight or an unexpected nugget along the way. If you enjoyed the post, please consider subscribing for future updates.
Coda
Are you an agent in Portland who wonders why appraisers always do “x”?
A homeowner with questions about appraiser methodology?
If so, feel free to reach out—I enjoy connecting with market participants across Portland and the surrounding counties, and am always happy to help where I can.
And if you’re in need of appraisal services in Portland or anywhere in the Portland Region, we’d be glad to assist.
About the Author — Abdur Abdul‑Malik, SRA, ASA
Abdur Abdul‑Malik is the founder, author, and publisher of the Portland Appraisal Blog, where he produces original regional and neighborhood‑level housing analytics for the Portland Region. He is a certified residential appraiser serving Oregon and Washington, drawing on RMLS transaction data, public records, and custom segmentation models he has built.
He developed the Portland Appraisal Blog Affordability Index (PABAI), a payment‑based affordability metric built from actual RMLS sales. PABAI incorporates weekly updates based on the prevailing 30‑year fixed mortgage rate, providing a locally grounded measure of housing affordability across the region.
Q3 2025 RMLS data shows the Portland Region’s detached starter homes (5th–35th percentile) average $469k and are dominated by mid-century builds on larger lots—with new construction offering modern features but far less space. Appraisal and buyer insights below.
A classic early-20th-century bungalow in the Portland area—the type of modest, well-loved home that dominates today’s starter-tier inventory. Via Canva Pro
Earlier this month, Redfin highlighted Portland as one of the stronger markets nationally for starter-home activity, defining starter homes as sales in the 5th–35th percentile by price. We adopt the same percentile convention here for consistency.
Redfin’s reported median of approximately $420,000 for Portland starter homes includes all property types (condos, townhomes, and single-family). Focusing solely on detached single-family residences—a popular choice across the region, including for many urban buyers seeking yard space and privacy over attached ownership—Q3 2025 RMLS data for the 5th–35th percentile tier shows an average close price of $469,000.
Few would be surprised that new construction plays a limited role in true entry-level pricing—after all, building costs remain elevated. Yet the data shows builders are still delivering a modest but meaningful number of brand-new homes into this tier (about 4.2% of starter sales, compared to 9.1% across the full market). This demonstrates that, through efficient design, infill strategies, and lot divisions, new product can compete in the lower price bands.
Local buyers want to know: how much home does a starter budget actually buy? This analysis examines square footage, lot size, build era, and location differences across counties—revealing a market dominated by mid-century homes with a modest but noteworthy presence of brand-new construction.
How Much Home a Starter Budget Buys by County
The table below summarizes Q3 2025 closed sales for detached single-family homes in the 5th–35th percentile across the core Portland Region counties (Hood River row excluded due to only two qualifying sales).
County
Avg Close Price
Avg Yr Built
Avg Total SF
Avg Acres
# of Sales
Clackamas
$474,738
1965
1,553
0.279
256
Columbia
$457,108
1983
1,774
0.617
58
Mult.
$459,909
1951
1,591
0.163
666
Wash.
$488,954
1976
1,495
0.154
323
Yamhill
$453,522
1981
1,532
0.197
113
Grand Total
$468,595
1963
1,565
0.203
1,418
Data: RMLS | Portland Appraisal Blog
Multnomah County drives nearly half the volume, delivering the oldest average build year (1951). Washington County posts the highest average prices and hosts the most new construction. Outer counties like Columbia and Yamhill provide newer homes on larger parcels, though with far fewer transactions.
Surprisingly, across the region, starter homes are very similar in average price. The standard numerical metrics which are easy to see in RMLS, (e.g. total square footage, lot size, year built, etc.), are not the primary determinant of value. As we shall see, what matters more is quality, condition, and overall site & functional utility. Buyers in the starter home tier make conscious trade-offs between older homes with larger lots and newer homes with little to no functional backyard.
Of all the standard numeric metrics, total square footage shows one of the stronger relationships with price in the starter tier—though the influence is still modest.
Close Price vs. Total Square Feet for Starter-Tier Detached Homes ≤ 0.5 Acres (Q3 2025 RMLS data – 1,380 observations). Note: The Y-axis begins at $350,000 to allow for better viewing of the dataset.
Larger homes tend to sell for higher prices, though with considerable variation—most sales fall between 1,200 and 2,000 square feet. The very slight tilt to the right indicates a weak but present relationship between starter home size and close price. The coefficient of determination (R2) for this graph is 0.1253, meaning total square footage explains only about 12.5% of the variation in price. Since total square footage is often one of the primary determinants of value in the broader housing market, this is a big clue that the size of the home isn’t the primary factor for buyers looking to enter the starter home market.
The Historical Supply Pattern: Lot Size and Build Era
Portland’s entry-level inventory bears the clear imprint of the post-war building boom.
Lot Size vs. Year Built for Starter-Tier Detached Homes ≤ 0.5 Acres (Q3 2025 RMLS data – 1,380 observations).
A polynomial trendline highlights the peak lot sizes during the 1940s–1950s post-war era, followed by a steady decline that began in the early 1960s and accelerated in recent decades. The pattern reflects an era when generous lots were standard, followed by shrinking parcels as land values rose, urban growth boundaries took effect, and lot divisions became common. Buyers choosing older starter homes today typically gain significantly more outdoor space than those selecting new construction.
New Construction: A Modest but Noteworthy Presence
While new homes account for only 4.2% of starter-tier sales, their ability to reach this price range in a high-cost building environment remains impressive.
Segment
Avg Close Price
Avg Total SF
Avg Acres
# of Sales
Existing
$467,996
1,569
0.207
1,359
New
$482,387
1,479
0.107
59
Grand Total
$468,595
1,565
0.203
1,418
Data: RMLS | Portland Appraisal Blog
New homes sell for only about 3% more than existing ones despite brand-new condition, but deliver less interior space and roughly half the land.
Buying a new home in the starter tier is akin to buying a new car on a tight budget: you gain the benefits of fresh systems, modern design, and warranty peace of mind, but often in a smaller package with fewer amenities compared to a well-maintained used model from a higher trim line.
County
Avg Close Price
Avg Yr Built
Avg Total SF
Avg Acres
# of Sales
Clackamas
$489,803
2025
1,606
0.154
8
Columbia
$420,000
2025
1,458
0.130
2
Mult.
$450,820
2025
1,098
0.088
18
Wash.
$509,366
2025
1,699
0.079
25
Yamhill
$475,578
2025
1,540
0.216
6
Grand Total
$482,387
2025
1,479
0.107
59
Data: RMLS | Portland Appraisal Blog
For buyers, this creates a clear choice: a brand-new home with modern efficiency but typically on a very small lot—often with minimal or no usable yard space, especially in Multnomah and Washington counties where most new construction occurs—or an existing mid-century home that generally offers significantly more land and outdoor space, albeit with the potential challenges of older systems and layouts. This trade-off is particularly relevant for growing families or those prioritizing play areas, gardens, or privacy.
Appraisal Insights and Challenges
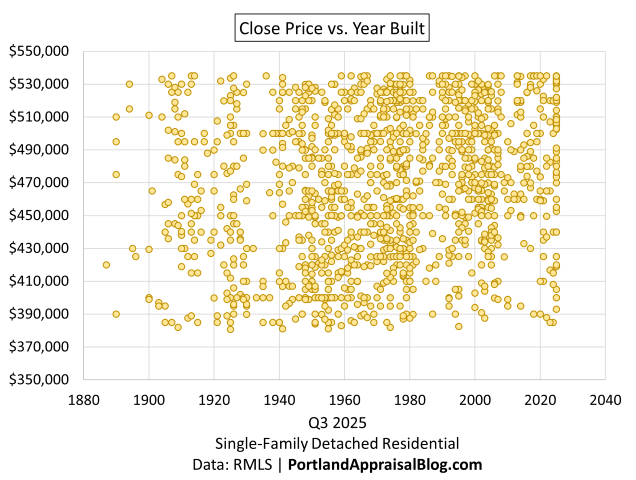
One of the most revealing patterns appears when plotting close price against build year.
Close Price vs. Year Built for Starter-Tier Detached Homes ≤ 0.5 Acres (Q3 2025 RMLS data – 1,380 observations). Note: The Y-axis begins at $350,000 to allow for better viewing of the dataset.
The remarkably consistent price band across decades illustrates that chronological age has little direct influence on value in the Portland Region’s entry-level segment.
In this tier, actual age correlates weakly with sales price because buyers weigh multiple factors:
Functional obsolescence in mid-century stock (outdated floor plans, smaller kitchens/bathrooms, less efficient systems) is often mitigated by updates and strong location appeal.
Effective age and condition drive far more of the value than the original build date.
Lot size and site utility frequently favor older homes; the smaller parcels common in new construction require substantial negative adjustments that offset much of the credit for new condition.
Comparable selection remains within county, where abundant mid-century comps in Multnomah, Clackamas, and Washington provide solid support — but thinner volume in outer counties demands careful bracketing.
When appraising a new-construction home in this tier—where truly similar recent sales are still limited and down approximately 25% year-over-year in Q3 2025 (with Multnomah County off 48%)—appraisers typically rely on other relatively recent builds (often within 10 years) and apply appropriate adjustments for differences in site characteristics, size, and location.
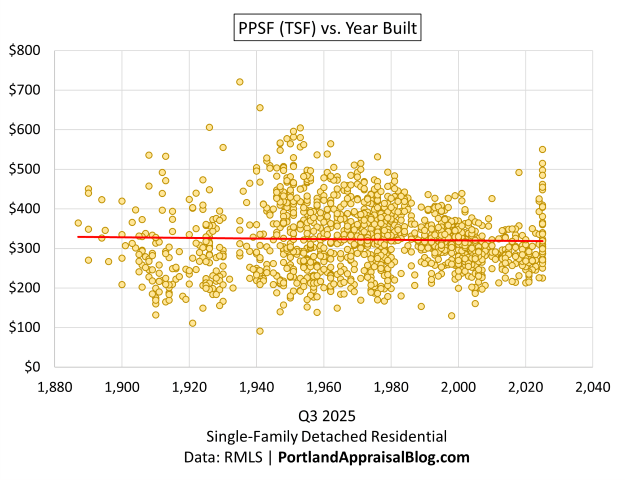
The same pattern holds when looking at the data from a price-per-square-foot lens, but with a slight twist:
PPSF (TSF) vs. Year Built for Starter-Tier Detached Homes ≤ 0.5 Acres (Q3 2025 RMLS data – 1,380 observations).
From the 1950s onward, PPSF becomes progressively more compressed—older homes exhibit wide spreads driven by dramatic differences in condition, updates, historic appeal, and location premiums, while mid-era and late-20th-century stock tightens as market expectations and remodeling homogenize perceived value.
Brand-new 2025 homes, however, break this decades-long compression pattern. Their PPSF spreads out again, reflecting greater influence from location-driven land costs and builder-specific choices (e.g., finishes, lot configuration) rather than the uniformity imposed by age and updates on existing stock. In effect, today’s entry-level new construction reintroduces variation that mirrors pre-1950 homes—but for different reasons: land value dominance and strategic specs to hit price points, rather than condition swings. This underscores why new-construction starter homes often form their own submarket. Appraisers valuing them face a narrower but distinct comp pool.
These dynamics show that the starter home market is not uniform and the appraiser needs to carefully delineate the competitive market segment to avoid having to make large adjustments between disparate properties. One technique appraisers often employ is to use similar, but older sales when recent data is thin and make an appropriate market conditions adjustment.
Conclusion
The Portland Region’s Q3 2025 starter-home segment continues to rely predominantly on mid-century inventory on lots larger than anything new we’re building today—a pattern unlikely to shift dramatically in 2026 absent major changes in new supply. (Although the City of Portland is certainly trying to incentivize new projects with SDC waivers.) The modest foothold of new construction shows builders adapting through infill and efficient design, but at the clear cost of site size and outdoor space.
For buyers, the choice boils down to priorities: modern and low-maintenance on a small lot, or more space and yard with the realities of an older home. For appraisers, lenders, and agents, recognizing how effective age, site utility, location, and condition outweigh chronological age remains key to accurate valuation in this segment.
Portland’s Temporary SDC Exemption for New Housing Units (2025–2028): Portland Appraisal Blog
Thanks for reading—I hope you found a useful insight or an unexpected nugget along the way. If you enjoyed the post, please consider subscribing for future updates.
Coda
Are you an agent in Portland who wonders why appraisers always do “x”?
A homeowner with questions about appraiser methodology?
If so, feel free to reach out—I enjoy connecting with market participants across Portland and the surrounding counties, and am always happy to help where I can.
And if you’re in need of appraisal services in Portland or anywhere in the Portland Region, we’d be glad to assist.
About the Author — Abdur Abdul‑Malik, SRA, ASA
Abdur Abdul‑Malik is the founder, author, and publisher of the Portland Appraisal Blog, where he produces original regional and neighborhood‑level housing analytics for the Portland Region. He is a certified residential appraiser serving Oregon and Washington, drawing on RMLS transaction data, public records, and custom segmentation models he has built.
He developed the Portland Appraisal Blog Affordability Index (PABAI), a payment‑based affordability metric built from actual RMLS sales. PABAI incorporates weekly updates based on the prevailing 30‑year fixed mortgage rate, providing a locally grounded measure of housing affordability across the region.
How pre-1997 Portland metro homes—especially those with veteran or active-duty exemptions—are facing sudden property tax jumps on sale or disqualification.
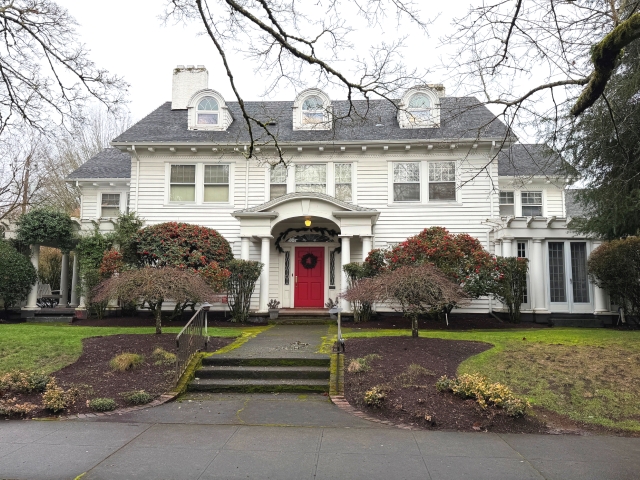
A classic pre-1940 home in the Portland Region – the type of property often benefiting from deep Measure 50 tax compression. Photo: Portland Appraisal Blog
Imagine closing on a well-maintained pre-1940 Craftsman in an established close-in Portland neighborhood. The sale price felt fair, the taxes shown on the listing and county statement appeared reasonable, and the transaction cleared due diligence without issue. Then the next year’s tax bill arrives—$2,000 to $6,000 higher than anticipated. The increase isn’t due to a sudden spike in market value, but to a change in how Oregon counties now calculate Maximum Assessed Value (MAV) when certain partial property tax exemptions end.
This situation is no longer hypothetical. Oregon REALTORS first highlighted the risk in a December 12th, 2025 internal “Forms Tip of the Week” communication, alerting members that the loss of veteran or active-duty partial exemptions—commonly triggered when a qualifying veteran or surviving spouse sells the home or passes away without a qualifying successor—can lead to significant tax increases under updated guidance from the Oregon Department of Revenue.
While the veteran and active-duty exemptions (ORS 307.250 and 307.286) have drawn attention to the issue, the underlying driver is broader: the substantial tax compression created by Measure 50 for properties built or long-held before 1997.
Historically, when these modest partial exemptions ended, counties simply removed the discount and allowed the low underlying MAV to continue. The 2024 guidance change now enforces a constitutional requirement to reset MAV closer to current market reality upon disqualification.
The outcome: buyers may face permanently higher carrying costs they did not expect, sellers (including veterans and surviving spouses) can find their properties harder to market at full value, and appraisers encounter a marketability factor worthy of note when present.
This Deep Dive reviews the mechanics, illustrates the pattern with Portland Region sales data, and provides practical steps for identifying and addressing the issue in appraisal assignments.
Understanding Measure 50: The Foundation of Tax Compression
To grasp why the loss of a veteran or active-duty exemption can now lead to significant tax increases, we must first understand Oregon’s Measure 50 property tax system, approved by voters in 1997.
Measure 50 replaced the previous tax structure with two key values for each property:
Real Market Value (RMV): The county assessor’s estimate of what the property would sell for on the open market. This value can rise or fall annually with market conditions.
Maximum Assessed Value (MAV): A separate taxable value created by Measure 50. For existing properties in 1997, MAV was initially set at approximately 90% of the 1995–1997 RMV. Thereafter, MAV is generally limited to a 3% annual increase, with exceptions for major additions, improvements, or certain other events.
The Assessed Value (AV) is the lesser of RMV or MAV. Taxes are calculated by multiplying the AV by the local tax rate.
In high-appreciation markets like the Portland metro area, this 3% cap creates substantial tax compression over time. A home purchased or built before 1997 can have an MAV far below its current RMV after decades of strong market growth.
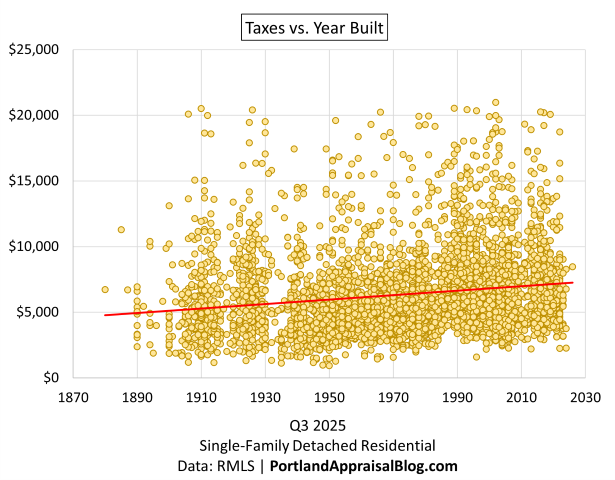
Annual property taxes vs. Year Built, excluding new construction and obvious data errors. Note: Scatter plots are limited to properties with annual taxes of $21,000 or less to highlight the primary distribution and improve readability.
The scatter illustrates the effect clearly: pre-1960 homes are overwhelmingly clustered below $10,000–$12,000 in annual taxes, with the densest grouping under $8,000–$9,000. Properties on the far left (pre-1920 builds) often show the deepest compression, having benefited from the longest period of capped MAV growth. Post-1990 homes, by contrast, display significantly higher tax burdens, reflecting less historical compression.
When a triggering event occurs—such as disqualification from a partial exemption—the MAV can be recalculated using the Changed Property Ratio (CPR), typically around 0.54 for residential properties in Portland Region counties for the 2025–2026 tax year, applied to current RMV.
In the next section, we examine local sales data that quantifies the scale of this compression and illustrates why the reset can matter in real transactions.
The Data: Tax Compression in the Portland Metro Market
Q3 2025 sales data from detached single-family residences (SFR) in the Portland Region (Clackamas, Columbia, Hood River, Multnomah, Washington, and Yamhill counties) illustrates the scale of Measure 50 compression and why a MAV reset can create material differences in carrying costs.
The table below summarizes average sale prices and annual property taxes by approximate decade built. Flagged new construction is excluded due to frequently incomplete or preliminary tax assessments at the time of sale, which can distort the pattern of long-term compression. This brings the Q3 2025 dataset to 4,256 sales total.
Decade Bucket
Avg Sale Price
Avg Annual Taxes
Avg Tax per $1k Sale Price
Pre-1940
$671,295
$6,396
$9.33
1940–1959
$607,466
$5,766
$9.53
1960–1979
$640,000
$5,783
$9.16
1980–1999
$714,535
$7,367
$10.31
2000–2019
$761,061
$7,685
$10.10
2020+ (non-new construction)
$924,420
$8,016
$9.12
Grand Total (excluding new construction)
$688,838
$6,665
$9.68
Data: RMLS | Portland Appraisal Blog
Several patterns stand out:
Absolute tax burden increases with newer construction: pre-1980 homes average $5,766–$6,396 in annual taxes, while 2000–2019 properties average $7,685 and 2020+ non-new construction reaches $8,016.
Effective burden consistency: The Tax per $1k column remains remarkably stable at ~$9–$10 across all eras. This indicates the market prices properties assuming a similar overall tax load, regardless of age.
Pre-1940 premium: Outside recent construction, pre-1940 homes command the highest average sale prices ($671,295) despite paying among the lowest absolute taxes.
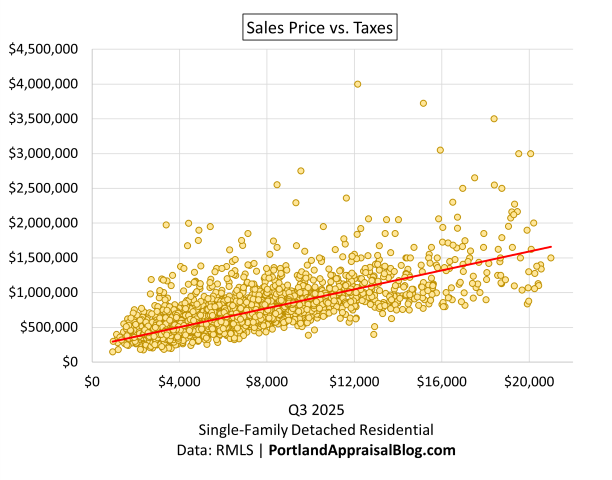
Street sign in Portland’s Historic Irvington neighborhood—one of the areas with many high-value pre-1940 homes exhibiting significant Measure 50 compression. Photo: Portland Appraisal Blog (CC BY-SA 4.0)Sale price vs. annual taxes, excluding new construction and obvious data errors. Note: Scatter plots are limited to properties with annual taxes of $21,000 or less to highlight the primary distribution and improve readability.
This scatter shows a strong positive correlation, confirming the market efficiently incorporates expected tax burden into pricing.
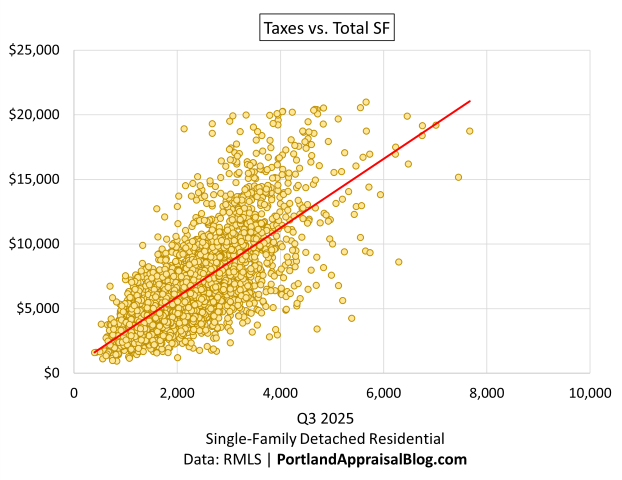
Annual taxes vs. total square footage, excluding new construction and obvious data errors. Note: Scatter plots are limited to properties with annual taxes of $21,000 or less to highlight the primary distribution and improve readability.
Here, numerous low-tax outliers are visible below the trend line—properties paying substantially less than size and location would otherwise suggest, consistent with Measure 50 compression.
Taken together, the data reveals a market that rewards older stock with lower absolute taxes without discounting sale prices accordingly. When a MAV reset occurs, absolute taxes move toward levels seen in newer comparable properties, creating the potential for noticeable increases in annual carrying costs.
In the following sections, we explore the specific veteran and active-duty exemptions and the 2024 guidance change that can trigger this alignment.
The Veteran and Active-Duty Exemptions
The exemptions at the center of the current concern are partial property tax reductions for certain military veterans, surviving spouses, and active-duty service members. With approximately 267,000 veterans living in Oregon (and over 114,000 in the Portland metro region), even a fraction of qualifying owners selling or changing status can affect a meaningful number of transactions.
The disabled veteran or surviving spouse exemption (ORS 307.250) provides a reduction to assessed value for homeowners with a service-connected disability rating of 40% or higher (or unremarried surviving spouses). For the 2025–2026 tax year, the reduction is up to $31,565 (service-connected) or $26,303 (standard), worth roughly $400–$700 in annual tax savings in Portland metro areas depending on local rates.
A separate active-duty exemption (ORS 307.286) offers a larger reduction (up to $108,366 for 2025–2026) for Oregon-domiciled service members on qualifying active duty outside the state.
Both are partial exemptions applied to the assessed value of the owner’s primary residence and tied to personal status. Eligibility generally requires a one-time application and VA certification (re-filing needed only if moving to a new property or certified by a private physician rather than the VA).
While the direct savings from these exemptions is modest ($400–$700/year for most veteran claims), the 2024 DOR guidance change treats their disqualification as triggering a full MAV reset—potentially closing decades of Measure 50 compression and leading to significantly higher taxes.
Active-duty cases (e.g., exemption ending upon return home) are less common and typically involve properties with less historical compression.
In the next section, we detail the 2024 guidance change and how it activates the reset.
The 2024 Rule Change
For decades, when a veteran or active-duty partial exemption ended, county assessors typically removed the reduction but preserved the underlying compressed MAV, allowing it to continue growing at the standard 3% rate.
This practice changed with updated guidance from the Oregon Department of Revenue, effective for disqualifications on or after January 1, 2024.
The DOR clarified that disqualification from a partial exemption triggers the constitutional requirement to recalculate MAV using the Changed Property Ratio (CPR)—the county-wide ratio of average MAV to average RMV for the property class. The new MAV becomes current RMV multiplied by the CPR (typically around 0.54 for residential properties in Portland Region counties for the 2025–2026 tax year).
This administrative enforcement of the existing constitutional language means the modest exemption savings ($400–$700/year) is no longer the only consequence. The reset can close much of the Measure 50 compression gap.
In the Portland Region data, pre-1980 homes average $5,766–$6,396 in taxes. A reset aligns absolute taxes closer to 2000+ levels ($7,685–$8,016 average), producing increases commonly in the $1,500–$4,000 annual range on typical sales, with $4,000+ possible in deeper-compression or higher-rate scenarios.
The change is statewide, though impacts vary by local appreciation and rates. Some counties have noted the potential for “significant increase” on loss of exemption.
In the next section, we examine the real-world implications for transactions and what appraisers should watch for.
Real-World Implications
The 2024 guidance change does not turn every pre-1997 home sale into a crisis, but it introduces friction that can affect negotiations, marketability, and reconciliation of comparables.
Typical tax increases fall in the $1,500–$4,000 annual range for properties in the Portland Region dataset ($600,000–$800,000 sale prices with pre-1980 build years). This translates to $125–$333 extra per month.
The Silent Car Payment
In late 2025 terms:
Average used-car payment: ~$532/month
Average new-car lease: ~$596/month
Average new-car purchase payment: ~$748/month
A $2,000–$4,000 annual increase ($167–$333/month) is less than a typical car payment but still noticeable—equivalent to a permanent, non-negotiable “utility bundle” that never goes away. For buyers already stretched in a higher-interest-rate environment, it can shift affordability and prompt renegotiation.
Outlier cases with deeper compression (often “sweet” pre-1940 homes in high-appreciation locations) can see $4,000–$8,000+ increases ($333–$667/month)—territory overlapping average used-car or new-lease payments. These are the transactions Oregon REALTORS described as producing “increases in the thousands,” sometimes requiring substantial seller concessions or risking fallout during due diligence.
The primary impact is often on marketability rather than outright deal death:
Savvy buyers (or their agents/lenders) anticipate the higher future taxes and adjust offers downward.
Sellers—particularly veterans or surviving spouses downsizing—may receive lower net proceeds (capitalizing a $3,000 increase at 6% equates to ~$50,000 less effective value).
Listings can linger if the low current taxes mask the post-closing reality.
For appraisers, this creates a new lens for outliers:
A comparable with an unexplained lower price, large concession, or extended days on market may reflect buyer reaction to a pending MAV reset.
Low-tax outliers in the grid (visible in the Taxes vs. Total SF scatter) could indicate compressed MAV or an active exemption—worth verifying via county records when material.
The change is statewide, but effects are most pronounced in areas with strong historical appreciation, like the Portland Region.
In the next section, we outline practical steps appraisers can take to identify and address this factor in reports.
What Appraisers Should Do
The 2024 guidance change introduces a marketability factor that appraisers in Oregon should consider when the subject or comparables involve pre-1997 properties, particularly those with potential veteran or active-duty exemptions.
Practical Checklist
Verify Exemption Status Review county tax records and the preliminary title report (if available) for indications of an active veteran, surviving spouse, or active-duty partial exemption. Many counties list it on the property tax statement or online portal.
Estimate Post-Transfer Tax Liability If an exemption is present and likely to disqualify on transfer (e.g., sale to non-qualifying buyer), note the potential increase. Use county assessor tools or CPR data to project the reset MAV (current RMV × CPR) and resulting taxes. Typical jumps in the Portland Region fall in the $1,500–$4,000 annual range, with higher amounts possible in deep-compression cases. Note that tax rates vary by code area.
Comment on Marketability When Material Include commentary if the differential is significant: “The subject property currently benefits from a veteran partial exemption expected to end upon transfer, potentially increasing annual taxes by an estimated $X. This may affect buyer affordability and market reaction.”
Reconcile Outliers with This Lens Low-tax outliers in the sales grid (visible in Taxes vs. Total SF analysis) may reflect compressed MAV or an active exemption—a “decaying asset” under the new guidance. Check effective tax rate (annual taxes ÷ sale price): ~0.6–0.8% may indicate compression; consider post-reset alignment (~1.1–1.3%) in reconciliation. Using a compressed comparable without adjustment risks overvaluing the subject’s marketability, as savvy buyers increasingly factor in the reset.
Use Dual Scenarios if Appropriate For subjects with active exemptions, provide current and projected post-reset tax estimates in the addendum or comments to inform the intended user.
Resources:
County assessor websites (tax statements often flag exemptions)
DOR Veteran Exemptions page
MAV Manual for general mechanics
As resets propagate into closed sales (expected more visibly in 2026 onward), this factor may explain otherwise puzzling comparables. Early identification helps ensure accurate valuation and informed clients.
In the closing section, we look at the broader outlook.
Closing Thoughts
The 2024 DOR guidance change is an administrative enforcement of a long-standing constitutional provision, but its impact is only now becoming visible as disqualifications occur and 2025–2026 tax statements arrive. Larger effects are expected in the 2026–2027 cycle as more veteran-owned properties sell or change status.
The 2025 Oregon Legislative Session saw bills (e.g., HB 2361/SB 387 aiming to lower the disability threshold, HB 3287 to increase exemption amounts) intended to expand veteran benefits. While these efforts highlight recognition of the issue, none addressed the MAV reset trigger itself. The constitutional requirement remains unless amended or re-interpreted.
For appraisers working in the Portland Region and similar appreciation-driven markets, this issue adds one more layer to marketability analysis. Low-tax outliers in older properties represent a benefit that can evaporate on transfer—reliable today, but potentially “decaying” tomorrow.
Awareness helps everyone involved: appraisers reconcile comparables more accurately, agents counsel clients proactively, and buyers/sellers avoid surprises.
If you encounter real-world examples (anonymized comps with concessions due to reset concerns, or listings noting the risk), please share them for future updates. Documenting patterns strengthens our collective understanding.
Thank you for reading this Appraisal Deep Dive. Stay informed and precise in your work.
Quick Reference Cheat Sheet
Reset Formula
Real Market Value (RMV) × Changed Property Ratio (CPR)
Typical CPR (2025–2026, Portland Region residential)
~0.54 (updated annually each October)
Reset Trigger
Disqualification from veteran/active-duty exemption
Thanks for reading—I hope you found a useful insight or an unexpected nugget along the way. If you enjoyed the post, please consider subscribing for future updates.
Coda
Are you an agent in Portland who wonders why appraisers always do “x”?
A homeowner with questions about appraiser methodology?
If so, feel free to reach out—I enjoy connecting with market participants across Portland and the surrounding counties, and am always happy to help where I can.
And if you’re in need of appraisal services in Portland or anywhere in the Portland Region, we’d be glad to assist.
About the Author — Abdur Abdul‑Malik, SRA, ASA
Abdur Abdul‑Malik is the founder, author, and publisher of the Portland Appraisal Blog, where he produces original regional and neighborhood‑level housing analytics for the Portland Region. He is a certified residential appraiser serving Oregon and Washington, drawing on RMLS transaction data, public records, and custom segmentation models he has built.
He developed the Portland Appraisal Blog Affordability Index (PABAI), a payment‑based affordability metric built from actual RMLS sales. PABAI incorporates weekly updates based on the prevailing 30‑year fixed mortgage rate, providing a locally grounded measure of housing affordability across the region.
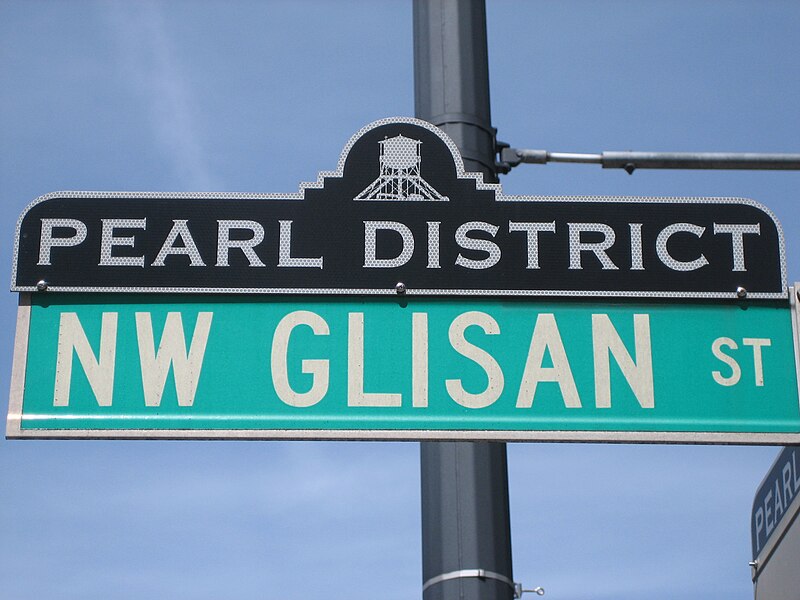
The Pearl District is one of Portland’s urban core neighborhoods. Bordering the Willamette River, the neighborhood used to be dominated by warehouses and railroad yards but is now home to a variety of businesses, art galleries, and housing. The City of Portland offers the following description:
The Pearl is a young neighborhood, its most recent incarnation established in the early 1990s. Its modern persona is heavily influenced by the tenets of New Urbanism, which prizes mixed-use, walkability, diversity, human scale and conservation.
The purchasable housing stock type in the Pearl District can be described in one word: condominiums. Except for one small townhome development, the neighborhood has no other housing type. (All other housing is lease-only in apartment buildings.) So, how has the Pearl District condo market performed over the last 10 years? Let’s crunch some numbers and dig into the stats.
Note: We will only be examining the open market, defined as condo units advertised on RMLS. Off-market private sales will not be included in the following analysis.
PEARL DISTRICT SUMMARY STATISTICS
Taking the 35,000-foot view, we can see the average yearly prices have been steadily declining since 2016:
Average prices this year are essentially the same as they were in 2015. (Ouch.) The main reason for this decline is due to a couple of large high-rise condominium buildings being completed in 2016 and 2018. (We’ll talk more them later in this post.) For now, suffice to say, the completion of those projects has created a glut of units the market is still trying to digest. That combined with high mortgage interest rates and low volume has depressed average sales prices.
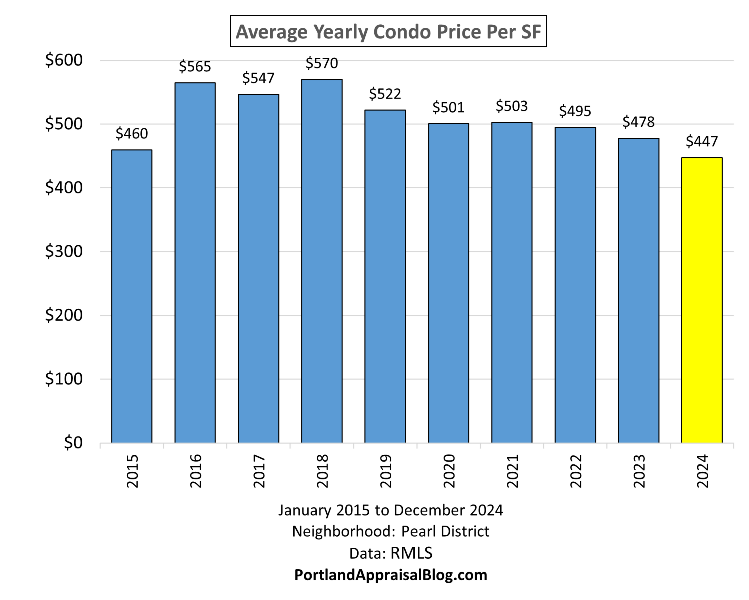
Here is that same info expressed in an average yearly price per square foot:
The contrast between 2015 and 2024 is a bit more pronounced when viewed from a price-per-square-foot vantage point.
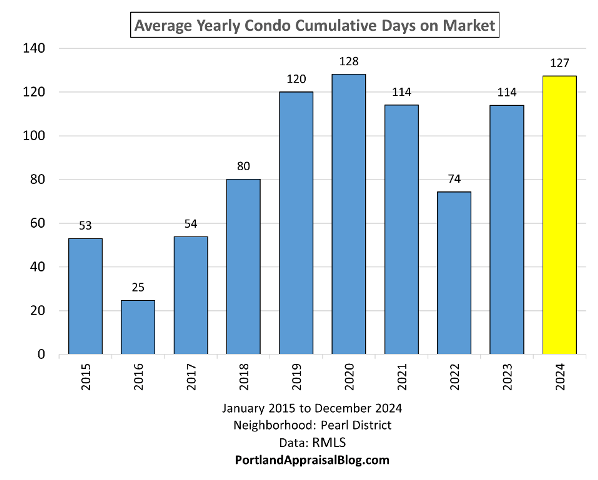
Unsurprisingly, condo units have been steadily spending more time on the market before finding a buyer:
Units have been averaging 3-4 months on the open market before finally selling.
Volume has been trending downwards as the market struggles with the current high interest rate environment:
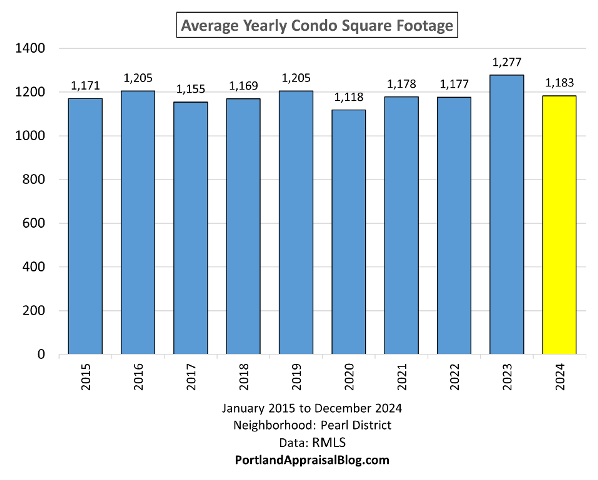
Finally, a look at the average size of the units each year shows no major swings and a general conformity in square footage:
2024 HASN’T BEEN A GREAT YEAR FOR THE PEARL DISTRICT
Using line graphs we can parse the data on a monthly basis for the last four years to see how 2024 compares to the previous three years. Let’s start with the average monthly sales price:
It should be noted the month of December 2024 is dashed as the month is not yet complete as of the post date and trends may slightly change depending on the remaining data. The year 2024 has generally underperformed the prior years. Interestingly, the months of May & June of the year 2022 were the lowest. This was right when the Federal Reserve began spiking the interest rates, with immediate effect on the market.
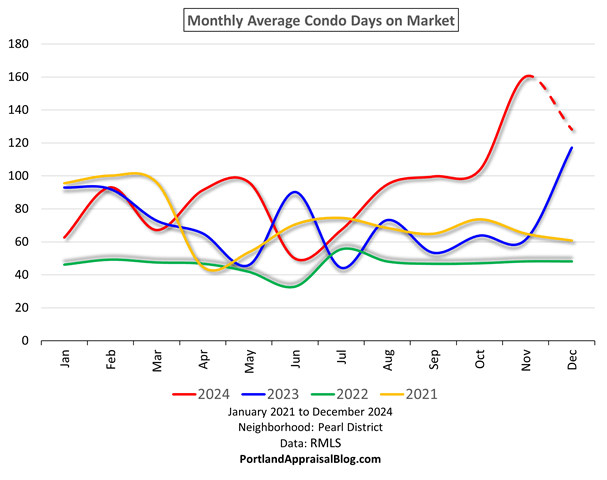
The following shows the monthly days on market:
2024 has pulled away from the previous years and units are having a much harder time selling.
The following shows the sales price to the original list price ratio:
A ratio above 100% is good for sellers, as it typically indicates a “hot” market with competitive bidding. 2024 has seen a sharp drop off since late summer.
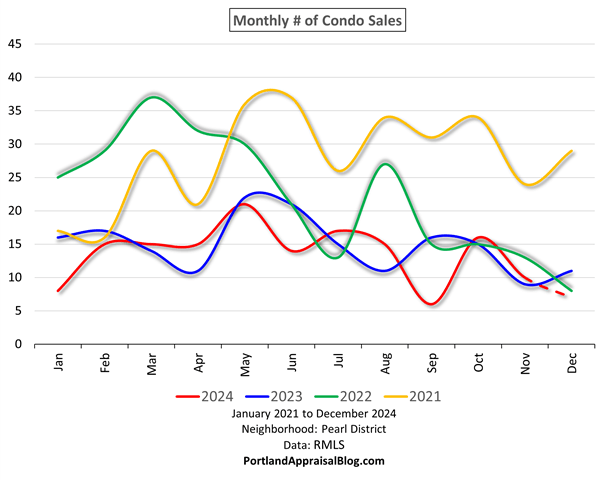
Finally a look at volume:
It’s been neck and neck between 2023 and 2024, but it looks like 2024 will close the year with the lowest monthly winter volume over the last four years.
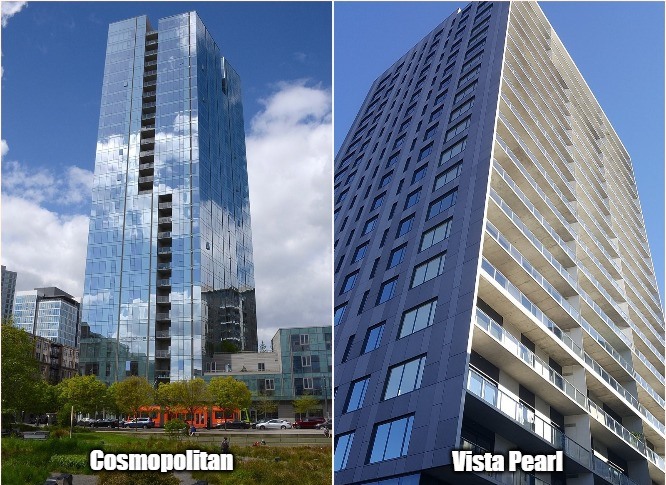
The Cosmopolitan is the largest residential tower in the City of Portland. The building is 28 stories, has 343,560 sq. ft. of space, and 150 condo units. It greatly enhances Portland’s skyline. The tower was completed in 2016.
Vista Pearl is also an impressive building, with 21 stories above ground and 153 condo units. Vista was completed in 2018 and is STILL selling units that have never been occupied. (One unoccupied unit sold in early 2024.)
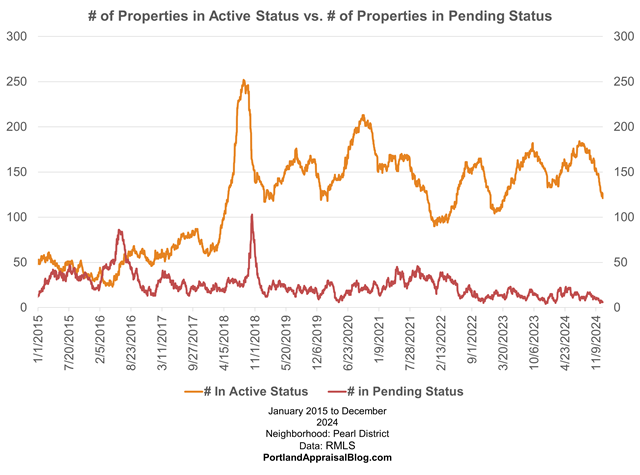
The following graph shows the number of condo units in active status versus the number of units in pending status (under contract) for the entire Pearl District for the last ten years:
When the number of pendings exceed the number of active listings that generally indicates a hot market where demand outstrips supply. The market did a fairly good job absorbing the units from the Cosmopolitan. However, when Vista Pearl came online, the market became glutted. The graph shows a sharp spike in active listings in 2018 when that tower was completed and the inventory levels have remained high ever since.
The two structures compete well against one another. Here is a graph of sales prices from the Cosmopolitan and Vista Pearl:
The flurry of initial sales for each building can be seen on their respective completion dates (2016 & 2018). The general range of initial sales prices were similar. The subsequent years show an intermixture of dots, indicating no clear dominance of one tower over the other. The edge does go to the Cosmopolitan in the rarified heights of luxury condo units. And the air gets quite thin above $3 million, with most of the sales in that range belonging to the Cosmopolitan.
The highest sale in the Cosmopolitan was a 4,472- sq. ft. penthouse unit on the 27th floor. It was originally designed as two condo units, but before the tower was completed the two units were consolidated, creating the largest unit in the complex, with panoramic views. The 27th floor penthouse initially sold for $5,441,294 in 2016 as a new construction. The unit later sold for $6,995,000 in 2019—which is a record on the open market for the last ten years in the Pearl District (the seller never dropped the price and waited 244 days to find a buyer). As of this post date, the unit is back on the market for a more “modest” asking price of $4,500,000. If the penthouse closes at that price, it will represent a 36% drop in value from the previous sale. Photos of the unit are currently available online.
A QUICK LOOK AT THE LUXURY CONDO MARKET IN THE PEARL DISTRICT
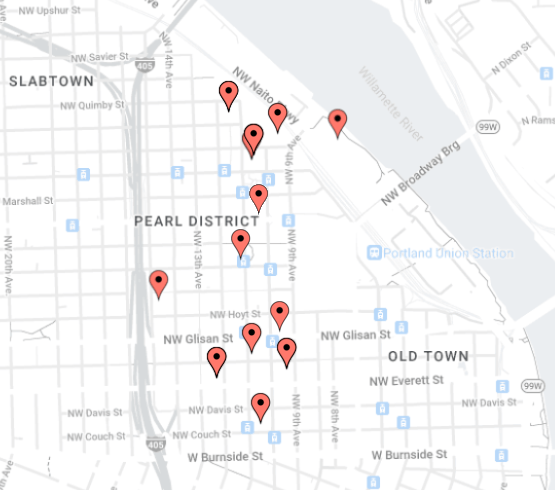
Let’s wrap up our survey of Pearl District condos by examining the luxury market. Here, we define the luxury market as condominiums that sold at or above $2 million. The following map shows where those sales occured:
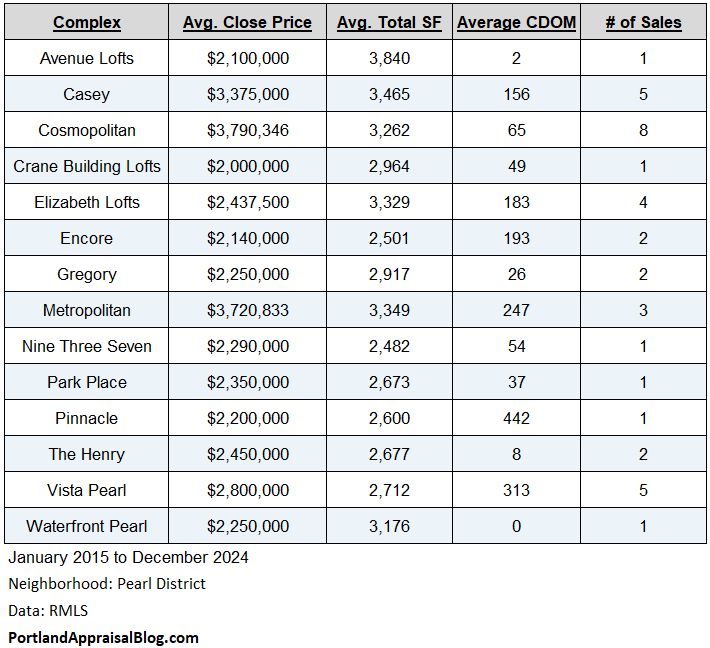
The following table summarizes info about the sales:
Unsurprisingly, the Cosmopolitan is the clear winner, however, the Casey and Metropolitan complexes are close behind in average sales prices, with the Vista Pearl complex claiming 4th place in the luxury condo market.
Thank you for reading the post! I hope you found some useful or interesting nugget of information. Please consider subscribing.
Question: When do you think the Pearl District will finally absorb all the excess inventory?
Coda
Are you an agent in Portland who wonders why appraisers always do “x”?
A homeowner with questions about appraiser methodology?
If so, feel free to reach out—I enjoy connecting with market participants across Portland and the surrounding counties, and am always happy to help where I can.
And if you’re in need of appraisal services in Portland or anywhere in the Portland Region, we’d be glad to assist.
About the Author — Abdur Abdul‑Malik, SRA, ASA
Abdur Abdul‑Malik is the founder, author, and publisher of the Portland Appraisal Blog, where he produces original regional and neighborhood‑level housing analytics for the Portland Region. He is a certified residential appraiser serving Oregon and Washington, drawing on RMLS transaction data, public records, and custom segmentation models he has built.
He developed the Portland Appraisal Blog Affordability Index (PABAI), a payment‑based affordability metric built from actual RMLS sales. PABAI incorporates weekly updates based on the prevailing 30‑year fixed mortgage rate, providing a locally grounded measure of housing affordability across the region.















.jpg)
