

The final full week of 2025 sharpened focus on the deep affordability barriers defining the Portland Region’s housing market, while also spotlighting regulatory and tax issues with real consequences for homeowners—especially veterans. A closer look at the 2024 MAV Reset Clarification revealed how the loss of a disabled veteran exemption can trigger a permanent upward reset in maximum assessed value, locking in higher property taxes even if the exemption is later restored. Meanwhile, groundbreaking on a major apartment project pushed forward despite tight financing, and fresh Q3 data underscored why most first-time buyers must now wait until age 40 to enter the detached single-family market.
That Q3 analysis, powered by the new Portland Appraisal Blog Affordability Index (PABAI), showed that fewer than 10% of recent detached sales were realistically within reach for households aged 25–44 once full PITI costs are considered. A separate deep dive into today’s typical $600,000 home purchase laid out the household income actually required—far above median levels for younger buyers. Together, these pieces highlight a region where entry-level detached ownership remains elusive without substantial down-payment help, outlier earnings, or delayed timelines.
At the same time, multifamily development continues as one of the brighter spots, with projects like the Barbur Apartments aiming to deliver more rental options amid high construction costs and steep financing hurdles. These efforts reflect broader attempts to ease the overall supply crunch, even as single-family affordability stays structurally constrained.
Table of Contents
- Sunday, December 21: Barbur Apartments Groundbreaking Highlights Plottage Value
- Tuesday, December 23: The Measure 50 Compression Trap and the 2024 MAV Reset Clarification
- Thursday, December 25: Portland’s Starter Home Market (Q3 2025) — What $469k Really Buys
- Saturday, December 27: Portland’s First-Time Buyers Have No Choice But to Wait Until 40 — Q3 2025 Data Explains Why
Sunday, December 21: Barbur Apartments Groundbreaking Highlights Plottage Value

Photo: Portland Appraisal Blog
Groundbreaking commenced in mid-December 2025 on the Barbur Apartments, a 150-unit affordable family housing project located at the corner of SW Barbur Blvd and SW Capitol Hill Rd in Portland’s Hillsdale/Multnomah Village area. Developed by Innovative Housing, Inc., the complex will feature one three-story building and two four-story buildings, delivering 149 income-restricted units (one reserved for an onsite manager) with many larger two- to four-bedroom layouts targeted at immigrant and refugee families. Amenities include a courtyard and community spaces, with completion expected in Fall 2027.
The project carries an estimated total development cost of approximately $79.4 million, supported by about $27.3 million from the Portland Housing Bureau alongside regional Metro Housing Bond funds, federal sources, and Portland Clean Energy Community Benefits Fund contributions for energy efficiency. It emphasizes transit access along the Barbur corridor, with approved plans providing roughly 45 on-site parking spaces—a ratio of about 0.3 spaces per unit reflecting the transit-oriented design.
From an appraisal perspective, the redevelopment exemplifies plottage, the incremental value gained by assembling contiguous parcels into a larger, more developable site. Four tax lots totaling around 2.19 acres were purchased together in February 2025 for just under $6 million. Individually constrained by size, zoning, and existing improvements, the parcels supported only lower-intensity uses.
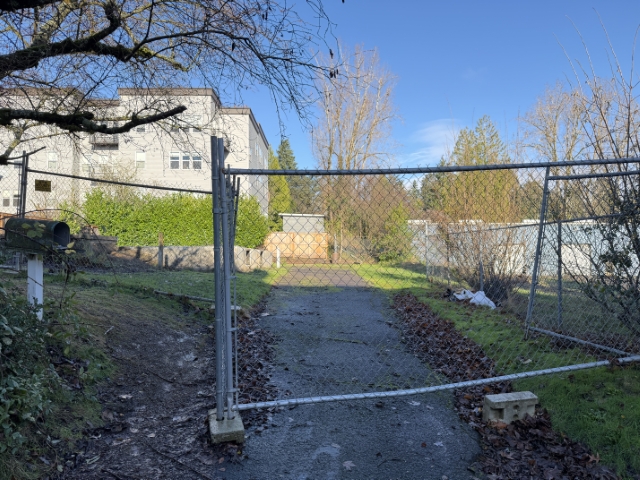
One parcel formerly held a 1927-built single-family home of approximately 2,336 square feet that was never listed on the open market and quickly demolished, demonstrating clear functional obsolescence as the corridor evolves. An adjacent former commercial strip—Barbur Blvd Rentals—remains standing but fenced within the construction zone. Together, these lots enable a density and scale unattainable separately, illustrating classic plottage and a shift to higher-density residential as the highest and best use.
Directly across Barbur Blvd sits a large Safeway complex with extensive covered and surface parking, a significant amenity for future residents. However, with the project’s limited on-site parking space and family-oriented unit mix, residents and guests may increasingly rely on this private lot for overflow. A mid-morning site visit revealed a nearly full garage, suggesting potential increased daytime use once occupied—a dynamic worth monitoring.
Local market data from 2024–2025 closed sales in Hillsdale and Multnomah Village underscores limited affordability. Detached homes led with 351 sales averaging $750,000 and 50 days on market. Condominiums, the most accessible ownership segment by volume, averaged $445,000 across 78 sales with longer 68-day absorption. Attached homes, a small segment of just 13 transactions, averaged $581,000—likely due to more recent construction (average year built 2010) and associated premiums. Overall averages reached $691,000, highlighting ownership barriers and the critical role of regulated rentals like Barbur Apartments for lower-income and larger households.
This assemblage aligns with broader city efforts to expand housing through density and public investment, including recent regulatory reforms aimed at reviving Portland development.
Tuesday, December 23: The Measure 50 Compression Trap and the 2024 MAV Reset Clarification
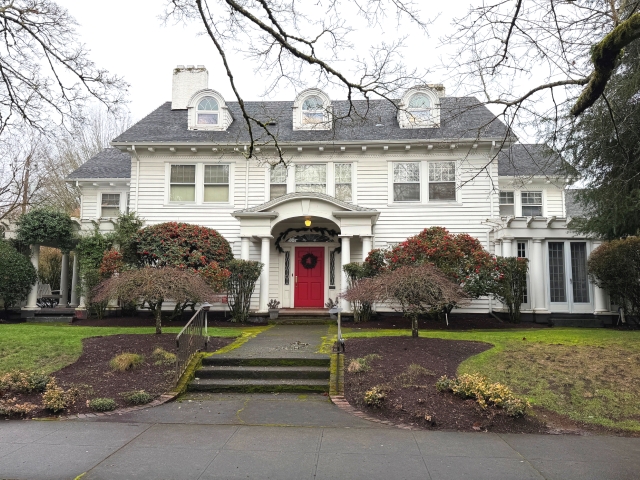
Photo: Abdur Abdul-Malik, Portland Appraisal Blog
In Oregon’s property tax system, established by Measure 50 in 1997, a common pitfall has emerged for buyers of older homes: unexpectedly high tax bills following the loss of certain partial exemptions. This occurs when a veteran or active-duty partial exemption ends—often upon sale or the owner’s passing without a qualifying successor—triggering a reset of the property’s Maximum Assessed Value (MAV) closer to current market reality. Previously, counties preserved the low MAV after removing the exemption, but updated 2024 guidance from the Oregon Department of Revenue now enforces a constitutional recalculation, potentially adding $2,000–$6,000 annually to taxes for pre-1997 properties with deep compression.
Measure 50 created two key values: Real Market Value (RMV), reflecting current market conditions, and MAV, initially set below 1995–1997 RMV and capped at 3% annual growth thereafter (with exceptions). The Assessed Value (AV) is the lesser of the two, leading to substantial compression in high-appreciation areas like Portland, where older homes often have MAV far below RMV. When a partial exemption disqualifies, the new guidance applies the Changed Property Ratio (CPR)—around 0.54 for residential properties in Portland Region counties for 2025–2026—to reset MAV to current RMV multiplied by CPR, aligning taxes more closely with newer homes.
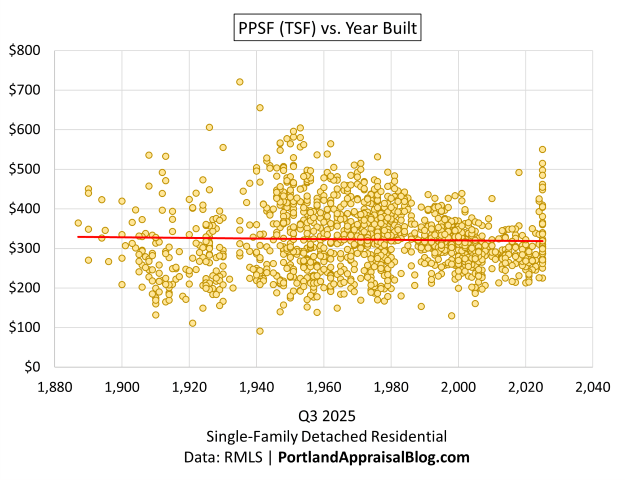
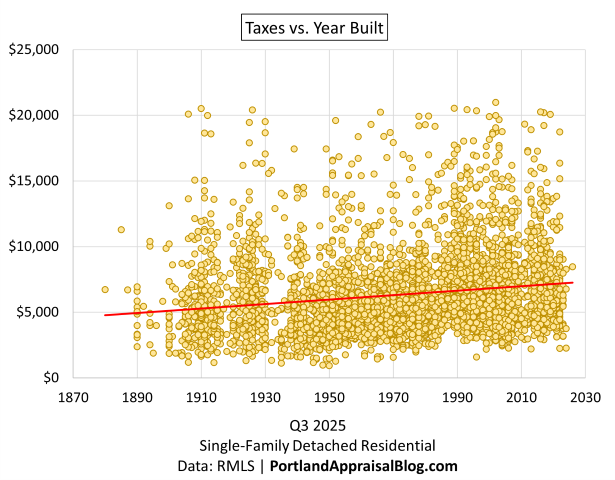
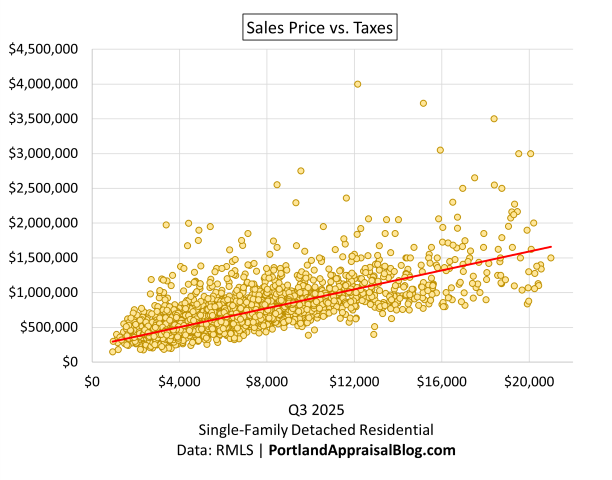
Q3 2025 sales data for detached single-family residences in the Portland Region highlights this compression. Pre-1940 homes averaged $671,295 in sale price but only $6,396 in annual taxes, while 1940–1959 properties averaged $607,466 with $5,766 in taxes. In contrast, 2000–2019 homes averaged $761,061 with $7,685 in taxes. Effective tax burdens remained consistent at ~$9–$10 per $1,000 of sale price across eras, showing the market prices properties assuming similar overall loads. However, absolute taxes rise with newer construction due to less historical compression, and pre-1940 homes often command premiums despite lower taxes—creating vulnerability when resets occur.
The veteran (ORS 307.250) and active-duty (ORS 307.286) exemptions provide modest reductions—up to $31,565 or $108,366 for 2025–2026, worth $400–$700 annually in savings—but their disqualification now triggers the full MAV reset. With over 114,000 veterans in the metro area, affected transactions can see increases of $1,500–$4,000 yearly in typical cases, or $4,000+ in deeper-compression scenarios. This translates to $125–$333 monthly, comparable to a car payment, potentially straining affordability and prompting renegotiations.
For market participants, the reset introduces friction: buyers may demand concessions, sellers (including veterans or surviving spouses) face lower net proceeds, and properties can linger on the market if low current taxes mask future costs. Outliers with unusually low taxes may reflect active exemptions or compression soon to erode.
Appraisers should verify exemption status via county records, estimate post-reset taxes, and comment on marketability when material. Low-tax comparables warrant scrutiny—effective rates of 0.6–0.8% may signal compression, better aligned post-reset at 1.1–1.3%. Providing dual tax scenarios aids informed valuation. As resets appear in more closed sales from 2026 onward, this factor will increasingly explain pricing anomalies in Oregon’s older housing stock.
Thursday, December 25: Portland’s Starter Home Market (Q3 2025) — What $469k Really Buys

Via Canva Pro
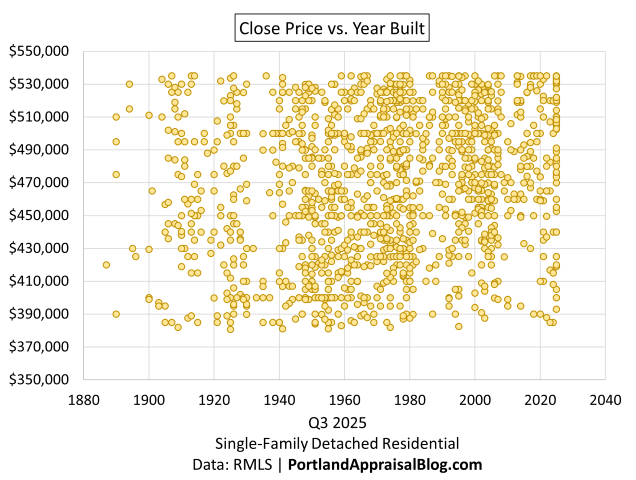
In another Appraisal Deep Dive, we examine Portland’s starter-home market using Q3 2025 RMLS data for detached single-family residences in the 5th–35th percentile by price—the same convention Redfin used in its October report highlighting Portland’s strong starter activity.
Redfin’s reported median of approximately $420,000 includes all property types, but focusing solely on detached homes—a popular choice across the metro, including for urban buyers seeking yard space and privacy—yields an average close price of $469,000. Local buyers want to know how much home this budget actually buys, and the data reveals a market overwhelmingly dominated by mid-century inventory, with stark county differences and only a modest presence of brand-new construction.
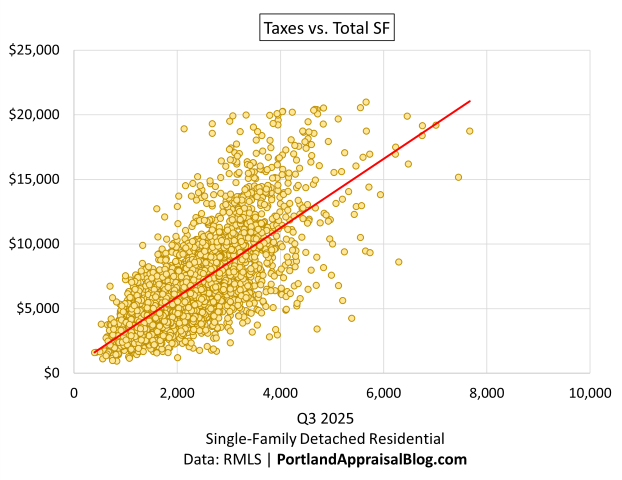
Across the core counties, Multnomah drives nearly half the volume with the oldest average build year (1951), while Washington posts the highest prices and hosts the most new homes. Outer counties like Columbia and Yamhill offer newer builds on larger parcels but far fewer sales. Square footage emerges as one of the stronger (though still modest) drivers of price, with most sales clustering between 1,200 and 2,000 square feet. Lot size patterns show a clear historical shift: post-war boom homes (1940s–1950s) typically enjoy generous parcels, while newer construction relies on much smaller lots—often the result of infill and divisions.
New homes account for just 4.2% of starter-tier sales (versus 9.1% market-wide), yet their presence remains noteworthy in a high-cost building environment. They sell for only about 3% more than existing homes despite brand-new condition but deliver less interior space and roughly half the land. For buyers, this creates a clear trade-off: modern efficiency and low maintenance on a very small lot (often minimal usable yard, especially in Multnomah and Washington) versus an older mid-century home with significantly more outdoor space, albeit with potential challenges in systems and layout—a choice particularly relevant for growing families prioritizing play areas or privacy.
Appraisal insights reveal that chronological age correlates weakly with both sales price and price per square foot. Effective age, condition, and site utility drive value far more, with lot size advantages in older homes often offsetting credits for new condition. When appraising the limited new-construction sales (down ~25% YoY overall, 48% in Multnomah), appraisers typically rely on other recent builds and adjust heavily for quality of upgrades and site characteristics.
Overall, Portland’s starter segment continues heavy reliance on mid-century stock on larger lots—a pattern unlikely to change dramatically in 2026 without major supply shifts, though the City of Portland is attempting to incentivize new projects via SDC waivers. The modest new-construction foothold demonstrates builder adaptation, but at the clear cost of site size and outdoor space.
Saturday, December 27: Portland’s First-Time Buyers Have No Choice But to Wait Until 40 — Q3 2025 Data Explains Why
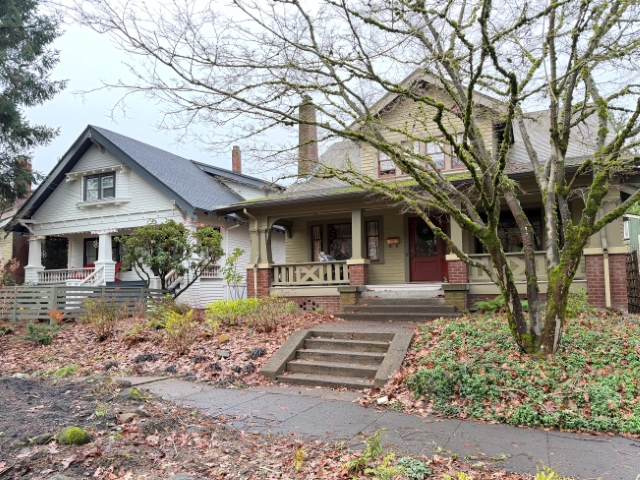
Photo: Abdur Abdul-Malik, Portland Appraisal Blog
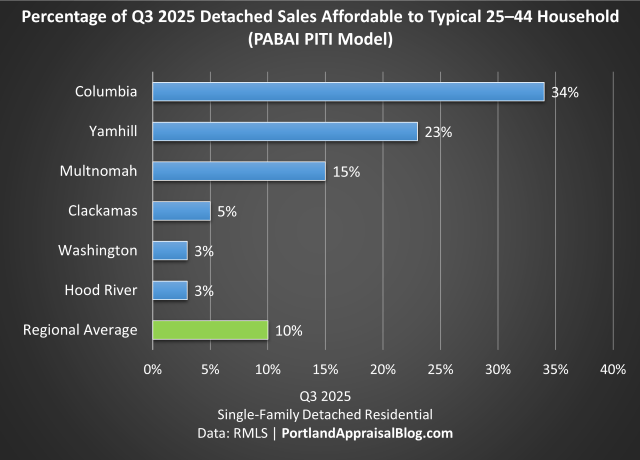
Recent Q3 2025 data reveals that only about 10% of detached single-family homes in the Portland Region were affordable to typical households aged 25–44 under realistic payment assumptions, highlighting why first-time buyers are increasingly delayed until reaching age 40. Nationally, the median age of first-time buyers has hit a record 40, with their share of purchases at a historic low, driven by persistent affordability barriers.
Traditional measures, such as the National Association of Realtors’ Housing Affordability Index—which considers only principal and interest with a 25% qualifying ratio—suggest that roughly 28% of Q3 2025 detached sales in the six-county Portland Region were affordable to a household at the area median income of $124,100. However, incorporating actual property taxes and a conservative homeowners insurance estimate into the full PITI payment drops this to 20% for the same benchmark.
This analysis introduces the new Portland Appraisal Blog Affordability Index (PABAI)—a more accurate, PITI-based metric tailored to the Portland Region’s market. The PABAI expresses affordability as an index value (100 indicating exact qualification for the typical home) and derives the percentage of sales affordable to reference households. For the regional benchmark using HUD’s $124,100 area median income, the PABAI stood at approximately 78. For younger 25–44 households with a median income of about $110,000, it fell to 69—meaning only 9.8% of Q3 detached sales (460 out of 4,682) were within reach. The typical $600,000 detached home required roughly $159,000 in household income—45% above this cohort’s median.
County-level variation underscores geographic disparities for 25–44 buyers. Outer areas like Columbia County (34% affordable) and Yamhill County (23%) provided the most options, though often at the cost of longer commutes to urban centers. Multnomah County outperformed at 15%, benefiting from denser, older stock, while suburban Washington (3%) and Clackamas (5%) counties lagged due to larger lots and higher-priced inventory. Hood River registered just 3%.
In Q3 2025, younger buyers seeking detached homes typically needed substantial family assistance, extreme lifestyle sacrifices for larger down payments, or outlier incomes well above cohort medians to gain entry. Without these, most were effectively priced out until accumulating higher earnings in their late 30s or early 40s—or forced into alternatives like condominiums.
The PABAI models affordability with a 20% down payment, 28% front-end ratio, actual rates, listing taxes, and a 0.40% insurance rate, offering granular insights beyond national indices that overlook taxes and insurance. This realistic approach confirms the structural challenges pushing first-time buyer ages upward in the Portland Region.
Week’s Blog Posts & Further Reading Links
- Sunday’s Brief (12/21): Barbur Apartments Groundbreaking Highlights Plottage Value
- Tuesday’s Deep Dive (12/23): The Measure 50 Compression Trap and the 2024 MAV Reset Clarification
- Thursday’s Deep Dive (12/25): Portland’s Starter Home Market (Q3 2025) — What $469k Really Buys
- Saturday’s Deep Dive (12/27): Portland’s First-Time Buyers Have No Choice But to Wait Until 40 — Q3 2025 Data Explains Why
Closing Remarks
Taken together, this week’s coverage paints a picture of a Portland metro market where structural barriers—high prices, elevated property taxes, and insurance costs—continue to sideline younger households from detached homeownership. The introduction of the Portland Appraisal Blog Affordability Index offers a clearer, more localized tool for understanding these gaps, showing that realistic PITI-based qualifying leaves fewer than 10% of recent sales within reach for 25–44-year-olds.
Regulatory and measurement topics add another layer of complexity for industry professionals. Clarifications around the 2024 MAV Reset and the accompanying tax implications serve as reminders that appraisal assignments increasingly demand careful awareness of tax policy and its effects on value and marketability.
The common thread remains one of constrained supply at affordable price points, driving both multifamily investment and prolonged timelines for single-family entry. These dynamics suggest the region will continue favoring those with established equity or higher earnings, while first-time buyers face extended waits or alternative paths like condominiums.

Thanks for reading—I hope you found a useful insight or an unexpected nugget along the way. If you enjoyed the post, please consider subscribing for future updates.
Question: With first-time buyers now commonly having to wait until 40 to purchase a detached home in the Portland Region, what trade-offs are younger households making today to eventually break into ownership?
CODA
Are you an agent in Portland who wonders why appraisers always do “x”?
A homeowner with questions about appraiser methodology?
If so, feel free to reach out—I enjoy connecting with market participants across Portland and the surrounding counties, and am always happy to help where I can.
And if you’re in need of appraisal services in Portland or anywhere in the Portland Region, we’d be glad to assist.


