
About This Snapshot
This snapshot summarizes residential sales occurring within the official City of Hood River limits during calendar year 2025, with selected comparisons to calendar year 2024. Included property types are detached homes, attached homes, condominiums, and manufactured homes on owned land. Data are sourced from RMLS and have undergone a rigorous cleaning and validation process. Manufactured homes located in leased-space parks are not included. For additional information regarding data cleaning procedures and common MLS data challenges, see the dedicated page: RMLS Data Accuracy Challenges.
Tables in this snapshot include commonly used housing market metrics such as:
- Sales price to original list price: SP/OLP
- Price per square foot (total square footage): PPSF (TSF)
- Cumulative days on market: CDOM
- Average lot size in acres: ac
- Number and % of affordable sales
How Affordability Is Defined
The Portland Appraisal Blog Affordability Index (PABAI) was used to evaluate affordability during the study period. PABAI calculates the income needed to purchase each home using its actual reported sale price, property taxes, HOA dues, and an insurance estimate, financed using the Freddie Mac 30-year mortgage rate in effect at the time of sale.
A home is considered affordable when the required income does not exceed the U.S. Department of Housing and Urban Development (HUD) Median Family Income for the Portland–Vancouver–Hillsboro Metropolitan Statistical Area (MSA) in effect at the time of sale.
Note: The Portland–Vancouver–Hillsboro MSA is used throughout the six-county Portland Region to maintain consistency across all market snapshots.
Market Overview
Hood River is the county seat and largest urban center in Hood River County, located approximately 60 miles east of Portland at the confluence of the Hood and Columbia Rivers. With a population of roughly 8,500 residents, the city serves as the commercial, governmental, and cultural hub for much of the Columbia Gorge east of Multnomah County.
The city’s economy has historically been tied to agriculture, particularly the fruit-growing industry that remains a defining part of the surrounding Hood River Valley. Today, healthcare, professional services, manufacturing, tourism, and recreation also play important roles. Hood River’s location near Mount Hood and along the Columbia River has helped establish the community as a nationally recognized destination for windsurfing, kiteboarding, cycling, skiing, hiking, and other outdoor activities.
Unlike many growing communities in the Portland metropolitan area, Hood River occupies a relatively compact footprint within the Columbia River Gorge. Geographic constraints, surrounding agricultural lands, and Gorge-related land-use policies have helped shape the city’s development patterns, creating a housing market that differs substantially from many suburban communities elsewhere in the region.
Study Area Boundaries
The following map identifies the market area analyzed in this report. The dataset includes residential sales occurring within Hood River city limits during 2025 and excludes properties located outside the city boundary, including areas within the urban growth boundary that have not been formally annexed into the city.
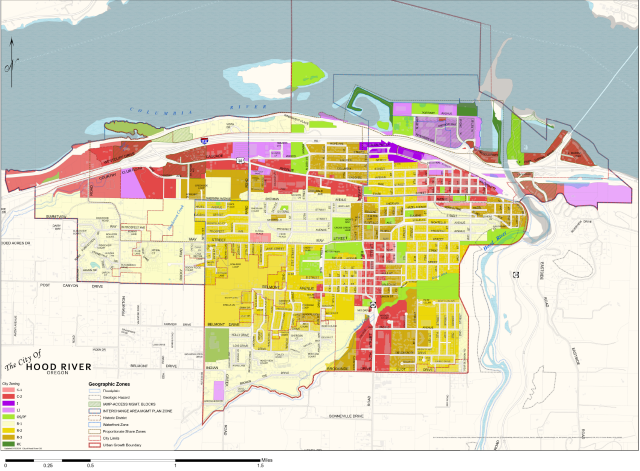
The map shown is the City of Hood River’s May 2024 zoning map, the most recent version available at the time of publication.
Citywide Residential Market Snapshot
The following table summarizes residential sales occurring within Hood River city limits during calendar year 2025. Included property types are detached homes, attached homes, condominiums, and manufactured homes on owned land. Together, these four segments provide a high-level overview of Hood River’s residential market.
| Category | Detached | Attached | Condo | Manuf. |
|---|---|---|---|---|
| Total Dollar Volume | $53,259,670 | $8,039,000 | $2,953,000 | $0 |
| Average Price | $845,392 | $803,900 | $492,167 | — |
| Average PPSF (Total SF) | $439.86 | $418.67 | $530.62 | — |
| Average Total SF | 1,945 | 1,940 | 948 | — |
| Average Lot Size (ac) | 0.46 | 0.06 | 0.00 | — |
| Average Age (Yrs) | 44.59 | 15.60 | 26.67 | — |
| Average CDOM | 59.06 | 107.60 | 114.50 | — |
| Total # of Sales | 63 | 10 | 6 | 0 |
| % of Market | 79.75% | 12.66% | 7.59% | 0.00% |
| Highest Sale | $3,600,000 | $1,500,000 | $700,000 | — |
| Lowest Sale | $480,000 | $500,000 | $350,000 | — |
| # Affordable | 1 | 1 | 3 | — |
| % Affordable | 1.59% | 10.00% | 50.00% | — |
January 2025 – December 2025 (79 total residential sales).
Data: RMLS | PortlandAppraisalBlog.com
Detached homes overwhelmingly defined Hood River’s residential ownership market during 2025, accounting for nearly 80% of all sales and more than 82% of residential dollar volume. Buyers seeking alternatives had relatively few opportunities.
Despite their smaller share of market activity, attached homes occupied an unusual position within the market. Average living area was nearly identical to detached homes, while average pricing was only modestly lower. Rather than functioning as a major affordability tier, attached homes operated as an alternative ownership format with smaller sites but similar qualification requirements.
Condominiums provided the clearest entry point into homeownership. Although condos represented fewer than 8% of all residential sales, they accounted for 3 of the city’s 5 affordable transactions during 2025. At the same time, the limited number of condominium sales highlights another challenge facing buyers: availability. The segment generated only 6 sales during the entire year.
Affordability opportunities remained scarce across all housing types. Only 5 of 79 residential sales met affordability standards, reinforcing the high cost of ownership within Hood River city limits.
Detached Homes
Detached homes represent the largest and most active residential housing segment in Hood River. Because detached properties accounted for nearly 8 out of 10 sales during 2025, this segment provides the clearest view of local market conditions.
Detached Homes Market Statistics
The following table compares detached-home sales activity occurring within Hood River city limits during 2024 and 2025. Metrics include the number of sales, total dollar volume, pricing, property characteristics, marketing times, and affordability.
| Category | 2024 | 2025 | Change |
|---|---|---|---|
| Total $ Volume | $42,857,350 | $53,259,670 | +24.27% |
| Average Price | $751,883 | $845,392 | +12.44% |
| Median Price | $715,000 | $725,000 | +1.40% |
| Avg SP/OLP | 97.0926% | 96.6868% | -0.4058 pts |
| Avg PPSF (TSF) | $417.34 | $439.86 | +5.40% |
| # in HOA | 12 | 9 | -3 homes |
| Avg HOA Dues | $38.71 | $34.35 | -11.27% |
| Avg Total SF | 1,889 | 1,945 | +2.96% |
| Avg Lot Size (ac) | 0.17 | 0.46 | +167.37% |
| Avg Age (Yrs) | 40.25 | 44.59 | +4.34 years |
| Avg CDOM | 51.05 | 59.06 | +8.01 days |
| Total # of Sales | 57 | 63 | +6 homes |
| # of New Constr. | 0 | 1 | +1 home |
| # Affordable | 1 | 1 | No Change |
| % Affordable | 1.75% | 1.59% | -0.17 pts |
| Min Req Income | $73,846 | $114,991 | +55.72% |
| Avg Req Income | $193,700 | $214,200 | +10.58% |
City of Hood River
Single-Family Detached Residential | 2024 & 2025
Data: RMLS | PortlandAppraisalBlog.com
Detached-home activity increased during 2025, with sales rising from 57 to 63 transactions and dollar volume exceeding $53 million. At first glance, the market also appears substantially more expensive, with average sale prices increasing more than 12% and average lot sizes increasing more than 167%. A closer review of the homes that sold reveals that part of this increase was driven by changes in the composition of sales rather than broad-based movement across the entire market.
Two unusually large properties materially influenced the year’s averages. The first was the 6.34-acre Stonehedge Gardens property, a historic farmhouse and former event venue that sold for $2.2 million. The second was a 10.67-acre westside property marketed primarily as a development opportunity, which sold for $950,000 after accumulating 1,185 cumulative days on market. Together, these two properties contributed more than 17 acres to the detached-home dataset and help explain the sharp increase in average lot size.
The gap between average and median pricing tells a similar story. While the average detached sale price increased 12.4%, the median price increased just 1.4%. Removing the two large-site transactions produces an adjusted median price of approximately $712,000, essentially unchanged from 2024’s $715,000 median. The market generated more activity and a stronger mix of high-value properties, but the center of the detached-home market remained relatively stable.
Days on market show a similar distortion. Average CDOM rose by 8 days, but one listing accounts for much of that increase: the 10.67-acre development parcel accumulated nearly 1,200 days before selling. Excluding it, the remaining 62 detached sales averaged approximately 40.9 days on market, indicating the rest of Hood River’s detached homes had a faster marketing time on average.
Detached-home ownership in Hood River also continued to be defined by traditional neighborhood development patterns. Only 14.3% of sales were located within HOA communities, average HOA dues remained modest, and just one newly constructed detached home sold during the year. Most detached-home activity consisted of existing homes changing hands rather than new inventory entering the market.
Detached Homes Scatter Plots
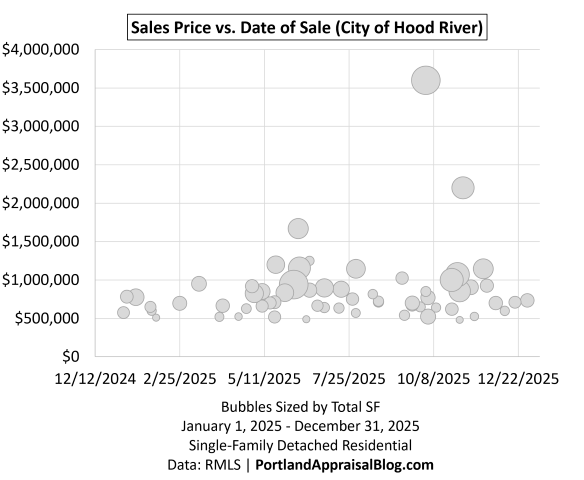
The following scatter plots provide a visual overview of detached-home sales occurring during 2025. Each point represents a single sale and illustrates the relationship between sale price and date of sale. Each graph uses a different physical metric to size the dots to convey a third variable.
In the following graph, dots are sized by total square footage.
In the following graph, dots are sized by acreage.
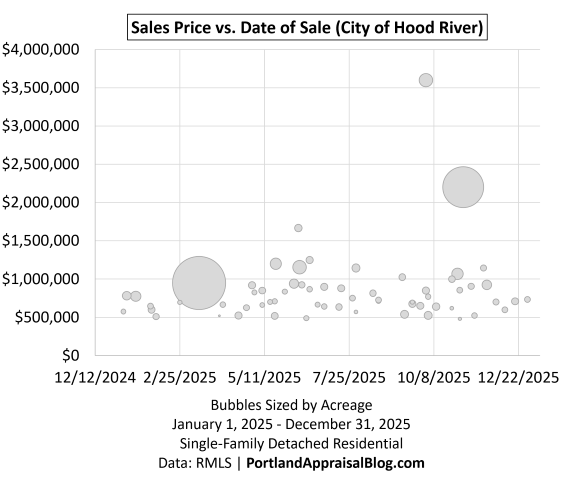
The market remained relatively stable during 2025. Sales occurred throughout the year with no pronounced upward or downward pricing trend, and most transactions occupied a fairly consistent range regardless of closing date.
The square-footage graph illustrates that living area was an important driver of pricing, with many of the largest homes occupying the upper portion of the chart. The acreage graph tells a different story. Most detached-home sales occurred on relatively small urban lots, but a handful of unusually large sites stand apart from the broader market and help explain several of the year’s most notable transactions.
The year’s highest sale, a $3.6 million luxury residence, appears far more distinctive in the square-footage graph than in the acreage graph. This highlights an important distinction within Hood River’s upper-end market: some properties derived value primarily from size, quality, views, and amenities, while others derived value from site characteristics, development potential, or a combination of factors.
Detached Homes Sales by Price Range
The following table summarizes detached-home sales occurring within Hood River city limits during 2025 by price range. In addition to the number of sales, the table highlights the average price, typical size, construction era, and typical lot size within each price band.
| Price Range | Sales | Avg Close Price | Avg Total SF | Avg Year Built | Avg Acres |
|---|---|---|---|---|---|
| ≤400K | 0 | — | — | — | — |
| 400K – 499K | 2 | $484,000 | 1,017 | 1986 | 0.0800 |
| 500K – 599K | 10 | $540,470 | 1,427 | 1969 | 0.1530 |
| 600K – 699K | 14 | $651,457 | 1,620 | 1992 | 0.1400 |
| 700K – 799K | 11 | $733,875 | 1,809 | 1982 | 0.1754 |
| 800K – 899K | 9 | $852,667 | 2,217 | 1977 | 0.1611 |
| 900K – 999K | 7 | $937,643 | 2,347 | 1975 | 1.7271 |
| 1,000K – 1,099K | 2 | $1,047,500 | 2,549 | 2001 | 0.3450 |
| 1,100K – 1,199K | 3 | $1,148,333 | 2,839 | 1988 | 0.3733 |
| ≥1,200K | 5 | $1,983,289 | 2,736 | 1965 | 1.5940 |
| Total/Avg | 63 | $845,392 | 1,945 | 1980 | 0.4587 |
City of Hood River
Single-Family Detached Residential | 2025
Data: RMLS | PortlandAppraisalBlog.com
Detached-home sales spanned a wide range of price points during 2025, but most market activity occurred within a relatively narrow middle range. More than half of all detached-home sales closed between $500,000 and $799,999, while nearly 70% occurred between $500,000 and $899,999. Despite several notable upper-end transactions, the detached market was not dominated by luxury housing.
The distribution of sales also helps explain why median pricing remained relatively stable despite increases in annual averages. A total of 84.1% of detached-home sales closed below $1 million, while just 10 sales (15.9%) crossed the seven-figure threshold. The upper end of the market remained active, but most buyers continued to purchase within a well-defined middle-price segment.
Home size generally increased alongside price, indicating that buyers were typically receiving additional living area as prices rose. This relationship was evident throughout much of the market and helps explain a significant portion of the variation in detached-home pricing.
The upper end of the market was shaped by a small number of distinctive properties rather than a broad luxury segment. Several of the highest-priced transactions involved unusually large sites, development potential, or other characteristics not commonly found within the city’s detached housing stock. As a result, the highest price ranges provide valuable context regarding Hood River’s ceiling, but they do not define the experience of the typical detached-home buyer.
Detached Homes Required Income & Affordability
The following represents affordability and required income findings for detached homes during 2025 under the PABAI framework.
| Category | 2024 | 2025 | Change |
|---|---|---|---|
| Total Sales (Detached) | 57 | 63 | +6 homes |
| # of Affordable Sales | 1 | 1 | No Change |
| % Affordable | 1.75% | 1.59% | -0.17 pts |
| Min Required Income | $73,846 | $114,991 | +$41,145 |
| Avg Required Income | $193,700 | $214,200 | +$20,500 |
| Median Required Income | $182,748 | $183,782 | +$1,035 |
| Max Required Income | $407,798 | $859,330 | +$451,532 |
Single-Family Detached Residential | 2024 & 2025
Data: RMLS | PortlandAppraisalBlog.com
Affordability remained the defining challenge within Hood River’s detached-home market. Only 1 detached-home sale met affordability criteria during 2025, matching the total from 2024 despite an increase in overall sales activity. In practical terms, 62 of 63 detached-home purchases required incomes exceeding HUD median family income thresholds under the PABAI framework.
The most notable change occurred at the lower end of the market. The minimum income required to purchase a detached home increased from $73,846 to $114,991, a reflection of how few lower-cost ownership opportunities remained available during 2025. The year’s lone affordable detached-home sale was a modest 1,008-square-foot cottage in the Heights neighborhood, achieving affordability through compact size rather than deferred maintenance, age, or functional obsolescence.
At the same time, median affordability measures remained remarkably stable. Median required income increased by only about $1,000 year over year, closely mirroring the minimal change observed in detached-home median pricing.
Attached Homes
Attached homes represent the second largest residential housing segment in Hood River and offer a more compact housing site configuration than detached homes while still providing some backyard space.
Attached Homes Market Statistics
The following table compares attached-home sales activity occurring within Hood River city limits during 2024 and 2025. Metrics include the number of sales, total dollar volume, pricing, property characteristics, marketing times, and affordability.
| Category | 2024 | 2025 | Change |
|---|---|---|---|
| Total $ Volume | $5,845,933 | $8,039,000 | +37.51% |
| Average Price | $835,133 | $803,900 | -3.74% |
| Median Price | $786,303 | $705,000 | -10.34% |
| Avg SP/OLP | 96.14% | 90.75% | -5.39 pts |
| Avg PPSF (TSF) | $486.62 | $418.67 | -13.96% |
| # in HOA | 4 | 4 | No Change |
| Avg HOA Dues | $114.92 | $151.23 | +31.60% |
| Avg Total SF | 1,780 | 1,940 | +8.96% |
| Avg Lot Size (ac) | 0.0771 | 0.0640 | -17.04% |
| Avg Age (Yrs) | 8.43 | 15.60 | +7.17 years |
| Avg CDOM | 42.14 | 107.60 | +65.46 days |
| Total # of Sales | 7 | 10 | +3 homes |
| # of New Constr. | 2 | 0 | -2 homes |
| # Affordable | 0 | 1 | +1 home |
| % Affordable | 0.00% | 10.00% | +10 pts |
| Min Req Income | $136,344 | $123,580 | -9.36% |
| Avg Req Income | $218,242 | $206,671 | -5.30% |
| Median Req Income | $207,247 | $178,833 | -13.71% |
| Max Req Income | $376,972 | $380,081 | +0.82% |
City of Hood River
Single-Family Attached Residential | 2024 & 2025
Data: RMLS | PortlandAppraisalBlog.com
Attached-home activity increased during 2025, with sales rising from 7 to 10 transactions and dollar volume increasing to just over $8 million. At the same time, median price, average price, and PPSF all declined. The composition of homes that sold provides important context. Two newly constructed attached homes sold during 2024, while no new-construction sales occurred during 2025. The average age of attached homes sold nearly doubled, helping explain part of the decline in pricing metrics.
Unlike many Portland-area markets, attached homes did not function as a significant affordability tier. One attached-home sale met affordability criteria during 2025, compared with none during 2024. Attached homes averaged nearly the same living area as detached homes while selling at only a modest discount. Median required income declined by approximately $28,000 to $179,000 during 2025.
The attached-home market was dispersed rather than concentrated. Sales occurred across sections of the city, with only 2 transactions occurring within the same development. This distribution indicates the segment’s statistics reflect a variety of attached-home submarkets rather than the influence of a single project.
Condominium Housing
Condominium housing represented the smallest residential housing segment in Hood River in 2025, offering a different ownership structure than detached or attached homes.
Condominium Housing Market Statistics
The following table compares condominium sales activity occurring within Hood River city limits during 2024 and 2025. Metrics include the number of sales, total dollar volume, pricing, property characteristics, marketing times, and affordability.
| Category | 2024 | 2025 | Change |
|---|---|---|---|
| Total $ Volume | $2,022,700 | $2,953,000 | +45.99% |
| Average Price | $404,540 | $492,167 | +21.66% |
| Median Price | $385,000 | $439,000 | +14.03% |
| Avg SP/OLP | 89.20% | 97.53% | +8.33 pts |
| Avg PPSF (TSF) | $433.31 | $530.62 | +22.46% |
| # in HOA | 5 | 6 | +1 home |
| Avg HOA Dues | $258.00 | $403.60 | +56.43% |
| Avg Total SF | 947 | 948 | +0.06% |
| Avg Age (Yrs) | 32.20 | 26.67 | -5.53 years |
| Avg CDOM | 85.40 | 114.50 | +29.10 days |
| Total # of Sales | 5 | 6 | +1 unit |
| # of New Constr. | 0 | 2 | +2 units |
| # Affordable | 4 | 3 | -1 unit |
| % Affordable | 80.00% | 50.00% | -30 pts |
| Min Req Income | $72,572 | $102,893 | +41.78% |
| Avg Req Income | $113,524 | $137,490 | +21.11% |
| Median Req Income | $107,403 | $126,038 | +17.35% |
| Max Req Income | $201,946 | $211,876 | +4.92% |
City of Hood River
Single-Family Condominium Residential | 2024 & 2025
Data: RMLS | PortlandAppraisalBlog.com
Condominium sales remained limited during 2025, with just 6 recorded transactions. Despite the small number of sales, the segment played an outsized role in the city’s ownership market. Condominiums accounted for 3 of Hood River’s 5 affordable residential sales during the year, making them the single largest source of affordable ownership opportunities within city limits.
Pricing increased materially from 2024, but the composition of homes that sold provides important context. Average unit size remained essentially unchanged at approximately 948 square feet, while the average age declined and 2 newly constructed units entered the market. The increase in pricing and PPSF therefore reflects a different mix of units changing hands rather than buyers purchasing substantially larger condos.
Condominiums represented the clearest entry point into homeownership within Hood River, with one unit requiring just over $100,000 in household income. While median required income increased, the figure was close to the HUD median, explaining why the segment was relatively affordable.
Key Takeaways
Hood River’s ownership market remains overwhelmingly centered on detached housing. Detached homes generated more than 5 ownership opportunities per month. Buyers seeking alternatives faced a much smaller pool of options. Attached homes averaged fewer than 1 sale per month, while condominiums averaged roughly 1 sale every other month.
The market’s affordability challenges extended beyond pricing alone. Only 5 residential sales met affordability criteria during 2025, and 3 of those occurred within the condominium segment. Condominiums represented the city’s primary entry point into homeownership, yet the segment produced just 6 sales during the year. For many buyers, affordability and availability were intertwined challenges.
Hood River is neither a full-blown luxury market nor an entry-level market. Instead, it occupies a unique position within the region as a small residential market influenced by growth and development constraints. The result is a housing market where ownership opportunities are limited and affordable options are even more limited.
Sources & Further Reading
All data presented in this study are derived from the sources identified below and have been subjected to cleaning, validation, and analysis procedures appropriate for the research. Statistics, findings, and commentary represent original research and independent appraisal analysis by Abdur Abdul-Malik, SRA, ASA.
Data Sources & Extraction
| Field | Value |
|---|---|
| Study Area | City of Hood River |
| Boundary | Official City of Hood River May 2024 Zoning Map |
| Primary Reporting Period | January 1, 2025 – December 31, 2025 |
| Secondary Reporting Period | January 1, 2024 – December 31, 2024 |
| Extraction Date | November 6, 2026 |
| Primary Data Source | RMLS |
| Total Records Analyzed | 148 Residential Sales |
| 2025 Sales | 79 |
| 2024 Sales | 69 |
| Property Types | Detached Homes, Attached Homes, Condominiums, Manufactured Homes on Owned Land |
Data Provenance Note
Statistics reflect records available through the identified sources at the time of extraction. Subsequent studies may utilize later extracts, additional records, record corrections, or refined validation procedures.
Historical studies are generally preserved as originally published rather than continuously revised. Differences between publications covering the same reporting period do not necessarily indicate an error and may reflect differing extraction dates or evolving datasets.
Geographic Scope & Reference Materials
This study is limited to residential properties located within the incorporated City of Hood River. Neighborhood assignments are based upon official city neighborhood boundaries.
Maps & Boundary References
- City of Hood River Zoning Map (5/2024): Link
Demographic & Community References
- City of Hood River: Description
- City of Hood River: History
- Hood River Overview: Wikipedia
- Population & Area Size: US Census Bureau
Regional Context
- The Portland Region – Six-County Market Area Overview: Portland Appraisal Blog
Methodology & Analytical References
The following resources explain the assumptions, calculations, and analytical frameworks used throughout this study.
Affordability Methodology
Affordability calculations use the median family income for the Portland-Vancouver-Hillsboro Metropolitan Statistical Area (MSA), as published by HUD. This common regional income benchmark is applied consistently across the six-county study area to facilitate geographic comparisons. It is not intended to represent the median family income of individual cities or counties.
- Portland Affordability Index – PABAI: A Realistic Housing Qualification Metric for the Portland Region: Portland Appraisal Blog
- HUD Portland-Vancouver-Hillsboro, OR-WA MSA: Median Family Income
Financing & Mortgage References
- Mortgage Rates & the Portland Region Housing Market: Portland Appraisal Blog
- Freddie Mac Primary Mortgage Market Survey® (PMMS®): Dataset
Data Validation & Research Procedures
- RMLS Data Accuracy Challenges: Portland Appraisal Blog
Research Limitations
Housing-market research relies upon imperfect, evolving datasets. MLS systems depend upon participant reporting and may contain omissions, input errors, classification inconsistencies, delayed updates, search limitations, and other data-quality issues.
While considerable effort is devoted to data cleaning, validation, and quality control, no housing dataset should be considered entirely free of error. The findings presented in this study reflect the best available data and analysis at the time of publication.
Related Research & Continuing Analysis
Readers seeking additional context may find the following research useful.
Regional Research
- The 2025 Portland Region Detached Homes Market in Review: Portland Appraisal Blog
- The 2025 Portland Region Attached Homes Market in Review: Portland Appraisal Blog
- The 2025 Portland Region Condominium Housing Market in Review: Portland Appraisal Blog
- The 2025 Portland Region Manufactured Homes Market in Review: Portland Appraisal Blog

Coda
Thanks for reading—I hope you found a useful insight or an unexpected nugget along the way. If you enjoyed the post, please consider subscribing for future updates.
Are you an agent in Portland who wonders why appraisers always do “x”?
A homeowner with questions about appraiser methodology?
If so, feel free to reach out—I enjoy connecting with market participants across Portland and the surrounding counties, and am always happy to help where I can.
And if you’re in need of appraisal services in Hood River or anywhere in the Portland Region, we’d be glad to assist.
About the Author — Abdur Abdul‑Malik, SRA, ASA
Abdur Abdul‑Malik is the founder, author, and publisher of the Portland Appraisal Blog, where he produces original regional and neighborhood‑level housing analytics for the Portland Region. He is a certified residential appraiser serving Oregon and Washington, drawing on RMLS transaction data, public records, and custom segmentation models he has built.
He developed the Portland Appraisal Blog Affordability Index (PABAI), a payment‑based affordability metric built from actual RMLS sales. PABAI incorporates weekly updates based on the prevailing 30‑year fixed mortgage rate, providing a locally grounded measure of housing affordability across the region.
Learn more → PABAI explainer • mortgage rate series • full author bio


