

Photographer: Jimmy Woo
Via Unsplash.com
Introduction
Manufactured‑home activity across the region showed a steady and broadly distributed performance in Q1 2026. The segment continued to span both rural acreage and metro‑area communities, reflecting its long‑standing role as one of the most geographically diverse housing types in the region. Sales appeared in every county, with contributions from dozens of cities, reinforcing the segment’s reach across a wide range of neighborhoods, lot sizes, and property types.
This quarter also highlighted the dual nature of manufactured‑home inventory. Smaller urban and suburban parcels formed the core of the market, while a handful of large rural properties shaped the upper end of pricing and acreage variation. The mix of these two profiles—compact metro lots and expansive rural acreage—remains one of the defining characteristics of the segment and continues to influence how manufactured homes behave in scatter plots, averages, medians, and quarterly comparisons.
Overall, Q1 2026 offered a clear view of a stable and widely distributed manufactured‑home market, with patterns that align closely with long‑term regional trends. The sections that follow explore these dynamics in more detail, including county‑level activity, city contributions, acreage distribution, and the visual patterns that emerge when price, square footage, and land size are viewed together.
Table of Contents
- Data Housekeeping
- Residential Housing Snapshot
- Portland Region Q1 2026 Overview
- Closing Thoughts
- Sources & Further Reading
- Coda
Data Housekeeping
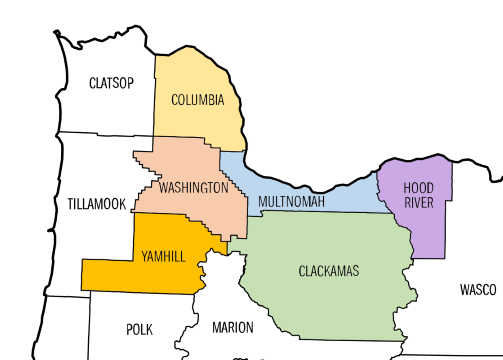
The Portland Region in this update comprises the six Oregon counties of Columbia, Clackamas, Hood River, Multnomah, Washington, and Yamhill. These counties form a contiguous housing ecosystem centered on Portland—Multnomah as the core home county, with the others tightly integrated through commuting patterns, economic ties, and shared market dynamics (e.g., Yamhill’s strong connection via Highway 99W and wine-country adjacency). Beyond Yamhill, the MLS system changes, further distinguishing this six-county area from broader geographic aggregations. For a detailed overview—including county profiles, population data, key value influencers, and why this definition differs from the official seven-county Portland–Vancouver–Hillsboro MSA—see the dedicated page: The Portland Region – Six-County Market Area Overview.
Via SunCatcherStudio
All data is sourced from RMLS and reflects open-market manufactured residential sales (excluding condominiums, attached homes, and site-built detached homes). SNL (“Sold Not Listed”) entries—off-market transactions entered retroactively—have been excluded to preserve consistency with true market activity.
All figures have undergone a rigorous data-cleaning process to address common RMLS accuracy challenges, including misclassifications (e.g. manufactured homes hiding in other categories such as detached), square footage/price typos, incomplete fields, status/date mismatches, and non-representative entries. For a detailed overview of these issues, their impact on market analysis, and how they are mitigated through automated flagging, cross-verification, and manual review, see the dedicated page: RMLS Data Accuracy Challenges.
It is important to note that this review focuses on manufactured homes permanently affixed to land that is also owned by the same party. This means we are excluding classic mobile-home parks where the owner of the mobile home must pay a lease/lot rental fee.
Portland Appraisal Blog Affordability Index (PABAI)
What PABAI Measures
The Portland Appraisal Blog Affordability Index (PABAI) is a model that estimates how home sale prices compare to what a median‑income household can qualify for under standard lending assumptions (HUD Portland-Vancouver-Hillsboro MSA median income, 20% down, and a 28% DTI for principal, interest, taxes, insurance, and HOA dues).
Unlike national affordability indices, PABAI is built from actual RMLS transactions rather than a single hypothetical price point. It computes an affordability ratio for every closed sale in the Portland Region during the analysis period using rates matched to the date of close, reported taxes, reported HOA dues, and an insurance estimate based on a percentage of the home’s value. The individual affordability ratios are then averaged to produce the reported PABAI value for that period.
For Q1 2026, this approach captures the actual mix of homes sold and the financing conditions present at the time those transactions occurred. Each housing segment—detached, attached, condos, and manufactured—is calculated separately, ensuring that segment‑specific dynamics are preserved rather than blended together. This provides a more detailed, locally grounded view of Portland‑area affordability and avoids the distortions that occur when fundamentally different housing types are combined into a single regional metric.
A PABAI of 100 means the market is exactly affordable at that income level (the Q1 2026 HUD median MSA income was $124,100 for a family of four). Values above 100 indicate excess qualifying capacity (more affordable), while values below 100 indicate a shortfall (strained affordability). Full methodology and the interpretation scale are available on the PABAI explainer page.
| PABAI Range | Interpretation |
|---|---|
| 120+ | Strongly Affordable |
| 100–119 | Moderately Affordable |
| 80–99 | Strained |
| Below 80 | Severely Constrained |
Residential Housing Snapshot
| Category | Detached | Attached | Condo | Manuf. |
|---|---|---|---|---|
| Total $ Volume | $2.2B | $161.0M | $199.0M | $32.4M |
| Avg Price | $659,197 | $444,672 | $389,438 | $540,352 |
| Avg PPSF (Total SF) | $316.21 | $286.91 | $325.55 | $356.75 |
| Avg Total SF | 2,164 | 1,576 | 1,180 | 1,571 |
| Avg Lot Size (ac) | 0.655 | 0.066 | N/A | 7.959 |
| Avg Age (Yrs) | 46.03 | 15.09 | 32.03 | 29.10 |
| Avg CDOM | 80.22 | 80.59 | 119.62 | 118.25 |
| # of Sales | 3,349 | 362 | 511 | 60 |
| % of Market | 78.21% | 8.45% | 11.93% | 1.40% |
| Highest Sale | $5,725,950 | $1,175,000 | $2,450,000 | $2,400,000 |
| Lowest Sale | $135,000 | $249,000 | $100,000 | $199,700 |
| Price Spread Ratio | 42.41 | 4.72 | 24.50 | 12.02 |
| PPSF Spread Ratio | 30.93 | 4.08 | 11.91 | 13.29 |
| Total SF Spread Ratio | 23.46 | 4.14 | 12.24 | 3.52 |
| Acreage Spread Ratio | 5,182.19 | 19.54 | — | 1,559.53 |
| Avg PABAI | 85.45 | 110.38 | 122.83 | 118.04 |
Q1 2026 (4,282 total residential sales).
Data: RMLS | PortlandAppraisalBlog.com
The Portland Region’s residential market continues to operate as a tightly connected ecosystem, with each segment shaping and responding to the others in predictable ways. Detached homes remain the anchor segment—by far the largest in both sales count and dollar volume—and their scale sets the outer boundaries of regional pricing, land intensity, and buyer movement. With more than 3,300 sales and over $2.2 billion in closed volume this quarter, detached homes define the structural framework of the metro’s housing activity. Their wide spread ratios across price, PPSF, and size reflect a segment that spans everything from sub‑$150,000 fixers to multi‑million‑dollar estates. Detached homes also remain the least affordable segment, with a PABAI of 85.45, underscoring the gap between median incomes and the cost of entry into the region’s preferred housing type.
Attached homes sit directly beneath detached in the regional hierarchy and serve as the clearest alternative when detached becomes harder to access. They are the youngest segment in the metro—averaging just over 15 years old—and the most uniform, with tight spread ratios that signal a highly consistent, commodity‑like product. Their average price of $444,672 and moderate affordability (PABAI 110.38) position them as the region’s primary safety‑net for buyers priced out of detached homes. Attached homes represented 8.45% of all Q1 sales but played an outsized role in absorbing affordability‑sensitive demand, particularly in areas where detached prices have climbed beyond reach.
Condos remain the most affordable segment in the region, with a PABAI of 122.83 this quarter, but affordability alone does not translate into broad appeal. They are geographically concentrated—over two‑thirds of all condo sales occurred in Multnomah County—and their average age is more than double that of attached homes. HOA dues shape both buyer preferences and long‑term affordability, creating a segment where price ceilings are lower but carrying costs vary widely. Condos make up nearly 12% of all Q1 sales yet contribute less than 8% of total dollar volume, reflecting their structural role as an accessible option for some buyers but not a proportional driver of regional market activity.
Manufactured homes represent the smallest segment by far, with only 60 sales this quarter—just 1.40% of all regional activity. Their averages run high because many transactions include significant acreage: the typical manufactured home in Q1 2026 sat on nearly eight acres, a land profile unmatched by any other segment. This land intensity is the defining feature of manufactured homes and explains why their average price ($540,352) exceeds condos and attached homes despite similar dwelling sizes. Manufactured homes share several surface‑level similarities with condos—age, CDOM, affordability—but diverge sharply in how they trade: manufactured homes trade on land, while condos trade on dues. With such a small sample size, outliers exert more influence on segment averages than in any other category, and this sensitivity is a key consideration when interpreting manufactured‑home metrics.
Across the ecosystem, three of the four segments cluster in the low–mid $300s PPSF, underscoring that structure cost is relatively consistent across the metro. It is land, size, dues, and buyer preferences that create the separation between segments. Detached homes show the widest internal variation, attached homes the tightest, condos a bimodal profile shaped by older stock and boutique new construction, and manufactured homes a land‑driven spread that reflects acreage more than dwelling characteristics. This snapshot frames the broader regional context and sets the stage for the manufactured‑home‑specific analysis that follows.
Portland Region Q1 2026 Overview

Overall Regional Trends
The table below summarizes key metrics for manufactured homes residential sales in the Portland Region (Clackamas, Columbia, Hood River, Multnomah, Washington, and Yamhill counties) for Q1 2026 compared with Q1 2025.
| Category | Q1 2025 | Q1 2026 | Change |
|---|---|---|---|
| Total $ Volume | $21,744,192 | $32,421,110 | +49.10% |
| Average Price | $443,759 | $540,352 | +21.77% |
| Median Price | $404,000 | $432,450 | +7.04% |
| Avg SP/OLP | 95.06% | 91.69% | -3.37 pts |
| Avg PPSF (TSF) | $301.16 | $356.75 | +18.46% |
| Avg HOA Dues | $106.33 | $30.60 | -71.22% |
| Avg Total SF | 1,542 | 1,571 | +1.88% |
| Avg Lot Size (ac) | 3.55 | 7.96 | +124.49% |
| Avg Age (Yrs) | 30.92 | 29.10 | -5.88% |
| Avg CDOM | 78.35 | 118.25 | +50.93% |
| Total # of Sales | 49 | 60 | +22.45% |
| # of New Constr. | 1 | 2 | +100.00% |
| # of REOs | 0 | 2 | — |
| # of Short Sales | 0 | 3 | — |
| Average PABAI | 119.49 | 118.04 | -1.45 pts |
| # Affordable | 30 | 37 | +7 homes |
| % Affordable | 61.22% | 61.67% | +0.45 pts |
Single-Family Manufactured Residential | Q1 2025 & Q1 2026
Data: RMLS | PortlandAppraisalBlog.com
Key Observations From the Aggregate Data
The Portland Region’s manufactured‑home market saw a meaningful increase in activity this quarter, with total dollar volume rising from $21.7 million in Q1 2025 to $32.4 million in Q1 2026. Sales count increased from 49 to 60, a sizable percentage gain but one that should be interpreted cautiously given the segment’s small size. Manufactured homes remain a low‑volume, land‑driven category, and even modest shifts in participation can produce large percentage changes. What stands out more than the increase in sales is the mix of properties that sold: Q1 2026 included several large‑acreage transactions that reshaped the segment’s averages and influenced many of the metrics in the regional overview table.
Average price rose sharply this quarter, increasing 21.77% year‑over‑year, but median price moved only 7.04%. This divergence is a classic mix effect. A handful of high‑acreage, high‑dollar properties pulled the average upward, while the median remained anchored to the typical manufactured home. The acreage distribution illustrates this clearly. The lowest‑acreage properties in both quarters were identical at 0.069 acres, but the upper end of the market expanded dramatically: the largest Q1 2025 sale sat on 34.18 acres, while Q1 2026 included a 107.37‑acre transaction. Median acreage nearly doubled from 0.92 to 1.77 acres, and average acreage more than doubled from 3.55 to 7.96 acres. Total square footage and age, by contrast, remained remarkably stable. The typical manufactured home in Q1 2026 was only 29 years old and just 29 square feet larger than last year’s average. This stability reinforces the central dynamic of the segment: land is the wildcard variable, and acreage—not dwelling characteristics—drives most of the movement in price, CDOM, and SP/OLP.
Affordability also reflected the quarter’s mix. Despite improved mortgage rates, PABAI barely moved, slipping from 119.49 to 118.04. This stability is expected when the segment’s composition shifts toward larger, more expensive acreage properties. Even so, the number of affordable manufactured homes increased from 30 to 37, a meaningful gain for buyers seeking land‑included options within reach of median incomes. Manufactured homes remain one of the region’s more affordable ownership pathways, particularly for households seeking rural settings or acreage‑based utility.
SP/OLP declined from 95.06% to 91.69%, but this is not a market signal so much as a mix signal. High‑dollar manufactured homes—particularly those in the $1 million to $2 million range—often begin with ambitious list prices and require reductions before finding a qualified buyer. These properties also take longer to sell, contributing to the rise in CDOM from 78 to 118 days. As with SP/OLP, the increase in CDOM reflects the presence of large‑acreage, high‑price listings rather than a broad shift in buyer behavior or market conditions.
Taken together, the regional overview shows a manufactured‑home segment shaped primarily by land intensity and the presence of several large rural transactions. The underlying dwelling characteristics remained stable, affordability held steady, and the segment continued to operate as a small but meaningful part of the Portland Region’s housing ecosystem. This factual context sets the stage for the visual analysis that follows, where the scatter and bubble plots help illustrate how acreage influenced pricing and time on market in Q1 2026.
Portland Region Scatter Plots
To visualize the distribution of individual manufactured homes sales prices across Q1 2026, the following scatter plots show sales price against date of sale:

The scatter plot for Q1 2026 manufactured‑home sales shows a stable mid‑market band with a small number of large rural outliers that shaped the quarter’s averages. Nearly half of all sales this quarter—43.33%—closed between $300,000 and just under $500,000, forming the core of the market and creating the dense central cluster visible in the plot. Roughly 60% of the segment remained under $500,000, and 85% closed under $700,000, reinforcing the consistency of the mid‑range and the affordability profile that manufactured homes typically provide.
Above this central band, the scatter shows several high‑dollar outliers that influenced the quarter’s average price. Two sales exceeded $2 million, and another closed above $1.1 million. These properties sit well above the main cluster and visually demonstrate how a small number of large rural transactions can pull the average upward even when the median moves only modestly. Manufactured homes are uniquely sensitive to these outliers because the segment is small and land‑driven; a single high‑acreage sale can reshape the upper end of the scatter without altering the underlying structure of the mid‑market.
The timeline also reflects the segment’s naturally sporadic cadence. With only 60 sales this quarter, gaps between closings are expected and do not indicate any underlying shift in buyer behavior or market conditions. Manufactured homes trade infrequently, and their distribution across the quarter is shaped more by listing availability and rural transaction timing than by any broader trend.
Overall, the scatter plot illustrates a manufactured‑home market defined by a predictable mid‑market core and a small number of acreage‑driven outliers. The visual distribution aligns with the broader regional trends discussed earlier and provides a clear, factual foundation for the acreage‑based bubble analysis that follows.
To visualize three important variables at one, the following scatter plot shows sales price versus total square footage with each dot sized by acreage (lot size):

One of the most notable features of the plot is the presence of two very large bubbles near the top of the price range. These represent the highest‑dollar sales of the quarter, both closing above $2 million and both situated on exceptionally large lots—more than 100 acres each. Their size and position make clear how acreage drives the upper end of manufactured‑home pricing. The segment posted a land ratio of 1,559.53 this quarter, meaning the largest lot was nearly 1,560 times larger than the smallest lot. This underscores how dominant land value is within this category.
At the other end of the spectrum, many very small bubbles appear throughout the mid‑market band. 38.33% of all Q1 sales closed on lots under 0.50 acres, including properties located within the City of Portland and other urban or suburban settings. By the time the acreage reaches 1.50 acres, more than half the segment (51.67%) has already been accounted for. This wide spread—from compact city parcels to expansive rural acreage—is a defining characteristic of the segment and explains why manufactured homes show such large swings in average price and other metrics from quarter to quarter.
As the bubbles increase in size, a clear pattern emerges: larger bubbles naturally rise toward the upper end of the price range, while smaller bubbles cluster within the mid‑market. Manufactured homes with modest dwelling sizes but substantial land value tend to occupy the top of the scatter, while homes on smaller lots anchor the core of the market. The bubble plot makes this dynamic visually intuitive, showing how land—not square footage—is the primary driver of price variation within the segment.
Overall, this scatter plot reinforces the central theme of the manufactured‑home market in Q1 2026: a stable mid‑market core shaped by typical dwelling sizes, and a small number of large rural transactions that define the upper end of the price spectrum.
Counties & Top Cities Reporting Sales
The following table provides sales count for the region by county for Q1 2026 compared with Q1 2025:
| County | # Q1 2025 Sales | # Q1 2026 Sales | Change |
|---|---|---|---|
| Clackamas | 14 | 22 | +8 homes |
| Columbia | 6 | 7 | +1 home |
| Hood River | 2 | 4 | +2 homes |
| Multnomah | 7 | 4 | −3 homes |
| Washington | 5 | 12 | +7 homes |
| Yamhill | 15 | 11 | −4 homes |
| Total | 49 | 60 | +11 homes |
Data: RMLS | PortlandAppraisalBlog.com
Two observations stand out. First, Multnomah and Yamhill were the only counties that lost ground year‑over‑year, with modest declines of 3 and 4 homes respectively. Every other county posted gains, led by Clackamas (+8) and Washington (+7), both of which saw notable increases in manufactured‑home activity. Second, the region as a whole recorded a net gain of 11 manufactured‑home sales, reflecting a broader uptick in segment activity across Q1 2026.
A total of 33 cities reported at least one manufactured‑home sale in Q1 2026, reflecting the segment’s broad geographic reach across the region. To keep the table focused and readable, the summary below highlights cities with three or more sales during the quarter. These communities together accounted for 40.00% of all manufactured‑home activity, providing a clear view of where the segment was most concentrated.
| City | # of Sales | % of Q1-26 Market |
|---|---|---|
| Oregon City | 6 | 10.00% |
| Amity | 3 | 5.00% |
| Estacada | 3 | 5.00% |
| Hood River | 3 | 5.00% |
| North Plains | 3 | 5.00% |
| Rainier | 3 | 5.00% |
| Sherwood | 3 | 5.00% |
| Total | 24 | 40.00% |
Data: RMLS | PortlandAppraisalBlog.com
Oregon City led the quarter with 6 sales, representing 10% of the entire manufactured‑home market. The remaining cities each contributed 3 sales, forming a balanced group of mid‑level contributors spread across Clackamas, Washington, Columbia, Hood River, and Yamhill counties.
The following map shows the geographic distribution of manufactured sales for Q1 2025 (blue pins) and Q1 2026 (red pins):

The pattern highlights the broad geographic reach of the segment, with activity appearing in every county and clustering along major corridors such as I‑84, Highway 26 and Highway 47. Rural areas continue to play a significant role in overall volume, but the map also shows a steady presence of manufactured‑home sales throughout the metro.
The following map shows the geographic distribution of manufactured sales centered around the City of Portland:

Unlike the regional map—where rural counties contribute many of the large‑acreage transactions—this metro‑focused view shows how consistently manufactured homes appear within the urban fabric of the region. Concentrations appear throughout Portland, Gresham, Sherwood, Beaverton, Newberg, and Oregon City, illustrating the steady presence of manufactured‑home activity within these city areas.
By isolating the Oregon portion of the metro, the map makes clear that manufactured homes are not limited to rural acreage or outlying counties. Many sales occur on smaller city and suburban parcels, aligning with earlier findings that 38.33% of Q1 2026 manufactured‑home sales closed on lots under 0.50 acres. The density of markers across the westside, eastside, and inner Portland neighborhoods reinforces the segment’s reach across a wide range of communities and lot sizes.
Closing Thoughts
Q1 2026 was a solid quarter for manufactured‑home activity across the region, marked by a meaningful year‑over‑year gain and a broad geographic footprint. The segment added 11 more sales than last year, with most counties posting increases and only Multnomah and Yamhill showing modest declines. The distribution of sales across 33 cities underscores how widely manufactured homes are represented throughout the region, from rural acreage to metro communities.
Acreage variation remained one of the defining characteristics of the segment. More than 38% of Q1 sales closed on lots under 0.50 acres, while two large rural transactions exceeded 100 acres, producing a spread ratio of nearly 1,560. This wide range continues to shape pricing behavior, with land value exerting a strong influence on the upper end of the market. The bubble‑scatter plot made this dynamic clear, showing how larger parcels naturally rise toward the top of the price spectrum while smaller urban and suburban lots anchor the mid‑market.
Taken together, Q1 2026 reflects a stable and geographically diverse manufactured‑home market—one shaped by a mix of small‑lot metro sales and a handful of large rural properties that continue to define the segment’s upper range. The majority of the movement in averages is simply due to the type of properties that closed this quarter.
What trends do you expect to see in Q2 2026? I’d love to hear your thoughts—feel free to reply here or reach out directly.
Sources & Further Reading
All data presented in this quarterly update is sourced directly from RMLS and has been subjected to our rigorous cleaning and validation process to ensure reliability for manufactured residential analysis in the six-county Portland Region. The trends, comparisons, and commentary are the result of original appraisal expertise and independent analysis—not aggregated from secondary sources or news summaries.
- RMLS Data Challenges: Portland Appraisal Blog
- The Portland Region – Six-County Market Area Overview: Portland Appraisal Blog
- Portland Affordability Index – PABAI: A Realistic Housing Qualification Metric for the Portland Region: Portland Appraisal Blog
- Mortgage Rates & the Portland Region Housing Market: Portland Appraisal Blog
- The 2025 Portland Region Manufactured Housing Market in Review: Portland Appraisal Blog
- The 2024 Portland Region Manufactured Housing Market in Review: Portland Appraisal Blog

Coda
Thanks for reading—I hope you found a useful insight or an unexpected nugget along the way. If you enjoyed the post, please consider subscribing for future updates.
Are you an agent in Portland who wonders why appraisers always do “x”?
A homeowner with questions about appraiser methodology?
If so, feel free to reach out—I enjoy connecting with market participants across Portland and the surrounding counties, and am always happy to help where I can.
And if you’re in need of appraisal services in Portland or anywhere in the Portland Region, we’d be glad to assist.









 Portland Appraisal Blog

