hollywoodHUB is Portland’s newest 12-story tower rising over the Hollywood MAX station—222 permanently affordable apartments, including 32 three-bedroom units. The deepest affordable units are capped at $37,250 or less per year for a family of 4 (30% area median income), with subsidies like Project-Based Section 8 helping even lower-income families qualify. Residents will live across from Trader Joe’s and 24 Hour Fitness, steps from MAX, and blocks from Providence Hospital, the library, and Hollywood Theatre.
Full in-depth analysis with market data and what 30% AMI really means:
Are you an agent in Portland who wonders why appraisers always do “x”?
A homeowner with questions about appraiser methodology?
If so, feel free to reach out—I enjoy connecting with market participants across Portland and the surrounding counties, and am always happy to help where I can.
And if you’re in need of appraisal services in Portland or anywhere in the Portland Region, we’d be glad to assist.
The Portland Region detached homes market in 2025 remained stable—modest gains in volume (+2.11%) and prices (+0.84% median to $599,990) amid longer CDOM (+11.09% to 59.15 days) and reduced new construction (-11.86%). Tight supply (~2.9 months MOS) supported resilience in a selective, balanced environment.
Portland White Stag sign with trees in autumn colors. Via Canva Pro
The Portland Region’s detached single-family home market in 2025 remained in a state of equilibrium—a continuation of the balanced conditions observed throughout the quarterly updates. After the sharp rate-driven shifts of 2022–2023, the region has settled into a new normal: modest growth, increased buyer selectivity, and persistent supply constraints. Prices held firm with slight upward movement, transaction volume grew incrementally, and marketing times lengthened as buyers became more deliberate in a still-elevated borrowing environment.
This stability was not uniform across segments or submarkets. Core properties continued to drive the majority of activity, while luxury showed resilience in select pockets. New construction retreated further, pushing the average home age older and reinforcing resale dominance. Months of supply stayed tight, supporting price levels without dramatic volatility.
The following sections provide a regional overview, segment breakdown, monthly trends, and detailed county-level statistics.
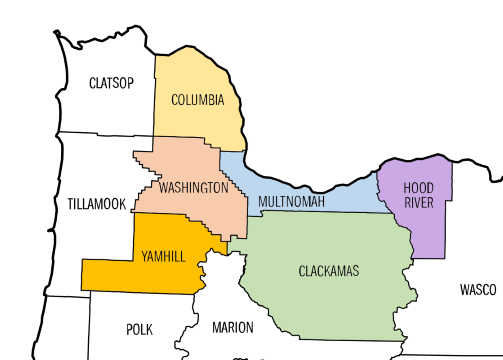
The Portland Region in this review comprises the six Oregon counties of Columbia, Clackamas, Hood River, Multnomah, Washington, and Yamhill. These counties form a contiguous housing ecosystem centered on Portland—Multnomah as the core home county, with the others tightly integrated through commuting patterns, economic ties, and shared market dynamics (e.g., Yamhill’s strong connection via Highway 99W and wine-country adjacency). Beyond Yamhill, the MLS system changes, further distinguishing this six-county area from broader geographic aggregations. For a detailed overview—including county profiles, population data, key value influencers, and why this definition differs from the official seven-county Portland–Vancouver–Hillsboro MSA—see my dedicated page: The Portland Region – Six-County Market Area Overview.
All data is sourced from RMLS and reflects open-market detached single-family residential sales (excluding condos, attached homes, manufactured homes on leased land, and multifamily). SNL (“Sold Not Listed”) entries—off-market transactions entered retroactively—have been excluded to preserve consistency with true market activity.
All figures have undergone my standard cleaning process to address common RMLS accuracy challenges, including misclassifications (e.g., condos listed as detached), square footage/price typos, incomplete fields, status/date mismatches, and non-representative entries. For a detailed overview of these issues, their impact on market analysis, and how I mitigate them through automated flagging, cross-verification, and manual review, see the dedicated page: RMLS Data Accuracy Challenges.
Important note for the 2025 annual review: I published quarterly updates for each quarter of 2025, and sharp readers may notice that the total sales count here exceeds the sum of the four quarterly figures. This occurs because some agents delay updating records for months after closing. A recent comprehensive check of all non-close-sale data uncovered additional stragglers that were not captured in the quarterly snapshots. As a result, this full-year aggregation provides the most complete and accurate picture of 2025 detached home activity in the region.
Portland Region 2025 Overview
The Portland Region’s detached single-family home market in 2025 remained in a state of equilibrium—modest gains across key metrics despite increased buyer selectivity and a continued retreat in new construction.
Overall Regional Trends
The table below summarizes key metrics for detached single-family residential sales in the Portland Region (Columbia, Clackamas, Hood River, Multnomah, Washington, and Yamhill counties) for all of 2025 compared with 2024.
The 2025 full-year metrics reinforce the theme of stability that defined the quarterly updates—modest gains in volume and prices occurred within a market that remained balanced rather than shifting dramatically in any direction.
Modest overall growth with compositional support: Total sales volume rose +2.11% to $11.7 billion on +1.25% more transactions (17,083 closings). Median and average close prices advanced +0.84% each—to $599,990 and $682,557—while average PPSF edged +0.21% to $321.05 despite homes becoming slightly larger (+1.04% to 2,203 SF). Normally, larger average sizes exert downward pressure on PPSF; the fact that PPSF held positive suggests underlying value support through quality or compositional shifts in the sold inventory.
Aging inventory and reduced new construction: Average home age increased +12.84% to 48.52 years, driven primarily by a -11.86% decline in new construction closings (1,858 vs 2,108 in 2024). This shift skewed the transaction mix toward older existing stock, limiting fresh supply and reinforcing resale dominance.
Increased buyer selectivity: Average cumulative days on market lengthened +11.09% to 59.15 days—a clear sign of greater deliberation and caution. Even as mortgage rates eased gradually through 2025 (from early highs near 7.0% to year-end levels around 6.1–6.2%), rates remained elevated relative to historical norms and sustained the lock-in effect for many homeowners. Buyers took more time to decide, compare, and negotiate, contributing to the modest dip in SP/OLP ratio to 97.24% (-0.69%).
Tight supply conditions: Months of supply averaged approximately 2.9 months—well below the traditional 4–6 month benchmark for balance. This continued tightness supported price resilience and prevented broader volatility, even as selectivity rose.
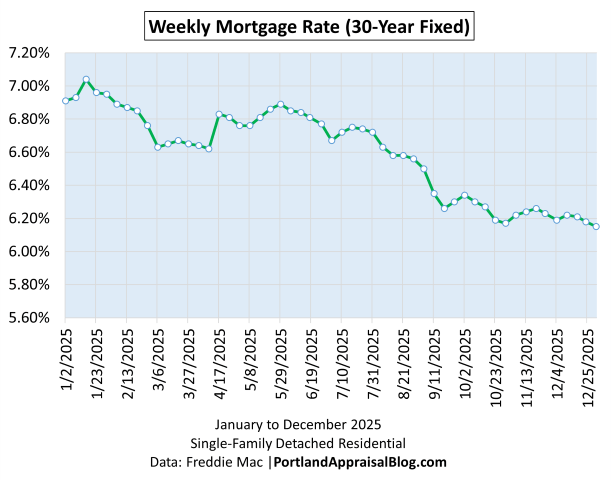
The gradual downward trend in weekly 30-year fixed mortgage rates throughout 2025—from early-year highs near 7.0% to year-end levels around 6.1–6.2%—provided some affordability relief compared to 2024. However, rates remained elevated relative to recent historical norms and continued to contribute to buyer caution, as evidenced by the increase in average cumulative days on market.
Portland Region Scatter Plots
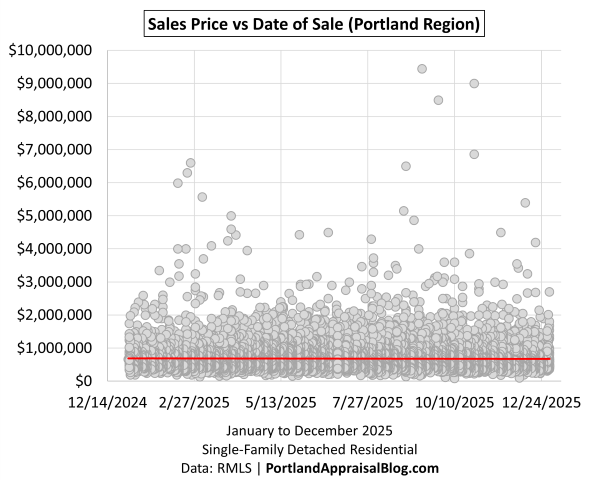
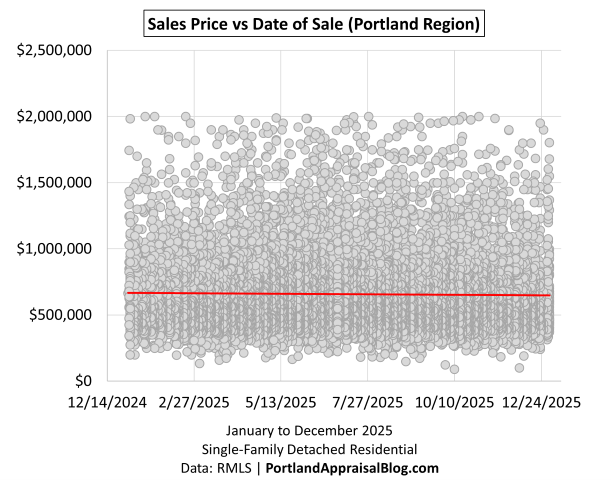
To visualize the distribution of individual sale prices across 2025, the following scatter plots show sales price against date of sale. The first graph displays the full range of transactions, while the second focuses on the $0–$2M range. In both, the red line represents a fitted trendline across all transactions.
The full-range scatter illustrates the complete distribution of detached single-family home sales prices in the Portland Region for 2025. The majority of transactions cluster in the lower bands, with occasional high-end outliers extending up to $10M+. The fitted trendline shows no clear upward or downward direction, reinforcing the year’s price stability.
The zoomed view focuses on the $0–$2M range, revealing a dense “wall” of sales below approximately $1.3M–$1.5M throughout the year. Density thins noticeably above that level, highlighting the core market’s dominance in transaction volume while higher-price sales remain comparatively sparse and scattered. This pattern aligns with the broader stability theme: modest gains supported by compositional factors rather than broad appreciation.
Bottom-line Summary
The 2025 Portland Region detached single-family home market delivered a year of continued equilibrium—modest gains in volume and prices persisted within a balanced, non-volatile environment. While cumulative days on market lengthened and new construction retreated, the overall picture remained one of stability three years after the rapid mortgage rate rise. Supply stayed tight, buyer selectivity increased modestly, and prices held firm with slight upward movement, reflecting a market that has settled into a sustainable new normal.
Core Market (< $1M)
The core market—homes under $1 million—continued to anchor the majority of activity in the Portland Region during 2025, driving most of the transaction volume while showing modest resilience amid broader selectivity. This segment remained the primary engine of market movement, with buyers in this price range facing affordability constraints yet benefiting from greater availability of inventory compared to the luxury tier.
The following table compares core market metrics (< $1M) in 2025 with 2024:
The core market—homes under $1 million—continued to anchor the majority of activity in the Portland Region during 2025, accounting for 90.18% of total sales count and 78.84% of dollar volume. This segment drove the bulk of transaction movement while demonstrating modest resilience amid broader selectivity pressures. Transaction volume grew slightly (+0.96% to 15,406 sales), and dollar volume advanced +1.71% to $9.19 billion. Median and average close prices rose +0.78% and +0.74% respectively—to $575,000 and $596,742—with average PPSF edging +0.35% to $312.93 despite a modest increase in average home size (+0.91% to 2,026 SF).
The core segment experienced more pronounced lengthening of marketing times than the region overall, with average cumulative days on market rising +13.02% to 56.50 days. This reflects heightened buyer caution in the more rate-sensitive price range, though sellers conceded only modestly more ground (SP/OLP ratio 97.47%, down -0.69%). New construction in core declined -10.82% to 1,698 closings, contributing to an older average age (+5.48% to 48.93 years) and further emphasizing resale dominance. Notably, average lot size in core increased +10.06% to 0.46 acres—a compositional shift that likely supported the modest PPSF gain by adding value through additional land.
Overall, the core market remained the foundation of regional activity in 2025, absorbing the majority of demand while navigating increased selectivity and reduced fresh supply. Its performance—modest gains in volume and prices with firmer PPSF resilience—helped maintain the year’s broader equilibrium.
Luxury Market (≥ $1M)
The luxury segment—homes priced at $1 million and above—represented a smaller but resilient portion of the Portland Region’s 2025 detached single-family market. While core properties drove the majority of transaction volume, luxury homes showed greater stability in certain metrics, particularly time on market, amid a year of overall equilibrium. This segment benefited from buyers who were often less rate-sensitive and more decisive when the right property aligned with their preferences.
The following table compares luxury market metrics (≥ $1M) in 2025 with 2024:
Luxury homes accounted for 9.82% of total sales count and 21.16% of dollar volume in 2025, with transaction count rising +4.03% to 1,677 and dollar volume advancing +3.63% to $2.47 billion. Median and average close prices softened slightly—down -0.37% to $1,255,000 and -0.39% to $1,470,905—while average PPSF declined -1.37% to $395.59.
Average cumulative days on market showed resilience, dipping -0.63% to 83.47 days, in contrast to the core segment’s more pronounced lengthening (+13.02% to 56.50 days). This suggests that well-positioned high-end homes are still finding buyers efficiently, and emphasizes the need to price homes realistically.
New construction in luxury fell more sharply (-21.57% to 160 closings), contributing to a shift toward resale dominance within the segment.
Average lot size decreased -17.16% to 2.33 acres, though this may reflect a compositional move toward smaller urban or estate parcels rather than a broad trend.
Overall, the luxury market demonstrated relative strength in marketing time and modest dollar-volume growth, even as per-unit metrics softened. This resilience—particularly in time on market—helped balance the year’s broader selectivity, with luxury buyers remaining committed when the right property appeared.
Sales Volume
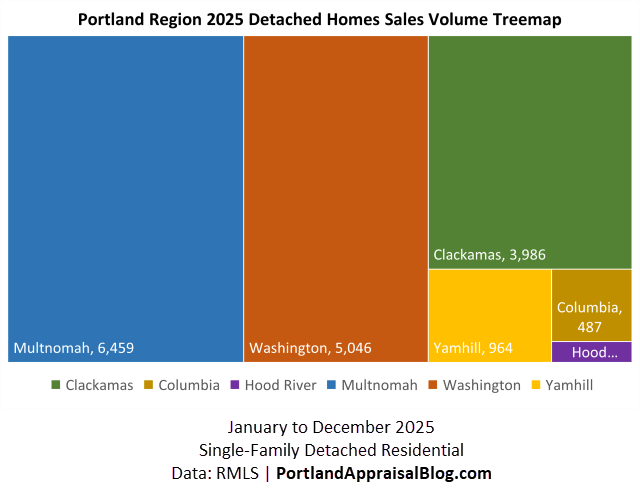
Washington, Clackamas, and Multnomah counties together accounted for nearly 91% of the region’s detached single-family sales in 2025, underscoring their central role in overall market activity. The following treemap visualizes the distribution by county, sized by sales count:
Multnomah led with 6,459 sales (37.81% of regional total), followed by Washington (5,046 sales, 29.54%) and Clackamas (3,986 sales, 23.33%). Yamhill contributed 964 sales (5.64%), Columbia 487 sales (2.85%), and Hood River 141 sales (0.83%). This geographic concentration remained highly consistent with 2024—the top three counties held ~90.68% of sales in 2025 compared to ~90.26% the prior year—reflecting the region’s enduring urban and suburban dominance.
The modest year-over-year shifts in county shares (e.g., Multnomah up slightly to 37.81%, Washington down to 29.54%, Clackamas essentially flat) further illustrate the stability that characterized 2025. Smaller counties showed greater percentage volatility due to lower base volumes, but the overall distribution reinforced a balanced market without significant reallocation of activity.
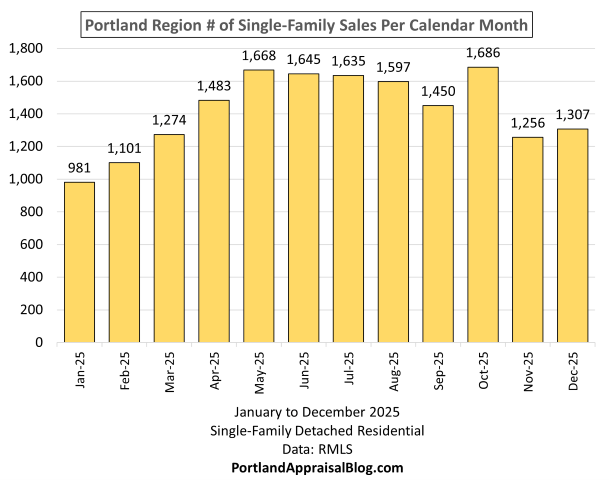
Monthly sales counts in 2025 followed a classic seasonal pattern typical of the Portland Region—lower activity in winter, a ramp-up through spring, peak momentum in late spring and early summer, a modest dip in early fall, and a surprising late-year rebound. The following bar chart shows total detached single-family sales by month for 2025:
The chart reveals the expected seasonality: weakest in January and February, building steadily to a spring peak in May and then gradually declining until October (1,686—the year’s highest month) before tapering in November and December. This late-year strength in October and December helped offset softer mid-spring and summer months compared to 2024, contributing to the modest annual increase in total closings.
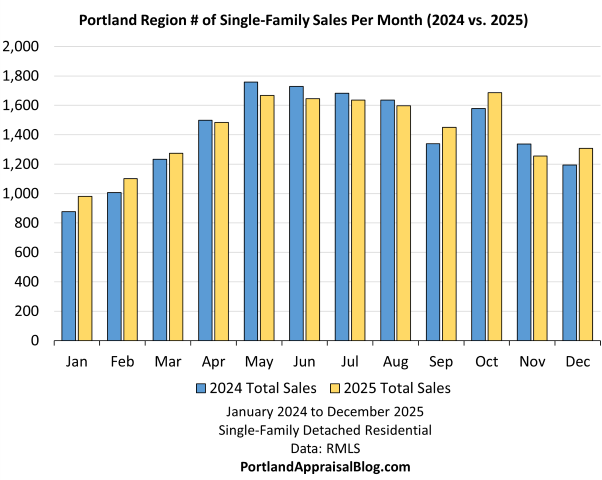
Monthly sales counts in 2025 tracked closely with 2024 for most of the year, reflecting the same underlying stability across seasons. The following double bar chart compares total detached single-family sales by month for the two years:
The two years remained remarkably neck-and-neck in monthly activity, with differences mostly modest in scale. 2024 showed noticeable strength in May, June, and November, while 2025 pulled ahead in January, October, and December. This pattern aligns with gradual mortgage rate easing throughout 2025, which likely encouraged some buyers to act earlier in the year or wait for improved affordability late in the year. The standout October performance in 2025 (1,686 sales, the year’s high point) echoed a strong fall trend seen in 2024, likely influenced by families finalizing moves after the school year start, pre-holiday motivation, and Portland’s relatively mild October weather facilitating showings and closings.
Overall, the close month-to-month alignment reinforces that 2025 was not a year of dramatic seasonal shifts or momentum changes—just incremental variations that netted the modest +1.25% increase in annual sales.
Sales Price
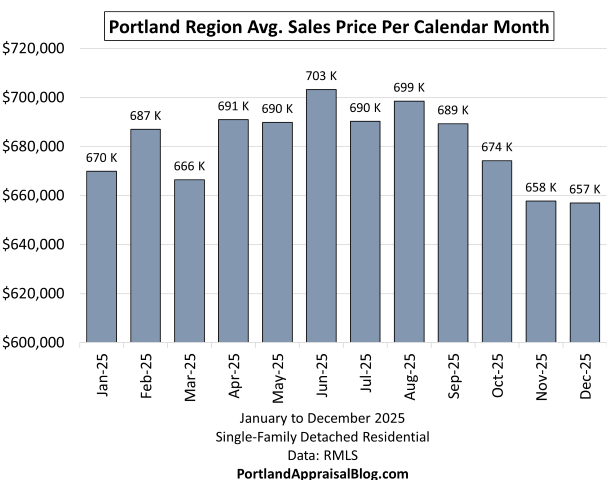
Monthly average sales prices in 2025 remained remarkably stable throughout the year, closely mirroring 2024’s patterns with only modest seasonal fluctuations and no significant directional trend. The following bar chart shows average close prices by month for 2025:
Note: The y-axis starts at $600,000 to allow better examination of monthly differences.
The chart reveals a narrow range of monthly averages—from approximately $657,000 in November and December to $703,265 in June—a spread of about 7% from low to high. Prices peaked in late spring and early summer (April–August mostly $690k–$703k), then gradually softened through fall and winter. This seasonal arc is typical of the region, with stronger activity and higher-value closings during peak buyer season, followed by a quieter late-year period. The overall flatness across months reinforces the year’s broader price equilibrium.
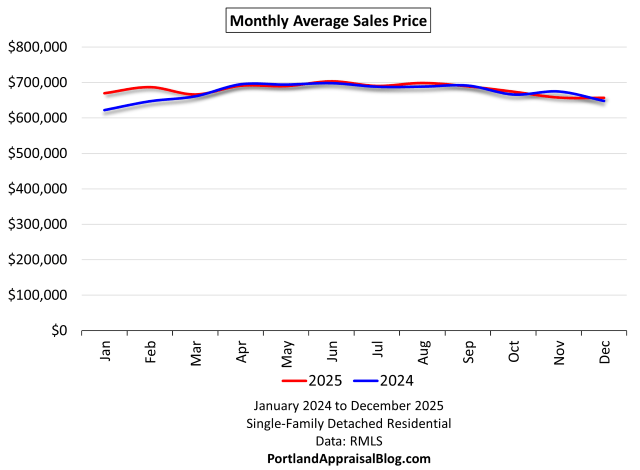
The following line graph below compares monthly average sales prices for 2024 (blue) and 2025 (red), with a full y-axis scale starting near zero to show true proportional differences:
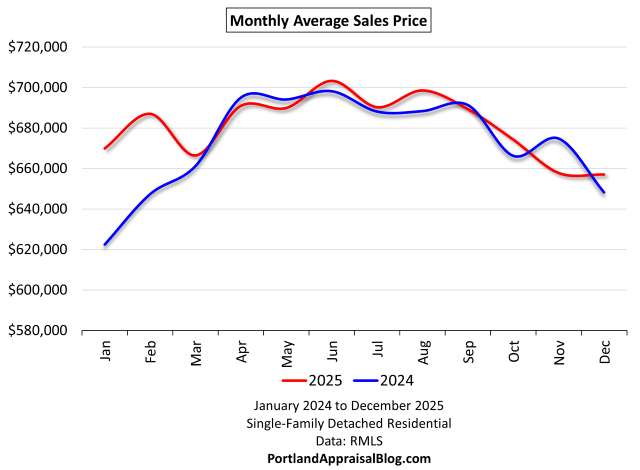
When viewed on this full scale, the two years appear nearly identical across most months, with only minor divergences — primarily a stronger start in January and February 2025. This visual compression underscores the high degree of price stability year-over-year. Zooming in we have:
Note: The y-axis starts at $580,000 to allow better examination of monthly differences.
The above graph reveals the modest seasonal movements more clearly.
New Construction
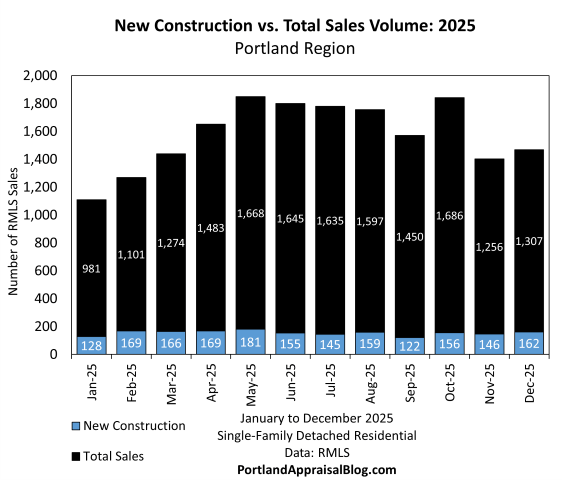
New construction activity in 2025 declined noticeably from 2024 levels, with 1,858 new homes closing compared to 2,108 the prior year (-11.86%). As a share of total sales, new construction averaged 10.88% for the year, reflecting a reduced contribution from fresh inventory to overall market volume. The following double bar chart shows monthly total sales (primary bars) versus new construction closings (nested/secondary bars) in 2025:
New construction share was highest early in the year (February 15.35%, January 13.05%, March 13.03%), then trended lower through spring and summer (June–August ~9–10%), reached a low in September (8.41%), and rebounded modestly in November and December (~11–12%). This pattern reflects typical builder closing cycles—more completions in Q1/Q2 — while total sales peaked later in the spring/summer buyer season, resulting in lower relative share during high-volume months. The annual decline contributed to older average inventory and reinforced resale dominance across the region.
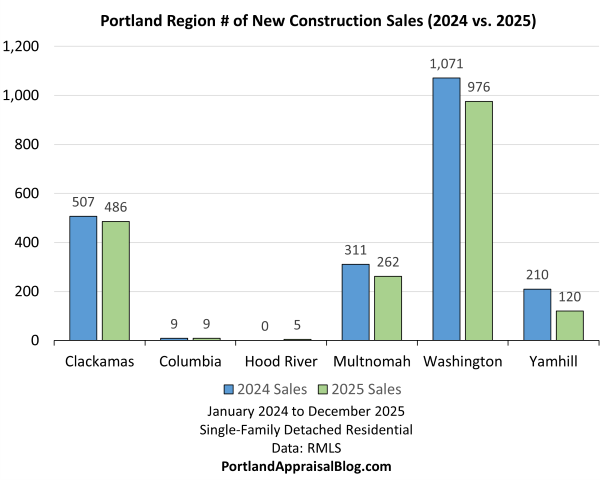
While new construction declined regionally, the geographic distribution of new closings remained concentrated in the larger suburban counties. The following side-by-side double bar chart compares new construction sales volume by county in 2024 versus 2025:
Washington County continued to dominate new construction activity, accounting for 52.53% of regional new closings in 2025 (976 sales, down -8.87% from 2024). Clackamas followed at 26.16% (486 sales, -4.14%), and Multnomah contributed 14.10% (262 sales, -15.76%). Yamhill saw the sharpest relative drop (-42.86% to 120 sales, 6.46% share), while Columbia remained flat at 9 sales (0.48%) and Hood River posted a small gain (5 sales from 0, 0.27% share). The concentration in Washington and Clackamas—together nearly 79% of 2025 new closings—reflects their suburban growth areas and remaining builder pipelines, while smaller counties saw more volatility due to limited scale.
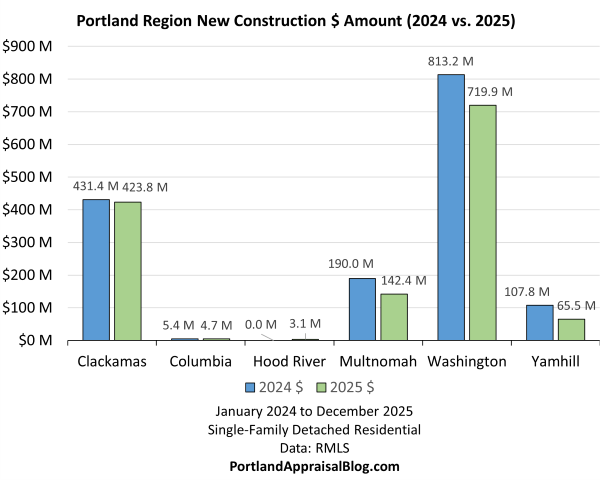
The table below shows new construction sales volume by dollar amount for 2025 compared with 2024.
The following double bar chart provides the above information at a glance:
Washington County dominated new construction dollar volume in 2025 ($719.9 million, 52.96% of regional total), followed by Clackamas ($423.8 million, 31.18%). Together these two counties accounted for over 84% of regional new-home value, reflecting their suburban growth areas and remaining builder pipelines. The regional decline in new construction dollar volume (~12.17% to $1.36 billion) slightly outpaced the count drop, indicating modest softening in average new-home pricing alongside reduced volume.
Clackamas County’s strong showing in new construction value was supported by vested projects in growth areas like Sandy. However, the ongoing sewer moratorium in Sandy (extended to June 2026) may limit future pipeline, potentially reducing Clackamas’s regional share in 2026–2027 as approved projects are completed. For full details on the moratorium’s history, impacts, and timeline, see my recent analysis.
Despite the measurable pullback in new construction closings and dollar volume, the segment remained a significant economic force in the Portland Region. Nearly $1.4 billion in new home value changed hands in 2025—a substantial contribution to local jobs, supply-chain activity, tax base support, and overall economic circulation. This underscores the ongoing importance of home building even in a year of reduced activity and resale dominance.
Cumulative Days on Market
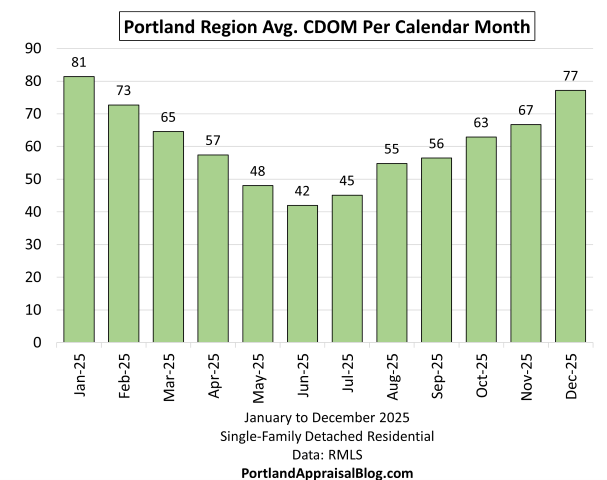
Average cumulative days on market (CDOM) rose +11.09% year-over-year to 59.15 days in 2025, reflecting increased buyer selectivity in a market where mortgage rates, while easing modestly, remained elevated relative to historical norms. The following bar chart shows average CDOM by calendar month for 2025:
The chart reveals the classic “V” pattern typical of the region: longest marketing times in winter months (January & December), a sharp drop through spring (March through May), a trough in late spring/early summer (June & July), then a gradual rise through fall/early winter (September through December). This seasonality aligns with expected patterns—stronger buyer activity and faster turnover during peak season, slower movement in winter due to holidays, weather, and reduced showings.
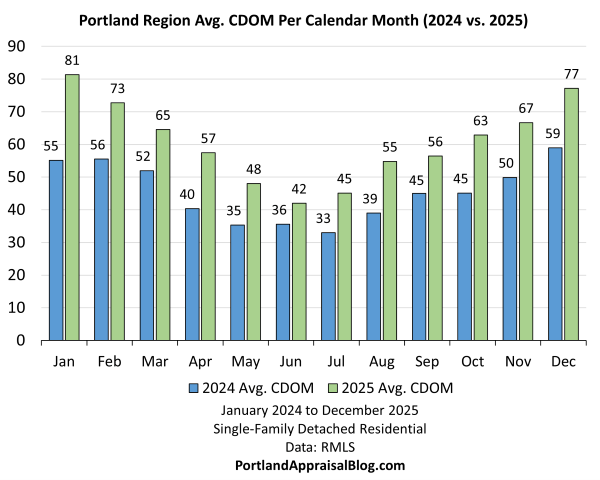
The bar chart below compares cumulative days on market for 2024 and 2025:
2025 CDOM was higher in nearly every month, with the increase most pronounced in winter (January +26 days, December +18 days) but evident across the board. The “V” shape persisted in both years, yet the overall elevation in 2025 underscores structural factors—persistent affordability hurdles and buyer caution—rather than seasonal-only shifts. Sellers contributed by holding firm to initial list prices, conceding only modestly more ground (SP/OLP ratio 97.24%, down -0.69%), which extended exposure periods without triggering widespread reductions.
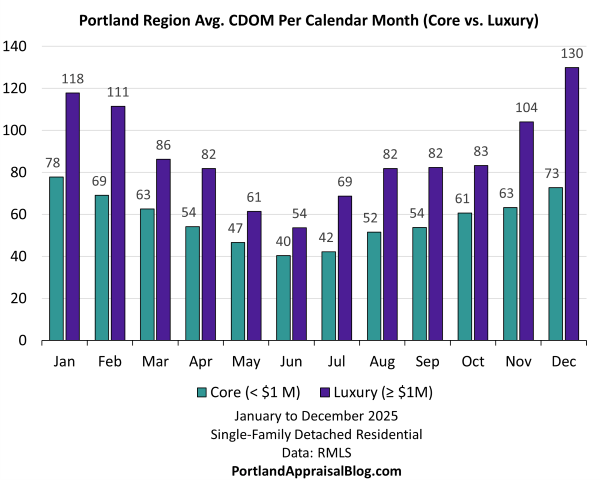
The Core vs Luxury CDOM comparison further illustrates segment-specific dynamics within the year’s broader selectivity trend. The following bar chart shows average cumulative days on market by calendar month for 2025, segmented by core (< $1M) and luxury (≥ $1M):
Luxury CDOM remained consistently higher than core throughout the year, reflecting the longer marketing times typical of higher-price properties that attract fewer, more selective buyers. Annual averages were 83.47 days for luxury (-0.63% from 2024) versus 56.50 days for core (+13.02% from 2024), highlighting greater resilience in the luxury segment. The “V” seasonality persisted in both, with winter highs and summer lows, but luxury showed a flatter profile overall—less pronounced seasonal swings—while core experienced more noticeable lengthening during peak periods.
This divergence aligns with buyer behavior: core buyers, more rate-sensitive and facing affordability constraints, exercised greater caution and took longer to decide, contributing to the segment’s sharper CDOM rise. Luxury buyers—often with more equity or cash positions—remained decisive when the right property appeared, resulting in relatively stable marketing times despite a slower sales pace. The contrast reinforces that selectivity pressures in 2025 were more acute in the core market, while luxury benefited from targeted demand in premium submarkets.
Housing Supply
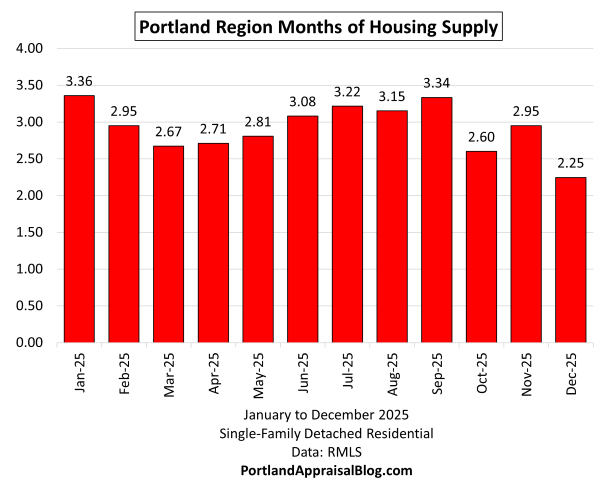
Months of supply (MOS)—the number of months it would take to absorb current active inventory at the prevailing sales pace, assuming no new listings enter the market—remained low throughout 2025, averaging approximately 2.9 months. This continued tightness supported price resilience and modest gains despite increased buyer selectivity and longer marketing times. The following bar chart shows MOS by calendar month for 2025:
The chart illustrates clear seasonality: MOS peaked in January (3.36 months) as sales slowed and some listings lingered or re-entered the market post-holidays, dipped through spring (March 2.67, April 2.71), rose modestly during summer (June 3.08, July 3.22, August 3.15), and reached its lowest point in December (2.25 months). The December low reflects widespread year-end listing cancellations and withdrawals—a common pattern as sellers pause for holidays, tax considerations, or motivation loss—while January’s high results from many of those listings re-entering the market alongside new ones.
This seasonal wave aligns with expected regional patterns: stronger sales pace relative to inventory in peak buyer months (spring/summer) pulls MOS lower, while slower winter activity allows inventory to build relative to closings. The annual average of ~2.9 months stayed well below the traditional 4–6 month benchmark for a balanced market, maintaining a seller-leaning environment that helped anchor price stability even as CDOM lengthened.
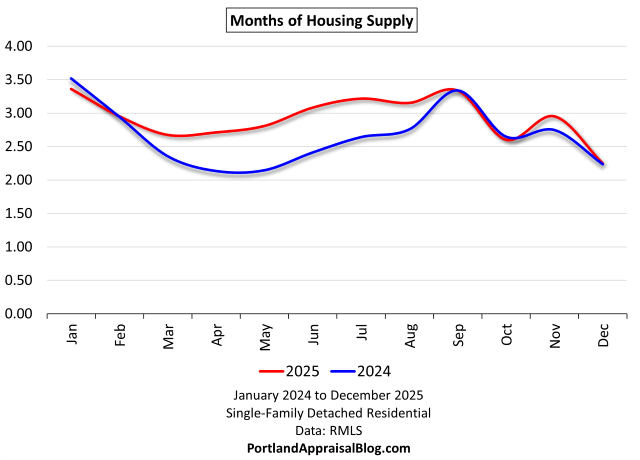
The line graph below compares monthly months of supply for 2024 (blue line) and 2025 (red line), with a full y-axis scale to show true proportional differences:
Both years exhibited similar seasonal waves: higher MOS in winter (January peaks around 3.4–3.5 months), a dip through spring as sales pace accelerated, a modest rise in summer, and lows in late fall/early winter (December ~2.2–2.3 months in both years). The lines converged closely at the start (January) and end (December) of the year, with the most noticeable divergence occurring in spring and summer months, where 2024 showed lower (more constrained) MOS—often 0.5–0.8 months below 2025 levels—indicating relatively stronger absorption relative to inventory during peak buying season in 2024.
Overall, 2025 averaged modestly higher supply (2.92 months) compared to 2024 (2.66 months), remaining well below the traditional 4–6 month benchmark for a balanced market. This slight increase contributed to incremental affordability relief and helped support the year’s modest transaction volume growth, while the persistent tightness anchored price stability and limited broader volatility.
Miscellaneous Statistics & Standout Transactions
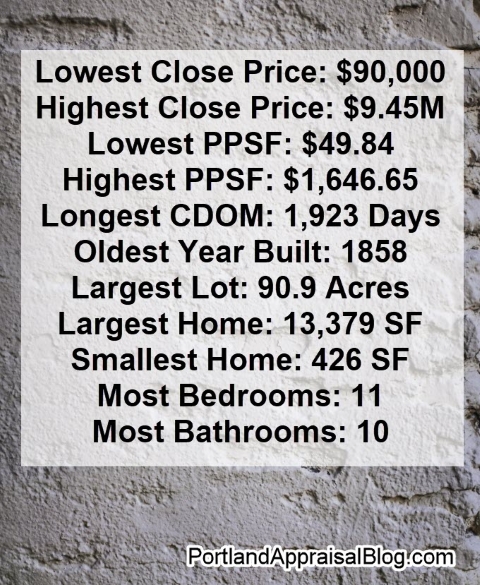
The 2025 Portland Region detached single-family market produced a range of notable extremes and interesting figures that highlight the diversity and breadth of activity across price points, sizes, features, and marketing times. The following standouts capture some of the year’s most remarkable data points.
Lowest close price: $90,000—a 1930s fixer cabin in Forest Grove (Washington County). The property offered original character but required extensive rehabilitation, including interior plumbing repairs and floor work. Photos of this property are currently available online.
Highest close price: $9.45 million—a lakefront estate in Lake Oswego (Clackamas County). The property featured approximately 280 feet of private Oswego Lake shoreline, panoramic views, a primary suite addition, pool, extensive entertaining spaces, six-car garage (pre-wired for expansion), and a boathouse. This transaction reflects sustained demand for premium waterfront properties in Clackamas County, consistent with the area’s historical strength at the upper end of the market. Photos of this property are currently available online.
Lowest PPSF: $49.84—an REO (bank-owned) fixer-upper in Clatskanie, OR 97016 (Columbia County). This 2-story home with basement offered good natural light and scenic surroundings but required significant vision and effort to restore to its potential. As one of the region’s most affordable major counties, Columbia continues to produce entry-level opportunities for buyers willing to undertake rehabilitation work. Photos of this property are currently available online.
Highest PPSF: $1,646.65 per square foot—a lakefront property on Oswego Lake in Clackamas County that is near the highest sale. The home sold for $8,500,000 and measured 5,162 square feet, featuring 4 bedrooms, 6 full bathrooms, 1 half bathroom, and a 0.26-acre lot. This transaction reflects strong demand for premium waterfront locations in the region, where location and views can drive exceptional value per square foot. Photos of this property are currently available online.
Longest CDOM: 1,923 days—a working vineyard estate in Yamhill County. The property first listed in March 2019 for $1.3 million, saw no price adjustment until March 2023, went pending in July 2024, and closed in August 2025 for $1.195 million. The extended marketing time reflects the challenges of selling a specialized vineyard property on a small-volume market, though the final discount was moderated by appreciation since the initial listing. This extreme duration highlights how niche or rural properties can face prolonged exposure in a selective environment. Photos of this property are currently available online.
Oldest home sold in 2025: Built in 1858—the former residence of Capt. George Jerome in Oregon City, OR (Clackamas County, Canemah historic neighborhood). This 3-bedroom home (main level living plus 3 upstairs bedrooms) sits adjacent to Willamette Falls, with a detached garage offering bonus room potential for hobbies or an ADU. The property represents a piece of Oregon’s early history, located in a neighborhood poised for future development tied to the falls area. Photos of this property are currently available online.
Largest lot sold in 2025: 90.9 acres—a property in North Plains, Oregon (Washington County). The 4,335-square-foot home sits on a mostly sloped and heavily forested lot, offering significant land area with limited immediate buildable potential. This sale reflects the region’s occasional demand for large rural or acreage parcels, often appealing to buyers seeking privacy, recreation, or long-term investment. Photos of this property are currently available online.
Largest home sold in 2025: 13,379 square feet—a sprawling estate in West Linn, Oregon (Clackamas County). The property sat on 20.18 acres adjacent to the Oregon Golf Club and included a shop building larger than the main residence itself. It sold for $6,500,000 after 299 days on market. This sale highlights demand for expansive, large-lot properties in the region’s suburban and semi-rural areas, where size and outbuildings add significant utility. An exterior photo of the property may be viewed here.
Smallest home sold in 2025: 426 square feet—a cabin in Scappoose, Oregon (Columbia County) on 1.4 acres. This compact property offered a minimal footprint with potential for buyers seeking an affordable entry into detached ownership or a rural retreat. Photos of the cozy home are currently available online and may be viewed here.
Most bedrooms: 11—a former adult foster care home in Tigard, OR (Washington County). The 7-bathroom property included a large kitchen, laundry area, living and family rooms, formal and informal dining, a back living/dining area with wet bar and desk setup, recent updates (new roof, AC/furnace, water heater, LVP flooring, electrical panel, interior/exterior paint), furniture negotiable, detached garage for storage, private deck, and an adjacent city-owned lot for extra parking. It sold to another adult care company, reflecting continued demand for larger, adaptable homes suitable for group living or care facilities in the region. Photos of this property are currently available online.
Most bathrooms: 10—a 9,500-square-foot residence in Dundee, Oregon (Yamhill County), currently operating as the Franziska Haus bed and breakfast. The property included 10 bedrooms and was designed for guest accommodations, making it convenient for wine-tasting visitors in the area. It likely could be converted to a private residence with minimal interior changes. Photos of the home are currently available online and may be viewed here.
Multnomah County 2025 Stats
Multnomah County remained the Portland Region’s core and highest-volume market in 2025, accounting for 37.81% of all detached single-family sales with 6,459 transactions. The following table compares key metrics for the county in 2025 with 2024:
The table below summarizes key metrics for Multnomah County detached single-family residential sales in Q1 2026 compared with Q1 2025.
Multnomah showed modest growth in transaction volume (+4.08% to 6,459 sales) and dollar volume (+6.10% to $4.1 billion), outpacing the regional increase in both metrics. Median and average close prices rose +1.85% to $550,000 and +1.94% to $635,278 respectively, while average PPSF gained +1.08% to $316.80. The PPSF gains occurred despite a modest home size increase (+1.08% to 2,108 SF), suggesting underlying value support through compositional factors (larger average lot size) and location premiums in the county’s urban/suburban mix. Average cumulative days on market lengthened +4.87% to 49.14 days—a milder increase than the regional +11.09%—indicating relatively stronger demand and quicker turnover compared to surrounding counties. New construction fell -15.76% to 262 closings, contributing to an older average age (+4.68% to 68.84 years) and further emphasizing resale dominance.
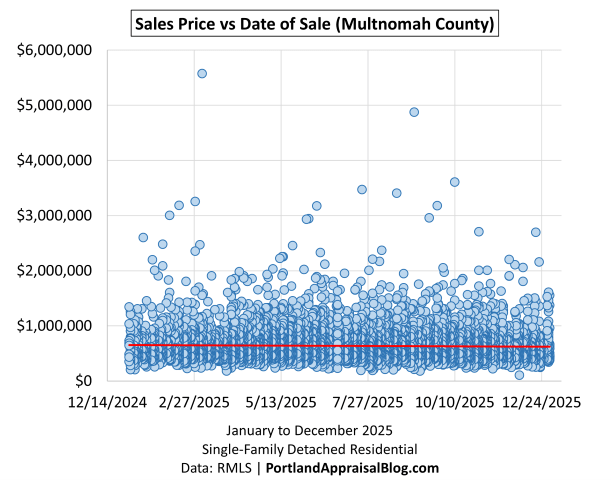
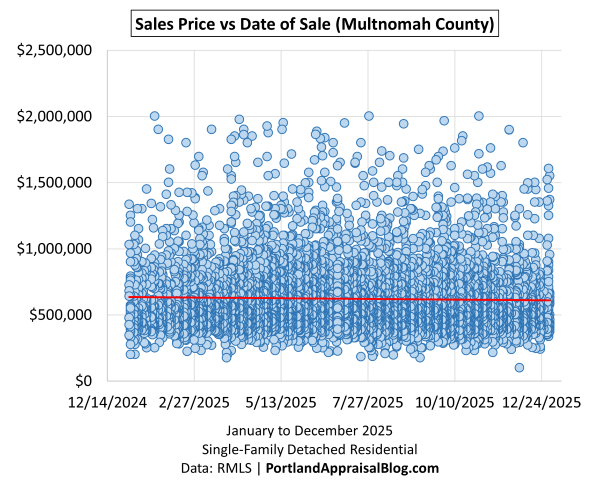
The scatter plots below visualize individual sale prices against date of sale in Multnomah County for 2025. The first shows the full range, while the second focuses on the $0–$2M range:
The full-range plot includes occasional high-end outliers up to nearly $6M, while the zoomed view reveals a dense “wall” of transactions below approximately $1M, accounting for roughly 91% of the county’s sales count. Density thins noticeably above that level, underscoring Multnomah’s role as the primary driver of core and mid-range volume while luxury sales remained comparatively sparse and scattered throughout the year. This distribution aligns with the county’s urban/suburban character and older inventory base.
Washington County 2025 Stats
Washington County, the region’s second-largest market by volume, represented 29.54% of all detached single-family sales in 2025 with 5,046 transactions. The following table compares key metrics for the county in 2025 with 2024:
Washington posted a near-flat sales count (-0.77% to 5,046) but saw dollar volume soften -2.38% to $3.45 billion, reflecting modest price erosion and compositional shifts. Median price declined -1.31% to $626,699, average price -1.62% to $684,155, and average PPSF -2.17% to $317.20. These declines occurred despite a slight increase in average home size (+1.09% to 2,245 SF) and were driven primarily by smaller average lot sizes (-10.34% to 0.42 acres) and reduced new construction (-8.87% to 976 closings), which limited higher-priced fresh inventory. Average cumulative days on market surged +20.03% to 61.89 days—the sharpest increase among major counties—signaling greater buyer selectivity and slower absorption in this suburban-heavy market. SP/OLP ratio fell -1.34% to 97.02%, indicating increased concessions.
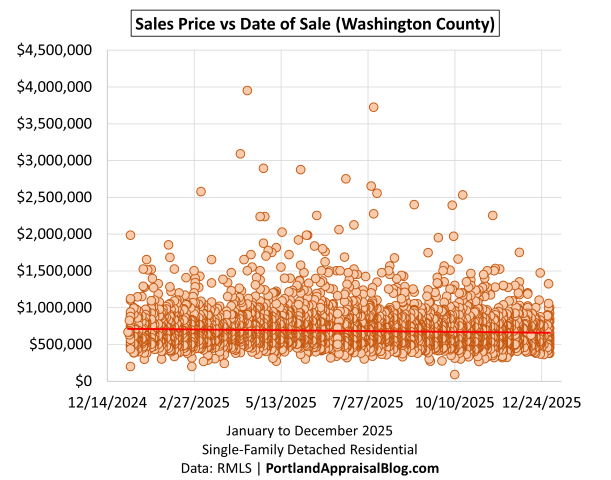
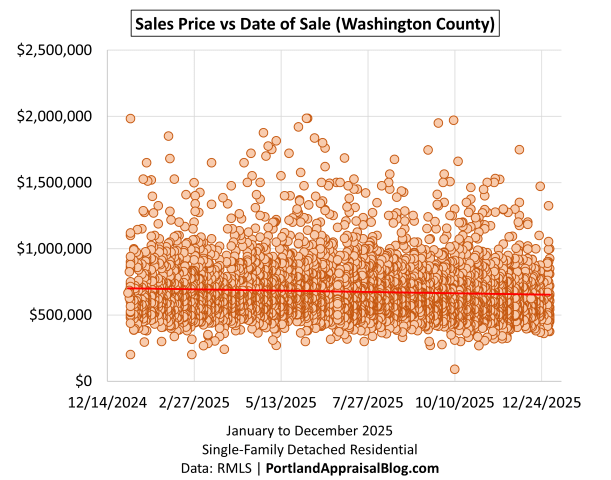
The scatter plots below visualize individual sale prices against date of sale in Washington County for 2025. The first shows the full range, while the second focuses on the $0–$2M range:
The full-range plot includes occasional high-end outliers up to $4M, while the zoomed view reveals a dense “wall” of transactions below approximately $1M, thinning noticeably above that level. This pattern underscores Washington’s core market strength in volume while highlighting softer momentum in the luxury segment, consistent with localized pressures in tech-heavy submarkets like Hillsboro. For a detailed look at how Intel layoffs have impacted inventory, pricing, and absorption in Hillsboro during 2024–2025, see my recent analysis.
Clackamas County 2025 Stats
Clackamas County, the region’s third-largest market by volume, represented 23.33% of all detached single-family sales in 2025 with 3,986 transactions. The following table compares key metrics for the county in 2025 with 2024:
Clackamas delivered modest but genuine growth in 2025. Sales count rose +1.22% to 3,986, dollar volume increased +2.72% to $3.16 billion, median price advanced +1.35% to $658,750, average price gained +1.49% to $793,962, and average PPSF edged +1.00% to $336.43. These gains occurred despite a reduction in average lot size (-9.29% to 0.94 acres) and only modest home size increase (+0.55% to 2,394 SF), suggesting underlying value support through location, quality, or compositional factors rather than broad size-driven appreciation. Average cumulative days on market lengthened only +3.04% to 64.41 days—a relatively mild increase compared to regional +11.09% or Washington +20.03%—indicating stronger relative demand and quicker turnover in this diverse county. New construction declined modestly -4.14% to 486 closings, the smallest drop among major counties.
Clackamas’s performance was bolstered by its mix of rural/exurban areas and premium enclaves, particularly Lake Oswego and West Linn, which contribute to the county’s outsized share of regional luxury activity. In 2025, Clackamas accounted for approximately 42.1% of the Portland Region’s luxury dollar volume (≥ $1M), totaling $1.04 billion out of the regional $2.47 billion—the largest share among counties. This contrasts with the core market (< $1M), which comprised only ~67% of Clackamas’s own dollar volume, the smallest core dollar volume share among major counties with significant activity.
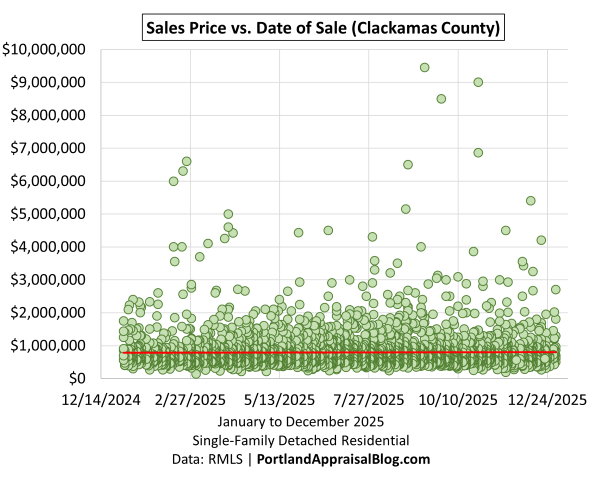
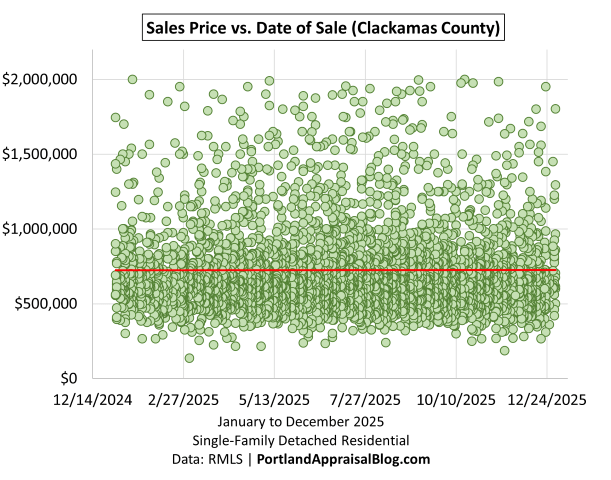
The scatter plots below visualize individual sale prices against date of sale in Clackamas County for 2025. The first shows the full range, while the second focuses on the $0–$2M range:
The full-range plot includes occasional high-end outliers up to nearly $10M, while the zoomed view reveals a dense “wall” of transactions below approximately $1.3M–$1.5M throughout the year, with density thinning noticeably above that level. This pattern highlights Clackamas’s strong core volume alongside its leading role in regional luxury value, driven by premium lakefront and waterfront properties.
Yamhill County 2025 Stats
Yamhill County, a smaller but growing market in the region (5.64% of total sales), saw 964 detached single-family sales in 2025. The following table compares key metrics for the county in 2025 with 2024:
Yamhill experienced a sharp decline in transaction volume (-7.57% to 964 sales) and dollar volume (-4.88% to $574 million), driven primarily by a steep drop in new construction (-42.86% to 120 closings). This reduction in fresh supply limited higher-priced inventory and contributed to the overall pullback. Despite these headwinds, price metrics showed resilience: median price rose +3.00% to $515,000, average price +2.92% to $595,444, and average PPSF +3.30% to $312.04. These gains occurred amid only modest home size increase (+1.21% to 1,972 SF) and were largely supported by a significant rise in average lot size (+14.23% to 1.90 acres), suggesting buyers prioritized additional land or rural parcels that added value. Average cumulative days on market lengthened +13.19% to 76.14 days, reflecting increased selectivity, while SP/OLP ratio fell -0.59% to 96.49%, indicating modestly greater concessions.
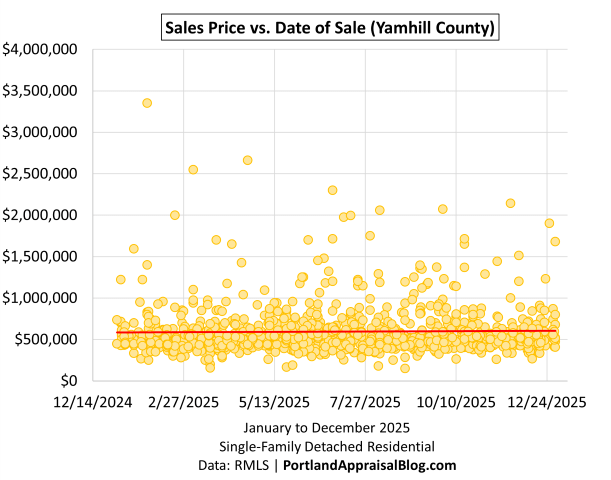
The scatter plot below visualizes individual sale prices against date of sale in Yamhill County for 2025:
The scatter shows a dense concentration of transactions below approximately $1M throughout the year, with sparser, more scattered points above that level. This pattern reflects Yamhill’s more rural and affordable character, where core and mid-range volume dominates while luxury sales remain limited. The absence of strong seasonal clustering in the price cloud supports the county’s price resilience despite the volume decline, bolstered by larger lot sizes and selective demand for wine-country or rural properties.
Columbia County 2025 Stats
Columbia County, the region’s smallest major market by volume, represented 2.85% of all detached single-family sales in 2025 with 487 transactions. The following table compares key metrics for the county in 2025 with 2024:
Columbia County delivered solid performance in 2025, with sales count rising +4.51% to 487 and dollar volume advancing +8.00% to $244 million — growth that outpaced the increase in transactions. Median price gained +4.18% to $477,125, average price +3.35% to $501,012, and average PPSF +3.39% to $281.23. These improvements occurred alongside larger average home size (+2.51% to 1,933 SF) and a substantial increase in average lot size (+16.33% to 2.25 acres), indicating compositional factors — more spacious properties and land parcels — supported genuine value appreciation. Average cumulative days on market lengthened +14.84% to 81.81 days, reflecting increased selectivity consistent with regional trends. New construction remained flat at 9 closings, and SP/OLP ratio improved slightly +0.16% to 96.08%.
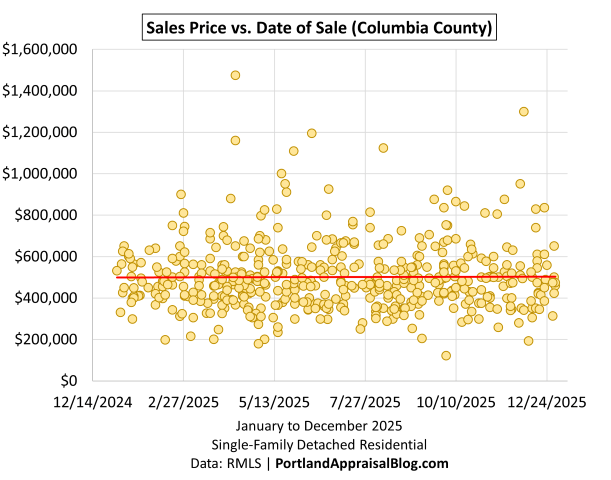
The scatter plot below visualizes individual sale prices against date of sale in Columbia County for 2025:
The scatter shows an extremely dense concentration of transactions below approximately $600,000 throughout the year, with thin activity above that level; $1M+ sales are rare outliers. This tight clustering reinforces Columbia’s position as the most affordable county in the region, where the core market (< $1M) overwhelmingly dominated (98.56% of sales count, 96.57% of dollar volume) and luxury activity remained negligible (only 7 sales, ~3.43% of county dollar volume).
Hood River County 2025 Stats
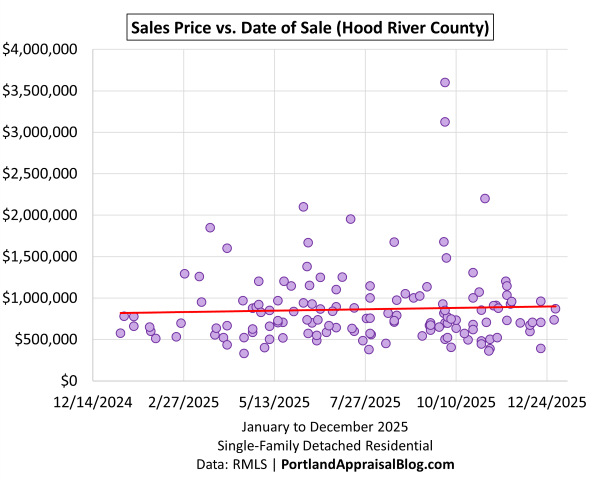
Hood River County, the region’s smallest market by volume, represented 0.83% of all detached single-family sales in 2025 with 141 transactions. Due to its low base numbers, the county is prone to large percentage swings. The following table compares key metrics for the county in 2025 with 2024:
Hood River posted solid growth on a small base: sales count rose +5.22% to 141, and dollar volume advanced +15.27% to $121.9 million. Median price gained +2.01% to $735,000, average price increased +9.55% to $864,341, and average PPSF softened -1.62% to $417.15. These results were driven by compositional factors—larger average home size (+7.30% to 2,136 SF) and a substantial increase in average lot size (+98.78% to 2.47 acres)—which added value and supported the dollar volume jump despite only modest sales growth. Average cumulative days on market lengthened significantly +44.29% to 76.21 days, amplified by the small base and reflecting increased selectivity. New construction emerged modestly (5 closings from 0), while SP/OLP ratio fell -2.17% to 94.00%, indicating greater discounts.
The scatter plot below visualizes individual sale prices against date of sale in Hood River County for 2025:
The scatter shows a relatively tight mid-range cluster ($500k–$1.5M) for much of the year, with several high-end outliers ($2M–$3.5M+) appearing more frequently in the latter months. The fitted trendline reflects an upward shift in the second half of 2025, driven by these late-year luxury sales. This pattern aligns with the segment’s strong performance (luxury sales count +60% to 32, dollar volume +68.15% to $47.3M) on a small base, contributing significantly to the county’s overall growth. Hood River’s scenic Gorge location, wine-country appeal, and tourism/second-home demand help explain the selective strength at the upper end despite limited overall volume.
Closing Thoughts
The 2025 Portland Region detached single-family home market delivered a year of continued equilibrium—modest gains in volume and prices persisted within a balanced, non-volatile environment. While cumulative days on market lengthened and new construction retreated, the overall picture remained one of stability three years after the rapid mortgage rate rise. Supply stayed tight, buyer selectivity increased modestly, and prices held firm with slight upward movement, reflecting a market that has settled into a sustainable new normal.
This stability played out against a backdrop of remarkable diversity across the six-county region. From urban core neighborhoods in Multnomah to suburban growth corridors in Washington and Clackamas, rural and wine-country areas in Yamhill, affordable exurban pockets in Columbia, and scenic Gorge communities in Hood River, the market offered a wide spectrum of options. Affordability remained a challenge for many, yet detached ownership was still attainable at the lower end—the year’s lowest sale closed at $90,000. Homes were found for those willing to be patient, search diligently, and consider rehabilitation or rural locations. Meanwhile, the 17,083 transactions represented substantial movement: long-time owners parting with properties held for decades, families relocating for schools, jobs, or lifestyle, and first-time buyers achieving detached homeownership. Each closing reflected real human transitions and progress in a selective but functional market.
Sources & Further Reading
All data presented in this annual review is sourced directly from RMLS and has been subjected to my rigorous cleaning and validation process to ensure reliability for detached single-family residential analysis in the six-county Portland Region. The trends, comparisons, and commentary are the result of original appraisal expertise and independent analysis—not aggregated from secondary sources or news summaries.
Sandy Oregon’s Sewer Moratorium — The End of a 27-Year New Construction Boom: Portland Appraisal Blog
External Obsolescence in Hillsboro — Residential Market Response to Intel’s 2024–2025 Workforce Reductions: Portland Appraisal Blog
Coda
Thanks for reading—I hope you found a useful insight or an unexpected nugget along the way. If you enjoyed the post, please consider subscribing for future updates.
Are you an agent in Portland who wonders why appraisers always do “x”?
A homeowner with questions about appraiser methodology?
If so, feel free to reach out—I enjoy connecting with market participants across Portland and the surrounding counties, and am always happy to help where I can.
And if you’re in need of appraisal services in Portland or anywhere in the Portland Region, we’d be glad to assist.
Intel cut over 4,400 jobs in Hillsboro from 2024–2025—mostly local. Headline prices looked stable, but condos, attached homes, and detached homes all fell when you strip out new construction. And days on market have jumped 36-63%! This shows external obsolescence hitting the Hillsboro market.
Are you an agent in Portland who wonders why appraisers always do “x”?
A homeowner with questions about appraiser methodology?
If so, feel free to reach out—I enjoy connecting with market participants across Portland and the surrounding counties, and am always happy to help where I can.
And if you’re in need of appraisal services in Portland or anywhere in the Portland Region, we’d be glad to assist.
hollywoodHUB delivers 126 family-sized affordable units—including 32 three-bedroom apartments—to Portland’s Hollywood Transit Center. Appraisal insights, market context, and what 30% AMI really means in a high-cost metro.
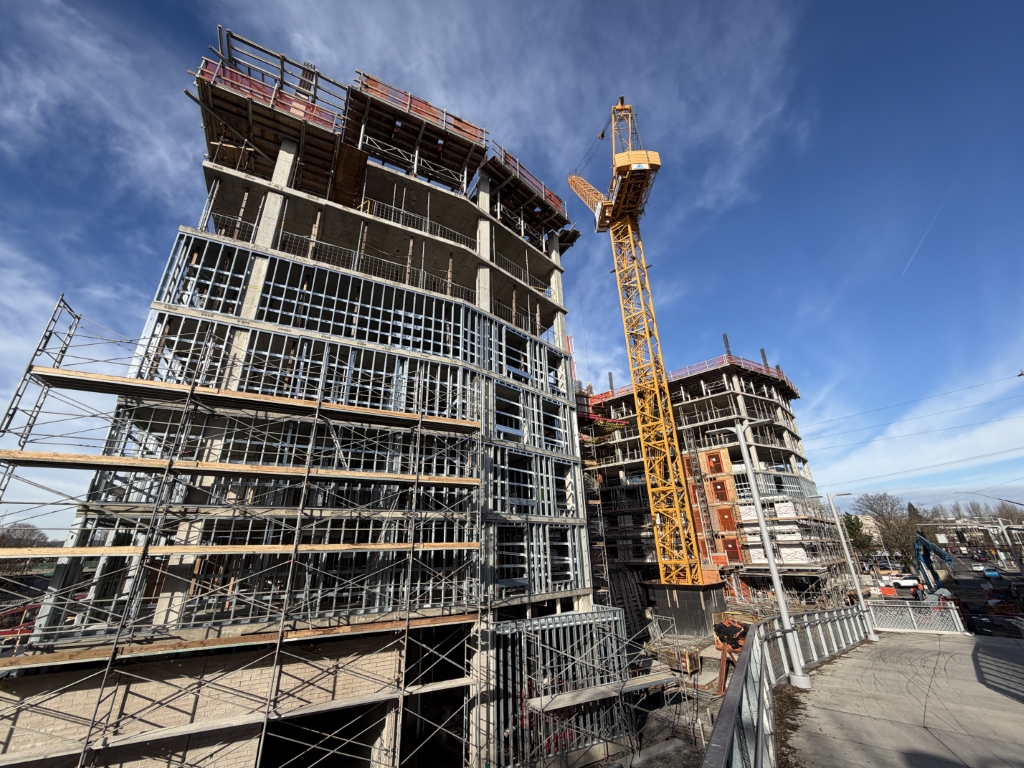
Wide view of hollywoodHUB construction at the Hollywood Transit Center, Northeast Portland – January 12, 2026. The full 12-story footprint and crane operations are visible on TriMet-owned land adjacent to the MAX station. Photo: Abdur Abdul-Malik, Portland Appraisal Blog (CC BY-SA 4.0)
If you’ve driven I-84 through Northeast Portland in recent months, you’ve almost certainly noticed the new 12-story tower rising directly above the Hollywood Transit Center. From the freeway, it’s impossible to miss—cranes swinging, floors stacking, the structure already reshaping the skyline. But what exactly is being built there?
The answer is hollywoodHUB, a 224-unit (222 regulated affordable + 2 manager) transit-oriented development that will deliver one of the largest blocks of permanently affordable family-sized housing in recent Portland history—including 32 three-bedroom apartments in a building designed for dignity, not just density.
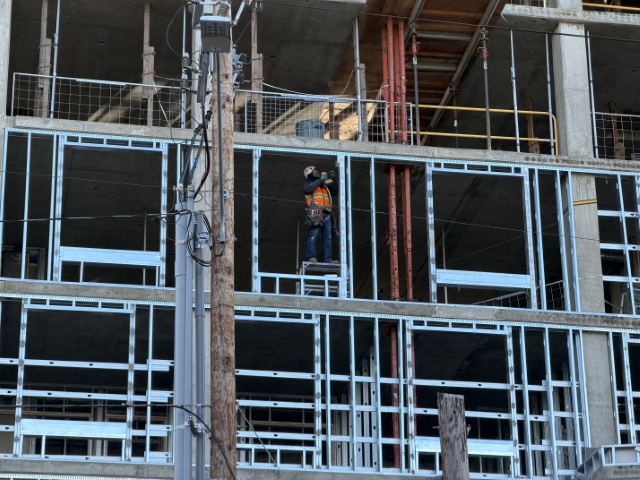
hollywoodHUB under construction at the Hollywood Transit Center, Northeast Portland – January 12, 2026. The 12-story structure towers over NE Halsey Street, with the crane lifting materials as work continues on TriMet land. Photo: Abdur Abdul-Malik, Portland Appraisal Blog (CC BY-SA 4.0)Construction worker drills steel framing on an upper level of hollywoodHUB at the Hollywood Transit Center, Northeast Portland – January 12, 2026. Skilled tradespeople drive the daily progress of the 12-story affordable housing project, set for completion in Spring 2027. Photo: Abdur Abdul-Malik, Portland Appraisal Blog (CC BY-SA 4.0)
Project Overview
hollywoodHUB is a 12-story building at 4110 NE Halsey St., directly integrated with the Hollywood Transit Center (MAX Red, Blue, and Green lines + multiple bus routes). Developed by BRIDGE Housing in partnership with TriMet (which owns the land via ground lease), the project broke ground in January 2025 and is targeted for completion in Spring 2027.
Total development cost is approximately $152 million—one of the largest single affordable housing investments by the Portland Housing Bureau (PHB) to date. PHB is contributing $45.4 million (from the 2016 Housing Bond and HOME-ARP funds), with additional support from Metro 2018 bond funds, Portland Clean Energy Community Benefits Fund (PCEF) grants for energy-efficient features (mini-splits, above-code insulation, EV charging), and $71.5 million in innovative tax-exempt bonds (a first for a nonprofit developer in this structure).
Unit mix (222 regulated affordable units):
43 studios
53 one-bedroom
94 two-bedroom
32 three-bedroom
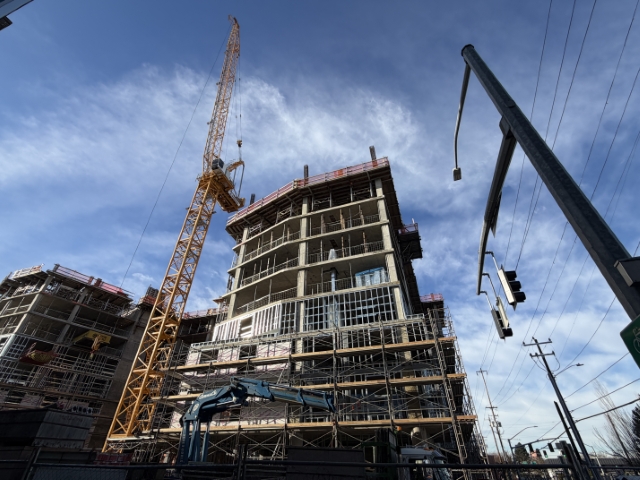
Low-angle view of hollywoodHUB’s rising facade at the Hollywood Transit Center – January 12, 2026. The curved corner and 12-story height highlight the project’s density and modern design. Photo: Abdur Abdul-Malik, Portland Appraisal Blog (CC BY-SA 4.0)
The number of two-bedroom units and three-bedroom units total 126; making “family-sized” units ~57% of the building. The emphasis on family-sized units—particularly the 32 three-bedroom apartments—is a standout feature. Three-bedroom apartments in new affordable housing are rare in Portland; most projects skew heavily toward studios and one-bedroom units, with two-bedroom sometimes reaching 20–30% and three-bedroom typically under 10%. hollywoodHUB delivers a meaningful block of larger units in a high-opportunity, transit-superior node.
Amenities and services include:
Onsite resident services by Impact NW
Indoor play area, teen lounge, community rooms
Courtyard/paseo, bike storage
Energy-efficient systems (PCEF-funded)
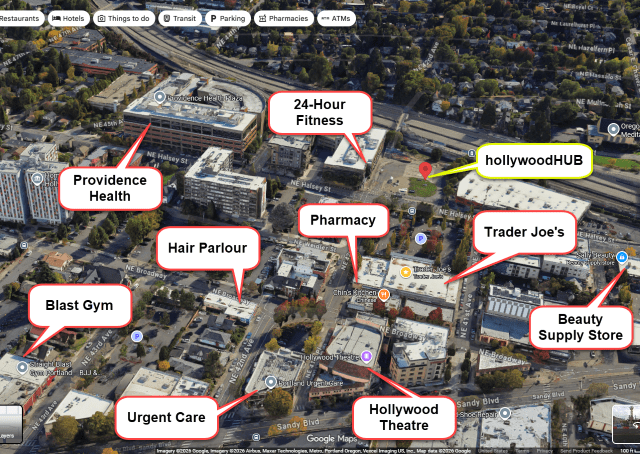
The location is a true walkability/transit paradise: no car needed. Trader Joe’s is directly across NE Halsey Street. 24 Hour Fitness is adjacent. Providence Portland Medical Center, Hollywood Library, Hollywood Theatre, Grant Park, schools, senior center, and restaurants/shops along Sandy Blvd are all within a 5–10 minute walk. Direct MAX and bus access connect to the entire metro.
The project provides no resident parking (only 9 spaces for staff and service vehicles), a deliberate design choice for transit-oriented development on public land. For any residents who retain car ownership, parking will likely require walking blocks away—Trader Joe’s small surface lot is frequently full during the day, and street parking near the transit center is limited and often restricted. While many households at 30–60% AMI are expected to be car-light or car-free, any higher-than-anticipated car retention could place modest additional pressure on nearby residential streets, many of which are already covered by Residential Parking Permit zones.
Aerial view of the hollywoodHUB construction site at the Hollywood Transit Center, Northeast Portland (January 2026). The building is steps from MAX lines, directly across from Trader Joe’s and 24 Hour Fitness, and within a 5–10 minute walk of Providence Health, the Hollywood Library, Hollywood Theatre, Grant Park, and other amenities. This transit-superior location enables true car-free living for residents. Via Google MapsThe existing Hollywood MAX station platform (Red, Blue, Green lines) directly adjacent to the hollywoodHUB site – January 12, 2026. The project’s location steps from high-frequency transit underscores its transit-oriented design. Photo: Abdur Abdul-Malik, Portland Appraisal Blog (CC BY-SA 4.0)
Appraisal Implications
hollywoodHUB is a classic special-purpose, restricted-use property. Valued primarily via the income capitalization approach, it uses income-based rents (capped at ~28.5–30% of tenant income), high occupancy from waiting lists/subsidies, and cap rates adjusted downward from market-rate multifamily for lower risk and volatility.
Comparable sales are limited to other Low-Income Housing Tax Credit (LIHTC) / regulated affordable projects (scarce in Northeast Portland). Market-rate comps require deep discounts for functional and economic obsolescence from long-term affordability covenants (30–99 years), subsidy dependence, and limited buyer pool.
Appraisals are required (Oregon Housing and Community Services (OHCS) for LIHTC, bond underwriters) but focus on restricted/investment value to the developer/investor, not open-market hypothetical. Highest and best use for the TriMet-owned site is clearly regulated affordable transit-oriented development (TOD)—subsidies and public land enable 12-story scale that private market assembly would struggle to achieve.
Land value escalation (assessor data from Portland Maps) reflects redevelopment premium: $2.01M in 2023 → $5.25M in 2025, even pre-construction.
Neighborhood Market Context
The immediate Hollywood neighborhood has very limited recent sales of detached 2–3BR homes (only 14 over the period)—a very low number that reflects limited detached housing stock in the transit-hub area. To provide a meaningful local picture, the analysis incorporates the immediately adjacent neighborhoods of Rose City Park and Grant Park, which share the same transit access, walkability, and overall market profile.
Detached 2–3BR Homes – Combined Hollywood Node
Neigh / Group
Avg Close Price
Avg PABAI (60% AMI)
Avg Total SF
# of Sales
Avg Beds
Rose City Park
$610,181
47.04
2,023
284
2.68
Grant Park
$785,177
36.35
2,382
91
2.82
Hollywood
$573,852
46.33
2,232
14
2.79
Combined
$649,811
44.51
2,114
389
2.72
Data from RMLS pivot (last four years), limited to detached homes with 2 or 3 bedrooms. Hollywood had only 14 sales; adjacent areas provide context. Avg Total SF includes basements (avg 669 sq ft across the node). PABAI uses Fiscal Year (FY) 2025 HUD AMI at 60% ($74,460 for 4-person household, effective April 1, 2025), matching hollywoodHUB’s upper cap.
The Portland Appraisal Blog Affordability Index (PABAI) measures how the average close price compares to what a household at a given income level can qualify for under standard lending assumptions (e.g., 20% down payment, 28% debt-to-income ratio for principal, interest, taxes, and insurance). A PABAI of 100 means the market is exactly affordable at that income level. Values above 100 indicate excess qualifying capacity (more affordable), while values below 100 indicate a shortfall (strained affordability). For full methodology and the interpretation scale, see the PABAI explainer page.
PABAI Range
Interpretation
120+
Strongly Affordable
100–119
Moderately Affordable
80–99
Strained
Below 80
Severely Constrained
The combined PABAI of 74.19 at 100% AMI ($124,100 median family income) indicates a shortfall—even median-income households would require roughly $167,000 annual income to qualify for the average $649,811 home. At 60% AMI ($74,460, hollywoodHUB’s upper cap), PABAI drops to 44.51—typical qualification falls to less than half the average price. Of the 389 sales, only 36 (~9.3%) had PABAI ≥ 100 (excess capacity at 100% AMI); at 60% AMI, that drops to just 2.
While condominiums exist as a smaller-share ownership option in the area, the three-neighborhood node has little condominium inventory and detached homes remain the dominant preference for family-sized living.
What $37,250 Really Means—and How hollywoodHUB Changes It
The 71 units at or below 30% AMI target households earning no more than approximately $37,250 annually for a family of four (FY 2025 HUD Portland MSA figure). The 2025 federal poverty guideline for a family of four is $32,150. These families are living just above the poverty line in one of the country’s higher-cost metros.
After essential non-housing expenses—food, childcare, transportation, healthcare, utilities—very little remains for rent. A sustainable 30% burden leaves roughly $900–$1,000 per month total (rent + utilities). Market-rate 2–3BR apartments in Northeast Portland often exceed $2,000–$3,000/month, and detached homes average $4,207/month in PITI costs.
The result is often overcrowding, instability, and loss of dignity: multiple families or unrelated adults sharing small units, children without private bedrooms, constant moves to avoid eviction, skipped medical care or school activities to make rent. Privacy, quiet study space, and a sense of home become luxuries.
hollywoodHUB changes that equation. This is not shoddy or bare-bones housing. The 12-story building by Holst Architecture features energy-efficient design (PCEF-funded), modern finishes, onsite resident services through Impact NW, indoor play areas, teen lounge, courtyard, bike storage—and direct integration with the Hollywood MAX station.
Most powerfully, families in these units will live across the street from Trader Joe’s and a 24 Hour Fitness, steps from the MAX Red/Blue/Green lines, blocks from Providence Hospital, the Hollywood Library, and the historic Hollywood Theatre. For a family earning $37,250, this level of access—to fresh groceries, fitness, healthcare, education, culture, and transit—is nearly incomprehensible in Portland’s current market.
The 32 three-bedroom units (plus 94 two-bedroom) provide real space—likely 1,000–1,300 sq ft, private bedrooms, separate living/kitchen areas—at rents families can actually pay. This isn’t just shelter; it’s the restoration of dignity, stability, and opportunity for larger families who have been priced out of the city they call home.
24 Hour Fitness directly across the hollywoodHUB construction site – January 12, 2026. This major amenity, along with Trader Joe’s and other nearby services, exemplifies the opportunity-rich environment for residents. Photo: Abdur Abdul-Malik, Portland Appraisal BlogThe historic Hollywood Theatre (1926), just a short walk from hollywoodHUB along NE Sandy Blvd – January 12, 2026. This landmark cultural hub adds to the walkable, amenity-rich environment for residents. Photo: Abdur Abdul-Malik, Portland Appraisal Blog (CC BY-SA 4.0) The Hollywood Library, a central community resource just a short walk from hollywoodHUB – January 12, 2026. This modern branch offers books, programs, and gathering spaces for residents and families. Photo: Abdur Abdul-Malik, Portland Appraisal Blog (CC BY-SA 4.0)
Income Restrictions, Rent Mechanics, & Broader Implications
hollywoodHUB caps all 222 regulated units at 60% AMI ($74,460 for a 4-person household), with 71 units at ≤30% AMI ( $37,250). Rents are income-based (~28.5–30% of adjusted gross income + utilities allowance). A family of four at 30% AMI pays roughly $900–$1,000/month total.
The 55 units with Project-Based Section 8 vouchers (PBV) are especially significant. These federal subsidies are tied directly to the units—the Portland Housing Authority pays most of the rent directly to BRIDGE Housing, allowing families with very low or no income to live there while paying only ~28.5–30% of their adjusted gross income. This removes the risk of rent burden exceeding income and ensures stability even for the most vulnerable households. Other units may qualify for additional supports (e.g., state LIFT program, PHB incentives), but PBV is the backbone for the deepest affordability tier.
The generous public investment—including $45.4 million from the Portland Housing Bureau—funds high-quality construction, energy-efficient systems, and resident services that create a stable, dignified home environment for families who would otherwise face overcrowding or displacement.
Takeaway
hollywoodHUB is one of several significant affordable housing projects currently under construction or recently completed in the Portland Region as the city works to counter the inherent unaffordability of traditional detached homeownership for moderate- and lower-income households.
Even at the full area median income of $124,100 (FY 2025, 4-person household), the average detached 2–3BR home in the Hollywood node requires roughly $167,000 in annual income to qualify—well beyond what most families can sustain. At 60% AMI ($74,460, hollywoodHUB’s upper cap), the gap widens dramatically (PABAI 44.51), and at 30% AMI ($37,250), market ownership is simply out of reach.
Projects like hollywoodHUB, with its 126 family-sized units (including 32 three-bedroom apartments), layered subsidies, and transit-superior location, represent a deliberate policy response to this reality. Similar efforts include:
The Julia West House supportive housing tower, which recently opened to provide deeply affordable units with onsite services.
The Alberta Alive townhomes, rising opposite the historic Alberta Abbey as infill in a culturally rich corridor.
The Barbur Apartments groundbreaking, which highlighted plottage value in redevelopment along a key transit corridor.
These initiatives—while different in scale, target population, and financing—share a common thread: using public or acquired land, incentives, and creative partnerships to deliver housing that the private market alone cannot produce at accessible price points. As more projects come online, they will continue to reshape affordability, highest and best use assumptions, and neighborhood stability in the Portland metro area.
Thanks for reading—I hope you found a useful insight or an unexpected nugget along the way. If you enjoyed the post, please consider subscribing for future updates.
CODA
Are you an agent in Portland who wonders why appraisers always do “x”?
A homeowner with questions about appraiser methodology?
If so, feel free to reach out—I enjoy connecting with market participants across Portland and the surrounding counties, and am always happy to help where I can.
And if you’re in need of appraisal services in Portland or anywhere in the Portland Region, we’d be glad to assist.
Mandatory valuation bias & fair housing training is now required for all appraisers as of January 1, 2026. Quick breakdown of the AQB’s 7-hour CE requirement (4-hour refreshers after), plus the recent scrutiny and mixed outcomes driving it. Most appraisers deliver fair, data-driven valuations daily—this reinforces transparency and trust.
Are you an agent in Portland who wonders why appraisers always do “x”?
A homeowner with questions about appraiser methodology?
If so, feel free to reach out—I enjoy connecting with market participants across Portland and the surrounding counties, and am always happy to help where I can.
And if you’re in need of appraisal services in Portland or anywhere in the Portland Region, we’d be glad to assist.


.jpg)
.jpg)
.jpg)