A recent city review found that Portland has accumulated approximately $21 million in rental-registry fees that were designated to support emergency rental assistance and eviction-prevention programs. During the period in which these funds remained unused, landlords in Multnomah County filed an estimated 800 to 1,200 eviction cases per month, though not all filings result in an eviction order.
The rental-registry program requires landlords to pay fees and register units, with the revenue earmarked specifically for tenant-support programs. Poor tracking and administrative delays left the money unspent, even as demand for rental aid remained elevated across the Portland metro area.
Leadership Change and Severance Package
The discovery coincided with the resignation of Portland Housing Bureau Director Helmi Hisserich. Following paid administrative leave, Hisserich received a severance package equal to her full annual salary of approximately $241,000. The city continues to examine how the funds went unused for an extended period.
Appraisal Implications in the Portland Region
Residential Properties (1–4 Units)
The unspent funds have no immediate direct effect on comparable sales selection or adjustment grids for typical single-family or small-multifamily appraisals in the Portland metro area. Broader affordability pressure and eviction volume remain relevant market-condition factors, but no abrupt shift in residential values is likely from this development alone.
Commercial Multifamily and Investor-Owned Properties
If the $21 million is successfully redeployed for rental assistance and eviction defense, occupancy stability in larger apartment properties (5+ units) could improve. Lower economic vacancy risk and reduced turnover expense represent positive influences on net operating income, which in turn support lower capitalization rates and higher valuations for income-producing assets across the region.
Appraisers working on commercial assignments in Multnomah County should monitor city council actions regarding reallocation of these funds in the coming weeks to months.
Homeowners, lenders, realtors, estate planners, and attorneys relying on accurate valuation of investment-grade multifamily residential properties will benefit from understanding how policy execution—or delays—can influence income metrics and risk adjustments in appraisal reports.
Thanks for reading—I hope you found a useful insight or an unexpected nugget along the way. If you enjoyed the post, please consider subscribing for future updates.
Question: Do you think the $21 million will be disbursed soon, or will it take months before the funds can be used for rental assistance?
CODA
Are you an agent in Portland and wonder why appraisers always do “x”?
A homeowner with questions about income-producing properties?
If so, feel free to reach out—I enjoy connecting with market participants across Portland and the surrounding counties, and am always happy to help where I can.
And if you’re in need of appraisal services in Portland or anywhere in the Portland Region, we’d be glad to assist.
Appraisers don’t create the market—we measure it. Much like reporting the weather, our role is to analyze conditions, not control them. Oregon’s new 7‑hour anti‑bias CE requirement reinforces accountability, ensuring appraisal reports remain fair, transparent, and free from unintended influences.
Starting January 1, 2026, every licensed appraiser in Oregon must complete a 7‑hour course on Valuation Bias and Fair Housing Laws and Regulations, followed by at least 4 hours every subsequent two‑year renewal cycle. The mandate (OAR 161‑010‑0010, amended July 2025) does not increase total continuing education hours—Oregon still requires 28 hours per cycle—but carves out dedicated time for bias and fair‑housing training.
The goal is straightforward: strengthen appraisers’ ability to recognize and eliminate unconscious bias in comparable selection, adjustments, and reporting. For homeowners, realtors, attorneys, and lenders in the Portland metro, this means clearer documentation in appraisal reports, making it easier to understand and challenge valuation decisions.
Why This Training Matters for Everyday Appraisals
Bias most often shows up in the judgment calls appraisers make every day—choosing which sales to include or exclude, deciding whether an adjustment is warranted, or how large it should be.
Under USPAP, appraisers are not required to make any specific adjustment. What USPAP does require is that the analysis be credible, adequately supported, clearly explained, and never misleading. It also explicitly prohibits bias of any kind.
This new training reinforces those obligations with practical tools and case studies, so reports become even more transparent and defensible.
Practical Takeaways for Homeowners, Realtors, and Lenders
Expect slightly longer, more detailed appraisal reports starting in 2026—especially around comparable selection and adjustment rationale.
Over‑improved properties (e.g., high‑end renovations in modest subdivisions) will still be adjusted to market evidence, but the reasoning will be spelled out more explicitly.
Rebuttals and reconsideration of value requests should become easier to evaluate because the appraiser’s decision path will be clearer.
Appraisers don’t set market value—we measure it. Clearer documentation simply helps everyone see the measurement process more accurately.
Addressing Common Challenges
One frequent point of tension arises with over‑improved properties. Homeowners may expect comps from upscale areas, but market evidence must guide adjustments. Recent lawsuits have spotlighted these disconnects between owner expectations and data‑driven conclusions, underscoring the need for explicit explanations.
The training won’t alter core appraisal standards, but it will equip appraisers to better articulate their rationale, strengthening rebuttal packages and fostering trust.
The Bigger Picture for Portland Metro Professionals
Again, appraisers don’t create the market—we report it. We are a lot like Al Roker, who reports the weather, not make it! This new requirement promotes accountability, ensuring reports are fair, accurate, and free from unintended influences.
In a region like the Portland metro, where diverse neighborhoods drive varied valuation dynamics, clearer processes benefit everyone involved in transactions. For those who’ve navigated over‑improvement appraisals, the added transparency could smooth future interactions. Sharing experiences helps refine practices across the industry.
For current market context on inventory and pricing trends affecting comp selection in the Portland region, see our Q3 2025 Market Update.
Thanks for reading—I hope you found a useful insight or an unexpected nugget along the way. If you enjoyed the post, please consider subscribing for future updates.
Question: Do you think the new training requirement will have a material impact on valuation disputes?
CODA
Are you an agent in Portland and wonder why appraisers always do “x”?
A homeowner with questions about appraisal contingencies, comp selection, or reconsiderations of value?
If so, feel free to reach out—I enjoy connecting with market participants across Portland and the surrounding counties, and am always happy to help where I can.
And if you’re in need of appraisal services in Portland or anywhere in the Portland Region, we’d be glad to assist.
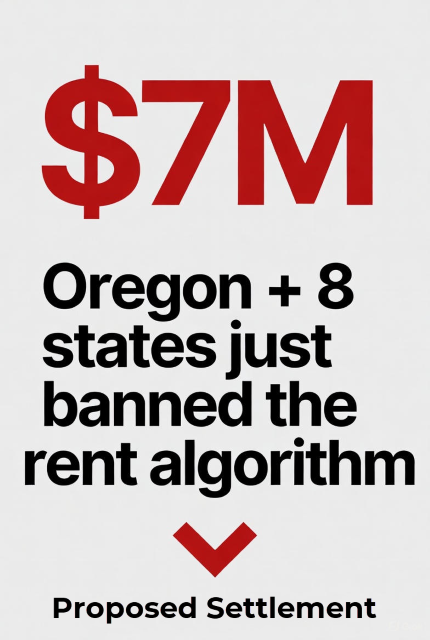
Oregon and eight other states filed a proposed $7M settlement with Greystar, affecting ~19,000 Portland apartments. Appraisers and buyers are watching for 2026 rent softening and cap rate shifts.
A coalition of nine states led by Oregon and California has filed a proposed $7 million settlement with Greystar Management Services — the nation’s largest rental housing operator — over allegations that Greystar used RealPage software to illegally coordinate rent pricing across competing properties.
The settlement, if approved by a federal court, would permanently bar Greystar from sharing non-public rent and occupancy data with competitors and from using RealPage’s hyper-local pricing recommendations. A separate DOJ consent decree filed against RealPage itself imposes similar behavioral restrictions and a three-year independent monitor.
Greystar manages approximately 19,000 apartment units in the Portland metro area — roughly 10 % of the region’s multifamily inventory. State investigators have estimated that RealPage-enabled pricing affected roughly one in five multifamily units statewide.
For homeowners, buyers, agents, and lenders, the most immediate question is whether these enforcement actions will translate into meaningful rent relief in 2026 and beyond.
The Direct Impact on Purchasing Power
A renter currently paying a $200 “algorithm premium” (the difference between market rent and coordinated rent loses $2,400 annually that could otherwise go toward a down payment.
Even a modest 5–8 % softening in rents after these settlements would return $110–$176 per month to the typical household, equating to $4,000–$10,600 in additional savings over three to five years.
What Appraisers Are Watching in 2026
Cap rate movement on institutional-grade (50+ unit) apartment buildings
Total scheduled gross revenue trends at properties previously managed with revenue-management software
If rents soften and risk premiums rise, cap rates will widen first on larger assets. That pressure eventually flows through to gross rent multipliers (GRMs) on 1–4 unit residential income properties — either compressing GRMs if sale prices adjust faster than rents, or temporarily expanding them if prices lag.
We likely won’t see clear signals until mid-2026, but the direction of travel will matter for every appraisal involving the income approach in the region.
Bottom Line
Combined with new multifamily supply now entering the pipeline, these twin enforcement actions represent the strongest downward pressure on algorithmic rent growth Portland has seen since the pandemic began.
Sources & Further Reading
Beaverton Valley Times coverage of the Greystar settlement
For broader quarterly context on inventory, pricing, and market segmentation trends in the Portland region, see our most recent Q3 2025 Market Update.
Thanks for reading—I hope you found a useful insight or an unexpected nugget along the way. If you enjoyed the post, please consider subscribing for future updates.
Question: Do you think we’ll see any meaningful slowdown in rent increases in the Portland area?
CODA
Are you an agent in Portland and wonder why appraisers always do “x”?
A homeowner with questions about appraisal contingencies, GRMs, or valuation delays?
If so, feel free to reach out—I enjoy connecting with market participants across Portland and the surrounding counties, and am always happy to help where I can.
And if you’re in need of appraisal services in Portland or anywhere in the Portland Region, we’d be glad to assist.
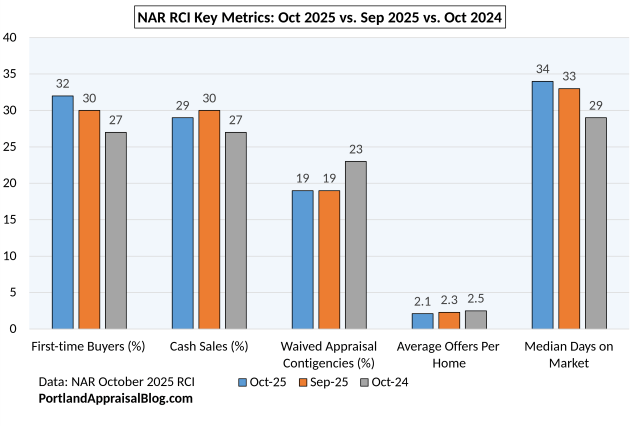
NAR October 2025 RCI: First-time buyers at 32%, DOM at 34 days, and 19% waived appraisals in Portland metro. Insights for realtors and homeowners on comp stability and market shifts.
The National Association of REALTORS® (NAR) has released its October 2025 REALTORS® Confidence Index (RCI), revealing a market with subtle shifts that Portland metro real estate professionals should monitor closely. First-time buyers climbed to 32% of transactions, supported by growing inventory and modestly lower rates, though overall confidence dipped—with only 17% of REALTORS® expecting year-over-year buyer traffic increases in the next three months, and 16% for sellers. Cash sales remained steady at 29%, while homes received an average of 2.1 offers, and 19% sold above list price.
For appraisers in the Portland area, these trends suggest more stable comparable sales (comps), but they also highlight persistent risks from contingencies, with 19% of buyers waiving appraisals and 6% of delayed settlements linked to valuation issues. This creates opportunities for thorough, defensible reports that address local market segmentation.
The RCI: A National Pulse with Local Relevance
The RCI draws from a survey of approximately 1,800 REALTORS® conducted November 1–16, 2025, focusing on buyer and seller activity, financing, contingencies, and sentiment. Unlike local MLS data such as RMLS, which tracks completed transactions, the RCI captures forward-looking expectations. In the Portland metro, including Vancouver, WA, combining these insights ensures appraisals reflect both anticipated trends and on-the-ground realities, particularly in cross-border markets.
Key Market Indicators Shaping Appraisals
October’s data points to a gradual easing:
Median Days on Market (DOM): 34 days (up from 33 in September 2025 and 29 in October 2024).
First-Time Buyers: 32% of transactions (up from 30% in September 2025 and 27% in October 2024), signaling stronger entry-level demand.
Cash Sales: 29% (down slightly from 30% in September 2025, up from 27% in October 2024).
Distressed Sales: 2% (unchanged from prior months).
While days on market are up year over year, the time homes are spending on market is not excessive. There is a bit more time for negotiations. I go into detail about rising days on market in my Portland Region Q3 2025 Market Update.
Buyer Shifts and Contingency Considerations
Buyers are navigating a slightly less competitive landscape, which influences appraisal timelines and risks:
20% waived inspection contingencies (flat from September 2025).
19% waived appraisal contingencies (flat from September 2025, down from 23% in October 2024)—a trend that eases renegotiation pressures for Portland appraisers.
5% completed purchases via virtual tours only (unchanged).
82% of purchases occurred in suburban, small town, rural, or resort areas (down from 87% in September 2025).
In Multnomah County and Vancouver, WA, this suburban preference reshapes comp pools, emphasizing the need for carefully defined competitive areas—location matters!
Seller Dynamics: Fewer Offers, More Scrutiny
Sellers are adjusting to softer demand, with implications for pricing and close processes:
Average offers per home: 2.1 (down from 2.3 in September 2025 and 2.5 in October 2024).
19% sold above list price (down from 21% in September 2025, flat from October 2024).
2% sold to iBuyers (up from 1% in September 2025).
Median time to close: 30 days (unchanged).
7% of contracts terminated (up from 6% in September 2025).
14% experienced delayed settlements (unchanged).
For realtors and lenders in the Portland metro, rising terminations underscore the importance of appraisals backed by solid, verifiable comps. As I detailed in my Portland Region Q3 2025 Market Update, the sales price to original list price ratio has been declining.
Outlook: Tempered Optimism and Suburban Focus
REALTOR® confidence softened amid these changes:
17% anticipate buyer traffic growth year over year in the next three months (down from 20% in September 2025).
16% expect seller traffic increases (down from 19% in September 2025).
29% of buyers prioritized work-from-home features (down from 34% in September 2025).
This aligns with the Portland Region’s ongoing suburban migration, impacting comp selection in Clackamas and Washington Counties. Homeowners and attorneys preparing for transactions should carefully read reports to verify they incorporate these broader sentiment shifts.
Implications for Portland Metro Valuations
The RCI’s blend of buyer gains and fading enthusiasm points to a transitional market: enhanced first-time activity promotes equitable pricing, but elevated terminations (7%) reveal gaps in expectations. For further details, explore the full report here, the main RCI page, or the existing-home sales tie-in. See also my Portland Region Q3 2025 Market Update.
Thanks for reading—I hope you found a useful insight or an unexpected nugget along the way. If you enjoyed the post, please consider subscribing for future updates.
Question: Do you think lower mortgage rates will propel the market to new heights?
CODA
Are you an agent in Portland or Clackamas County and wonder why appraisers always do “x”?
A homeowner in Lake Oswego with questions about appraisal contingencies or valuation delays?
If so, feel free to reach out—I enjoy connecting with market participants across Portland and the surrounding counties, and am always happy to help where I can.
And if you’re in need of appraisal services in Portland or Clackamas County, we’d be glad to assist.
Manufactured homes on owned land in the Portland Region posted modest gains in 2024 amid tight supply. This review covers sales volume, pricing adjustments, and key valuation factors unique to this segment.
We are wrapping up our annual reviews of the various housing segments in the Portland, Oregon region with a consideration of manufactured homes. We will restrict our attention to manufactured homes permanently affixed to land that is also owned by the same party. This means we are excluding classic mobile home parks where the owner of the mobile home must pay a lease/lot rental fee.
If you missed the previous annual reviews covering single-family detached homes, condominiums, and attached homes, you may click this link.
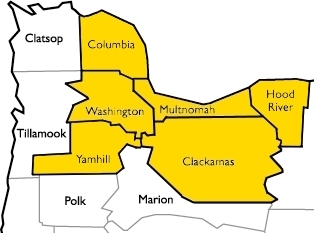
Let’s define the Portland Region as the following six counties: Columbia, Clackamas, Hood River, Multnomah, Washington, and Yamhill—essentially all counties contiguous with Portland’s home county of Multnomah, plus Yamhill.
DATA HOUSEKEEPING
The information in this post will be based on properties that sold on the open market, defined as listed in RMLS, the primary multiple listing service for the Portland Region. The data was parsed with tools created by the blog author to weed out/correct, among other things, listing errors and misclassifications (e.g. manufactured homes hiding in other categories, such as the detached category). RMLS has a listing category, SNL, Sold Not Listed, that allows agents to put properties that were sold off market into the database. Those properties have been excluded from the following analyses.
The U.S. Department of Housing and Urban Development provides the following definition and conditions for FHA mortgage insurance:
Manufactured Housing is a Structure that is transportable in one or more sections.
To be eligible for FHA mortgage insurance as a Single Family Title II Mortgage, all Manufactured Housing must: • be designed as a one-family dwelling; • have a floor area of not less than 400 square feet; • have the HUD Certification Label affixed or have obtained a letter of label verification issued on behalf of HUD, evidencing the house was constructed on or after June 15, 1976, in compliance with the Federal Manufactured Home Construction and Safety Standards; • be classified as real estate (but need not be treated as real estate for purposes of state taxation); • be built and remain on a permanent chassis; • be designed to be used as a dwelling with a permanent foundation built in accordance with the Permanent Foundations Guide for Manufactured Housing (PFGMH); and • have been directly transported from the manufacturer or the dealership to the site.
The definition comes from the HUD manual (4000.1) and helps to differentiate manufactured homes from other type of prefabricated housing, such as modular homes or tiny homes. Fannie Mae essentially follows the HUD definition. Once a manufactured home is brought to the site, they state in their Selling Guide:
The towing hitch, wheels, and axles must be removed. The dwelling must assume the characteristics of site-built housing.
The manufactured home must be attached to a permanent foundation system in accordance with the manufacturer’s requirements for anchoring, support, stability, and maintenance.
The foundation system must be appropriate for the soil conditions for the site and meet local and state codes.
The manufactured home must be permanently connected to a septic tank or sewage system, and to other utilities in accordance with local and state requirements.
Manufactured homes are built in a factory and must meet the minimum guidelines established by HUD. While modular homes are also built in a factory in sections, they are not meant to movable beyond the initial transportation from the factory and have their final construction and assembly at the site and are placed on a permanent foundation. Modular homes have more stringent guidelines and building codes and are more expensive as a result.
Tiny homes, are just that, tiny. They usually don’t meet the minimum square footage requirements for manufactured homes and are often left in a transportable state; that is, they are relatively easy to move to another location. (Not a plus for collateral underwriting.) While there may be state or local ordinances, there are no federal guidelines for them and they are generally considered personal property. Getting them financed through typical mortgage channels is very difficult to nigh impossible.
So, to recap: we consider manufactured homes to be factory-built one-family dwellings that meet HUD guidelines and are permanently affixed to the land and the land must be under the same ownership. To be eligible for general financing, the manufactured home must have been built on or after June 15, 1976. The RMLS database does have a few properties in the manufactured category that were constructed before the cutoff date; those properties, while not meeting the modern requirements for manufactured housing, have been left in the dataset. Often they are not financeable, but they usually convey to the buyer the right to put a replacement manufactured dwelling or single-family home. That can be important, as there are some land parcels (mostly farmland) with zoning that does not allow residential use outright and will only permit an exception dwelling if the site has had continuous residential use (grandfathering the use in). That old manufactured home on a site could make a world of difference in the property value of an acreage lot!
Okay, so that was a lengthy preamble, let’s dive into some stats!
Portland Region 2024 Manufactured Homes Overview
The following table compares 2024 with 2023:
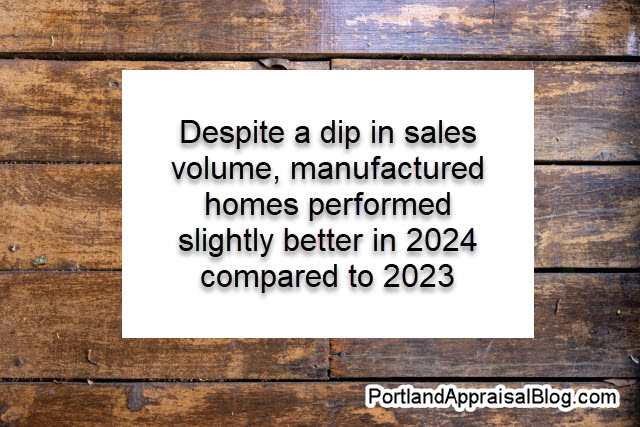
Total dollar sales volume dropped about 9% in 2024 but this is largely a function of the total number of sales declining about 11%. Looking at the composition of sales for each year, 2024 had manufactured homes nearly the same size and age as 2023, but on lots about a half acre smaller. This points to a slightly stronger year per unit sold in 2024, which is reflected in higher average prices, median prices, and price per square foot.
New construction was only 1% of the market and bank repossessions were steady each year and represented less than 3% of the market.
Let’s dive into the rest of the data with some visuals.
SALES VOLUME
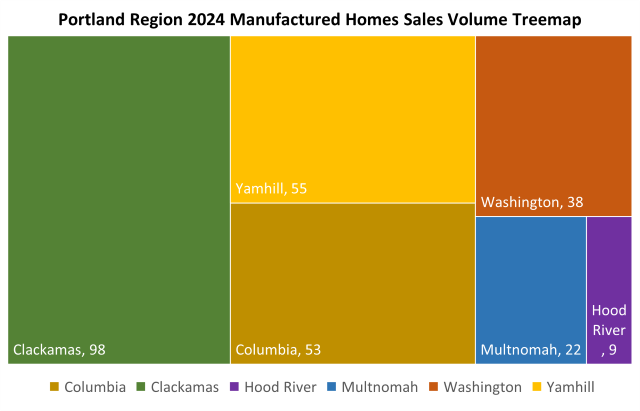
The following is a treemap of manufactured home sales volume in the Portland Region for the year 2024:
Clackamas County had almost twice as many manufactured home sales than the next largest county. This is not surprising as Clackamas County is 1,868 sq. mi. and has a lot of farming activity. The second largest county by sales volume, Yamhill, is also known for its rural areas and extensive agriculture.
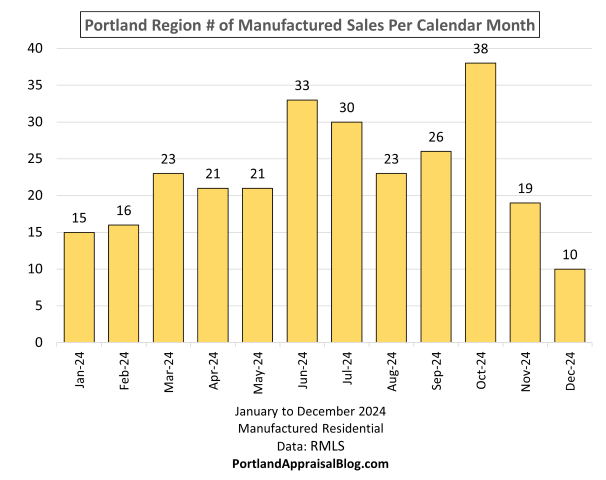
Sales followed a bell curve (with October being the exception); the market generally peaked during the summer months:
As the following graph shows, 2023 beat 2024 in sales volume eight out twelve months:
SALES PRICE
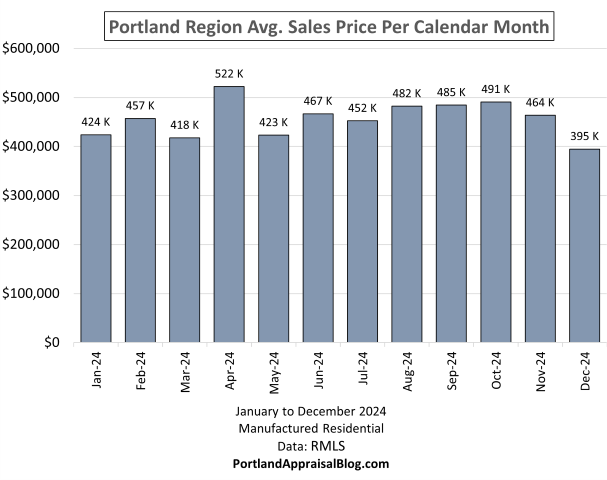
Prices were fairly level for most of the year:
2023 and 2024 were very close in average prices each month:
CUMULATIVE DAYS ON MARKET
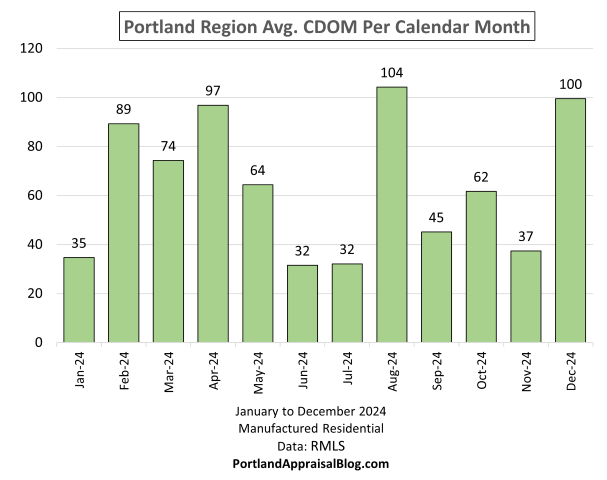
The average cumulative days on market was about two months for the entire year of 2024. Marketing time varied erratically, with no pronounced seasonality pattern:
While the average marketing time in 2024 was only up about 3 days compared to 2023, some months sharply diverged from each other. Variation like this is to be expected when the dataset is so small each year:
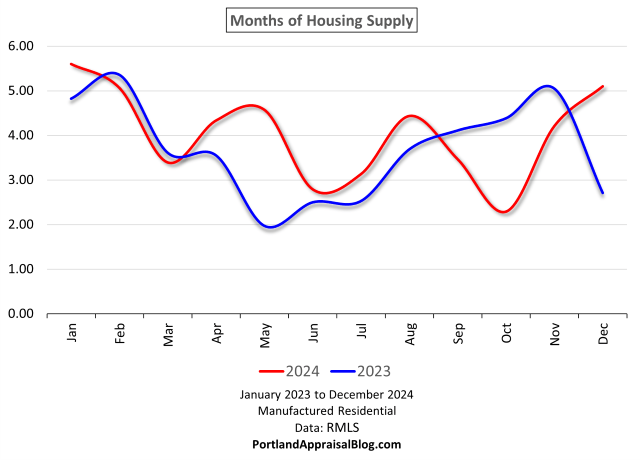
HOUSING SUPPLY
Housing supply tracks how long would it take the market to exhaust all available inventory at the current rate of absorption. For most of 2024 the months of housing supply for manufactured homes was above 4 months:
2024 was significantly above 2023 in months of housing supply during the spring and summer months, while 2023 was higher in the fall:
MISC STATS
Before concluding our overview of the Portland Region as a whole, let’s look at some miscellaneous stats:
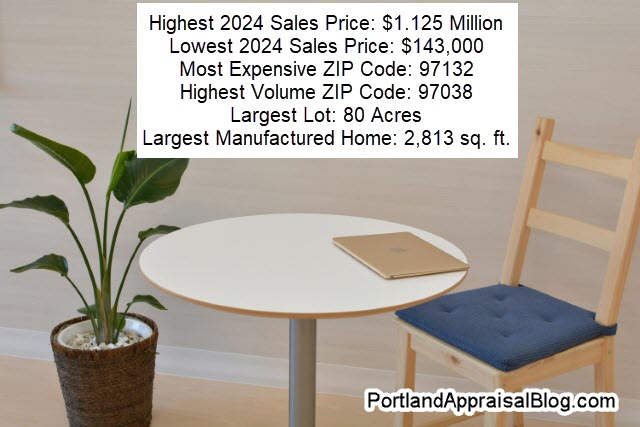
The highest price for a manufactured home in 2024 is shared by two properties. A manufactured home in Estacada, Oregon and one in Newberg, Oregon. Both closed for $1,125,000.
The home in Estacada was built in 1998, sits on 19.8 acres, and is 1,976 sq. ft. The property has outbuildings. Photos of the home are currently available online and may be viewed here.
The home in Newberg was built in 1981, has a 9.4-acre lot, and is 1,920 sq. ft. The manufactured home was in average shape. The principal component of value for this home was the dividable lot (three parcels). After the sale the manufactured home sold again in 2025, this time for only $595,000 and the lot was only 2.5 acres. Photos of the home are currently available online and may be viewed here.
The least expensive manufactured home in 2024 was a property in Clatskanie, Oregon, which is in Columbia County. The property sold for $143,000. This was an older manufactured home that predates the HUD cutoff date and therefore could not be financed and closed as a cash sale. The home sits on a 1.58-acre lot and is only 744 sq. ft. The structure looks like it is at the end of its useful life, so this was essentially a land sale. Photos of the home are currently available online and may be viewed here.
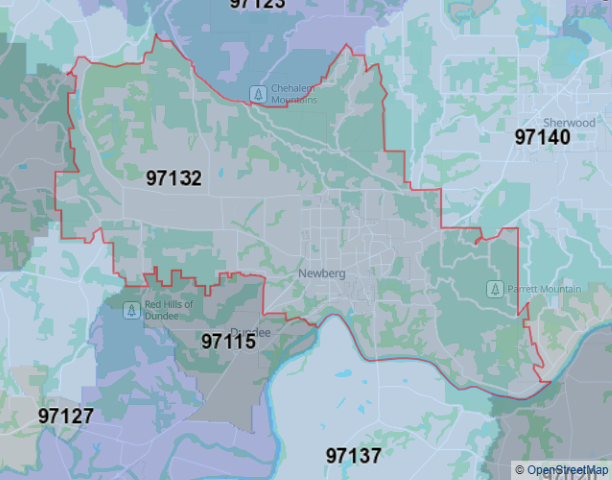
The most expensive ZIP code for manufactured homes in 2024 was 97132. This area takes in parts of Newberg. While only 4 sales occurred in 2024, the average price was about $741,000:
The ZIP code with the highest volume of sales was 97038:
This ZIP code is in Clackamas County and covers nearly 131 sq. mi. A total of 27 manufactured home sales occurred in this ZIP code in 2024.
A manufactured home in Sandy, Oregon with an 80-acre lot took the crown for the largest site in 2024. The home is a newer unit, with a manufacture date of 2021. The home is 1,836 sq. ft. and has quality interior upgrades. The site appears to be a former tree farm. While not the most expensive sale of the year, this manufactured home did rank #5 on the list! Photos of the home are currently available online and may be viewed here.
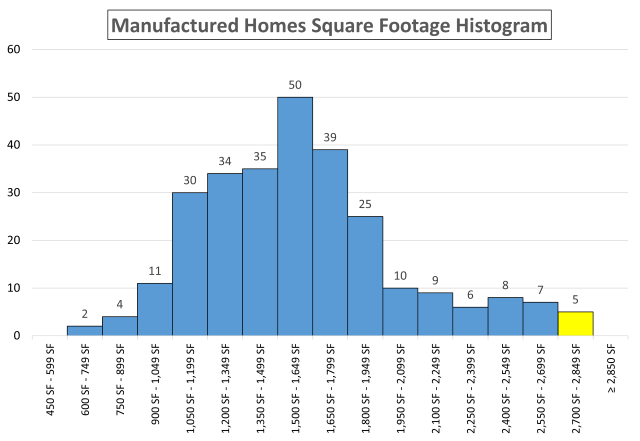
The largest manufactured home to sell in 2024 was a property in Dayton, Oregon, which is in Yamhill County. The unit was 2,813 sq. ft. and was manufactured in 2007. The home sits on a 5-acre lot. Given the average size for a manufactured home in 2024 was a little over 1,600 sq. ft., this one would be considered quite spacious. (Photos of the home are currently available online and may be viewed here.) The following histogram shows the distribution of square footage for manufactured homes in 2024:
Approximately 84% of all manufactured homes sold in 2024 are under 1,950 sq. ft.
Let’s wrap up this post with a quick look at the individual counties comprising the Portland Region.
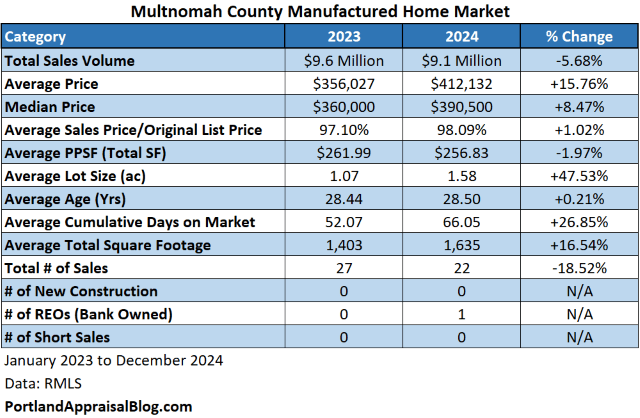
Multnomah County 2024 Stats
Multnomah County contains most of the City of Portland. A sliver of the City of Portland is located in Clackamas and Washington counties. The following table summarizes important metrics for Multnomah County:
Multnomah County saw a nearly 6% drop in the sales volume dollar amount. The total number of sales dropped almost 19%; the reason the sales volume dollar amount did not drop more is due to the average size of the units sold increasing as well as the lot size. Marketing time increased almost 27%. The new construction and distressed categories had almost no activity.
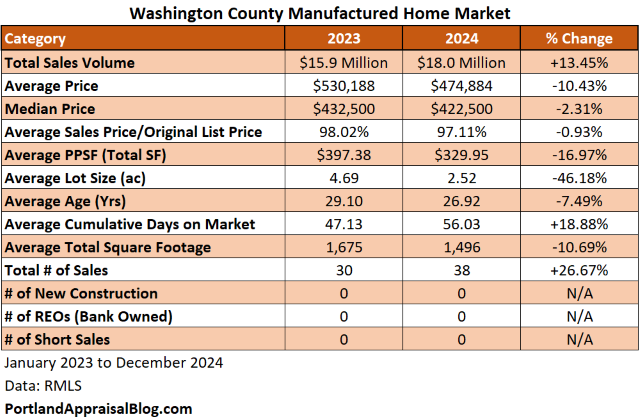
Washington County 2024 Stats
Washington County contains many properties with a Portland address that are outside official city limits and are under county control. The following table summarizes important metrics for Washington County:
The total sales volume dollar amount increased by over 13% thanks, in part, to a 27% increase in the total number of sales. The reason the sales volume dollar amount did not climb higher is due to smaller units selling on smaller lots. There were no distressed sales or new construction in 2024.
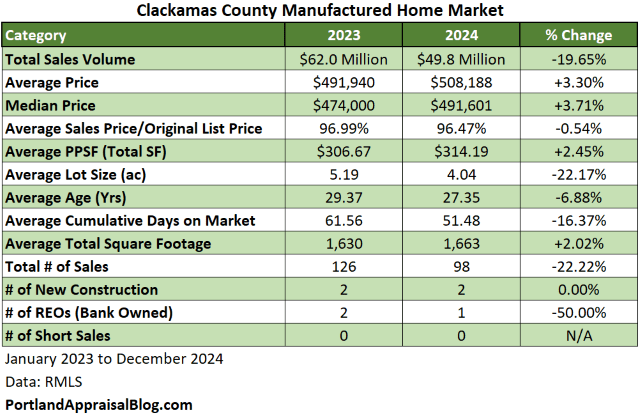
Clackamas County 2024 Stats
Clackamas County, due to being a large and mostly rural county, has the most activity for manufactured homes in the Portland Region. The following table summarizes important metrics for Clackamas County:
The Clackamas manufactured home sales volume dollar amount was down about 20% in 2024. This tracks the decrease in total sales (-22%). Average prices were slightly up, but so was the average total square footage of homes selling. The one-acre drop in average lot size does not appear to have had a substantial impact on average prices. There were two new construction units in 2024 and just one distressed sale.
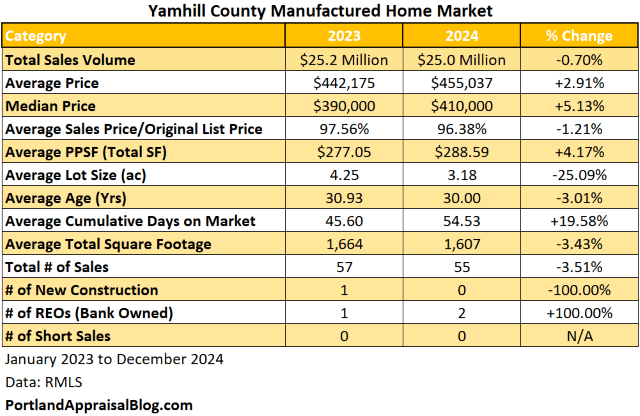
Yamhill County 2024 Stats
Yamhill County is known for its wineries and other agricultural products. Due to its rural areas, Yamhill had the second highest number of manufactured home sales. The following table summarizes important metrics for Yamhill County:
The total sales volume dollar amount was flat year over year. There was little change in the number of homes sold. Average prices rose nearly 3% despite smaller units on smaller lots for 2024. This indicates manufactured homes had a stronger year overall compared to 2023. There was no new construction activity and only a couple of distressed sales in 2024.
Columbia County 2024 Stats
This county is 688 square miles but only has a population of approximately 54,000 people. Due to it mostly rural nature, Columbia County came in third for the total number of manufactured home sales. The following table summarizes important metrics for Columbia County:
Total sales volume dollar amount changed only 2.4% and there was almost no change in the size of the average manufactured home. Average prices rose 12% but that may be partially attributed to a nearly 61% increase in average lot size.
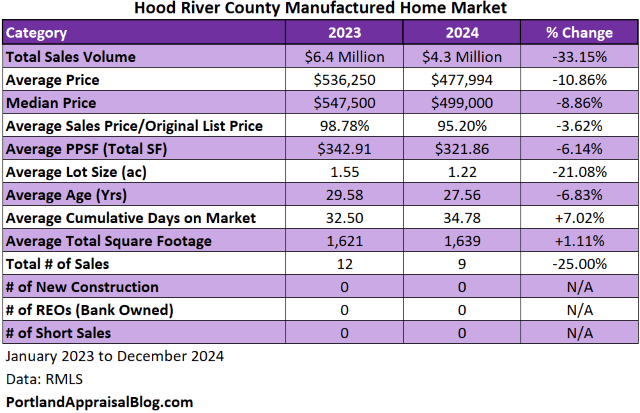
Hood River County 2024 Stats
Hood River is the second smallest county in Oregon by area at 533 square miles. The population is estimated to be about 24,000 people. With such a sparse population it is no surprise this county had little activity.
There was a 33% drop in the sales volume dollar amount, but that almost mirrors the 25% decline in the total number of sales. The average size of the units did not meaningfully change, but the average lot size dropped 21%, which likely contributed to the sharper decline of the sales volume dollar amount.
That wraps up our look at the Portland Region 2024 manufactured home market!
Thank you for reading the post! I hope you found some useful or interesting nugget of information. Please consider subscribing.
Question: Do you think 2025 will see the number of manufactured home sales rebound or will high interest rates keep a clamp on the market?
CODA
Are you an agent and wonder why appraisers always do “x”? Are you a homeowner who received a report and has one or two questions about appraisal terminology or methodology? If so, please feel free to contact me. I enjoy interacting with various market participants and am always happy to help out where I can! And if you are in need of any appraisal services, feel free to reach out to us!


