

Photo: Via Wikimedia Commons (CC BY 4.0)
The Ritz‑Carlton Residences, Portland entered 2026 under a cloud of uncertainty. Between November 9, 2023 and February 28, 2025, only 11 units had sold—as detailed in a prior Portland Appraisal Blog analysis—and the project had become the subject of sustained media attention focused on stalled absorption, unresolved structural questions, and the perception that the tower was struggling to gain traction in a challenging downtown environment. The situation escalated when the property underwent a transfer in lieu of foreclosure, adding another layer of complexity to an already difficult narrative.
By early 2026, the building carried 121 unsold units, and the market for new‑construction luxury condominiums in the central city appeared effectively frozen. With no closings for roughly a year, the project was beginning to resemble a potential failure: a high‑profile development facing a large block of inventory, limited buyer confidence, and widespread uncertainty about how—or whether—the remaining units could be absorbed.
This was the backdrop against which Christie’s International Real Estate assumed responsibility for the remaining inventory. The central question was whether a disciplined strategy could revive a project that had stalled so completely.
Turnaround Challenge
Christie’s International Real Estate assumed responsibility for the remaining inventory at The Ritz‑Carlton Residences, Portland at a moment when the project faced significant headwinds. Although the brokerage network originated as a subsidiary of the Christie’s auction house, it is now independently owned and operates under a long‑term, exclusive brand‑licensing partnership with the auction house. According to the organization’s official website, the network spans more than 50 countries, includes 518 brokerage offices, and comprises over 11,000 agents.
Its Portland affiliate, Christie’s International Real Estate Evergreen – Portland, is based in the Pearl District and has been tasked with directing the turnaround efforts. Per their website, the local team was “founded by longtime top‑producing brokers…with deep roots in Oregon and Southwest Washington.” This combination of local experience and access to a global luxury network positioned the firm to manage a complex, high‑end inventory release in a challenging market environment.
The task was no minor undertaking. Their job was to reintroduce a project that had gone quiet, rebuild buyer confidence, and manage the release of a large block of inventory without destabilizing pricing or overwhelming the market.
The data from the first half of 2026 now provides a clear picture of how that effort unfolded and why the results amount to a well‑managed turnaround.
Ritz-Carlton Performance Snapshot
| Metric | Pre-Reset (2023-2025) | Post Reset (2026 – Present) |
|---|---|---|
| Units Sold | 11 | 36 |
| Cancelled Listings | 103 | 2 |
| Total $ Value | $16,504,000 | $42,362,500 |
| Average Sales Price | $1,500,364 | $1,176,736 |
| Median Sales Price | $1,100,000 | $1,140,000 |
| Average PPSF | $1,052.73 | $732.01 |
| Median PPSF | $944.20 | $693.09 |
| Average Total SF | 1,363 | 1,577 |
| Average SP/OLP | 84.48% | 100.00% |
| Average CDOM | 24.55 | 10.25 |
The metrics reveal a clear shift in market behavior at The Ritz‑Carlton Residences following the ownership transition and pricing reset. From 2023 through the end of 2025, the project recorded 11 closed sales against 103 cancelled listings, a pattern consistent with pricing misalignment and limited buyer engagement. In contrast, from January through May 31, 2026, the building produced 36 closings with only two cancellations, indicating a market that re‑engaged once pricing and release strategy were realigned.
This shift is visible across all major indicators. Average sale price declined from $1,500,364 to $1,176,736, while median sale price remained relatively stable at approximately $1.1–$1.14 million. The more pronounced change appears in price per square foot: average PPSF fell from $1,052.73 to $732.01 (median PPSF from $944.20 to $693.09), reflecting the magnitude of the pricing adjustment required to achieve consistent absorption. Post‑reset transactions also show a much tighter clustering between average and median values, suggesting a more uniform product mix and a consistent buyer pool.
Other measures point to improved market efficiency. Sales price to original list price (SP/OLP) performance increased dramatically to 100%, and cumulative days on market (CDOM) compressed from 24.55 days to 10.25 days. (This uniform 100% SP/OLP outcome across all 36 sales is noteworthy; it suggests the brokerage team made a deliberate decision to set disciplined, market‑supported list prices from the outset and hold firm rather than engage in incremental negotiations or further reductions.) Units sold in 2026 also trend noticeably larger on average (1,577 SF vs. 1,363 SF pre‑reset). This shift in unit mix appears to have helped stabilize median sale prices near $1.14 million despite the substantial reduction in PPSF—effectively offering buyers more space while managing the optics of the pricing reset.
From an appraisal perspective, the post‑reset period provides a more reliable body of closed sales for market‑supported valuation. With nearly $59 million in closed condominium sales to date, the dataset is now large enough to support meaningful paired‑sales analysis, PPSF benchmarking, and broader comparison within the downtown Portland luxury segment. The reduction in cancelled listings, the convergence of average and median pricing, and the consistent SP/OLP ratios all indicate improved conformity and sharpens analytical reliability relative to the pre‑reset period.
This snapshot establishes the foundation for the sections that follow, including the relationship between pricing and square footage, the building’s unusually consistent SP/OLP discipline, and the timing patterns visible in listing activity and days on market.
Market Behavior Visuals
The following visuals illustrate how the pricing reset, release strategy, and absorption patterns played out in real time. Each chart highlights a different dimension of the repositioning—from the relationship between sales price and unit size, to the building’s pricing discipline, to the cadence of listings and the timing of contract activity. Taken together, these visuals provide a clearer picture of how the project moved from stalled activity to consistent, market‑supported absorption.
Sales Price vs. Total Square Footage
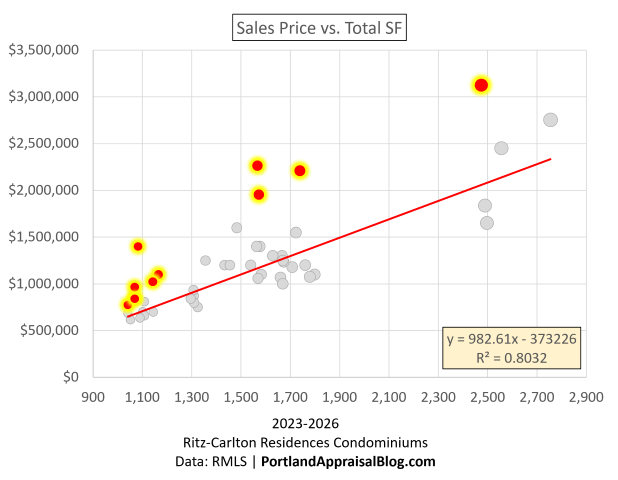
The scatter plot above highlights one of the clearest contrasts between the pre‑reset and post‑reset market. The original 11 sales (shown in red with a yellow highlight, and sized by total square footage) follow a notably tight linear relationship between unit size and sales price. This indicates that the initial pricing model was internally consistent and size‑driven, but ultimately too high to close more than 11 units over roughly two years. In other words, the pricing logic made sense on paper, but the broader market did not accept the level.
The 2026 sales (shown in gray, also sized by total SF) tell a different story. Rather than forming a straight line, they create a broader vertical band—primarily between 1,400 and 1,800 square feet—with similar‑sized units selling at different prices. This dispersion reflects buyers pricing in floor level, view orientation, and other qualitative attributes. That pattern is exactly what we expect in a more typical, functioning condominium market. When qualitative differences don’t influence price, it usually signals that something is suppressing normal market behavior—precisely the condition present during the pre‑reset period.
Two larger 2026 sales—approximately $2.6M and $2.8M—sit above the main cluster yet remain aligned with the overall trendline. Their presence demonstrates that the premium segment remained viable after the reset; the repositioning did not cripple the upper tier, it simply recalibrated the broader pricing structure to levels the market would reliably absorb.
Overall, the visual shows a clear transition:
- Pre‑reset: linear, size‑driven pricing with low absorption
- Post‑reset: market‑derived pricing with healthy variation and strong absorption
This shift sets the stage for the next section on pricing discipline, where we examine how the brokerage held firm on list prices across all 36 post‑reset sales.
Pricing Discipline — 36/36 at 100% SP/OLP
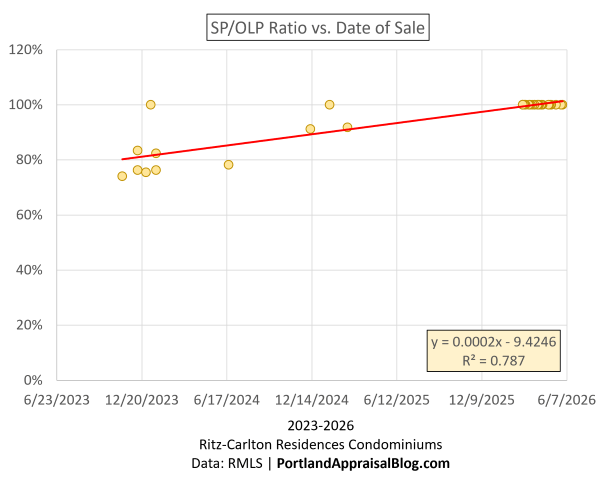
The SP/OLP visuals highlight one of the clearest outcomes of the repositioning: all 36 post‑reset sales closed at 100% of the original list price. This consistency reflects both strong market acceptance and the brokerage team’s research‑driven pricing strategy. The team clearly entered the reset with a well‑supported understanding of where the market would perform, allowing them to hold firm on pricing from the outset. Whether later phases will require adjustments is unknown, but the first 36 sales demonstrate a deliberate intent to maintain pricing discipline during the initial release.
The SP/OLP ratio chart shows the contrast with the pre‑reset period. Earlier transactions cluster in the 70%–90% range, reflecting the degree of price capitulation required to secure the first 11 closings. This wasn’t about concessions in the technical sense—both periods were heavily cash‑driven (9 of 11 pre‑reset sales and 27 of 36 post‑reset sales). Instead, the gap simply reflects how far the original list prices exceeded market‑supported levels.
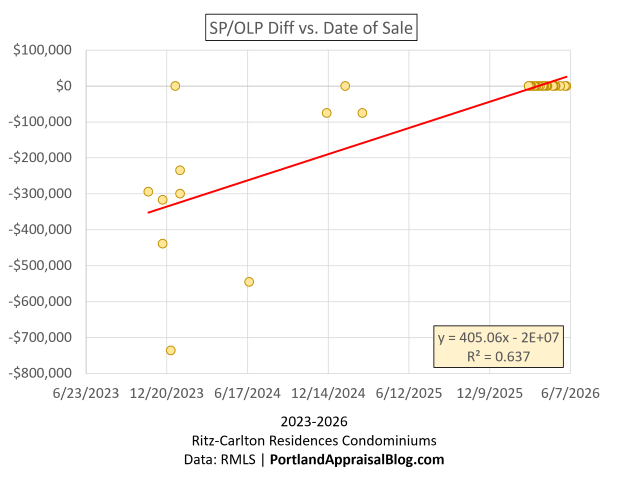
The dollar‑difference chart reinforces this point. Several pre‑reset units closed $300,000 to $800,000 below their original list prices, underscoring the magnitude of the pricing gap. Post‑reset, this gap disappears entirely. The absence of downward movement across all 36 sales indicates a stable, market‑derived pricing structure rather than one reliant on reductions or incentives.
Together, these visuals show how the reset replaced a high‑price, low‑absorption model with a calibrated pricing framework that the market consistently supported. This pricing stability provides essential context for the next section, where the DOM and List‑Date scatter reveals how absorption patterns evolved under the new strategy.
Simple Graph, Surprisingly Complex Story (DOM vs. List Date)
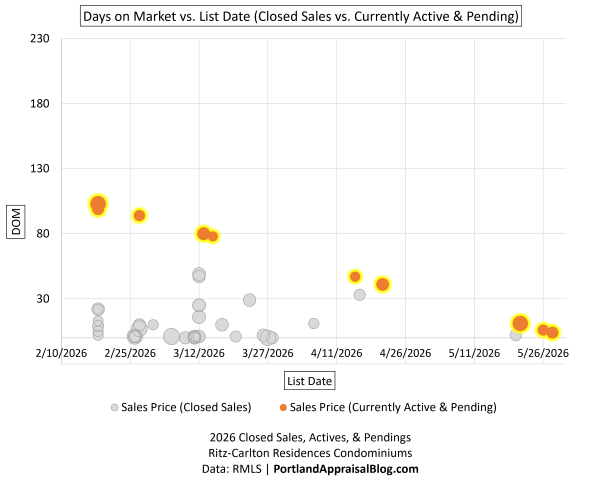
The DOM vs. List Date scatter is simple in what it displays—each dot shows when a unit was listed, how long it remained on the market, and whether it ultimately closed or is still active (gray = closed, orange = active/pending). Dot size reflects total square footage. But when paired with the weekly release table, the graph reveals the entire structure of the post‑reset absorption cycle.
| Week Listed | Total Listings | Eventual Sales | Still Active or Pending |
|---|---|---|---|
| 11/17/2025 | 1 | 0 | 1 |
| 2/16/2026 | 14 | 6 | 8 |
| 2/23/2026 | 8 | 7 | 1 |
| 3/2/2026 | 2 | 2 | 0 |
| 3/9/2026 | 15 | 12 | 3 |
| 3/16/2026 | 2 | 2 | 0 |
| 3/23/2026 | 4 | 4 | 0 |
| 4/6/2026 | 1 | 1 | 0 |
| 4/13/2026 | 2 | 1 | 1 |
| 4/20/2026 | 1 | 0 | 1 |
| 5/18/2026 | 2 | 1 | 1 |
| 5/25/2026 | 2 | 0 | 2 |
| Totals | 54 | 36 | 18 |
1. The scatter shows listing timing, not closing timing
Each point marks the day a unit entered the market and how long it remained exposed. It does not show when the sale closed. This distinction matters because the brokerage’s release cadence—not the closing dates—is what shapes the pattern.
2. The release table shows how supply entered the market
The brokerage released units in deliberate batches:
- 14 units the week of 2/16
- 8 units the week of 2/23
- 2 units the week of 3/2
- 15 units the week of 3/9
After more than a year with no closings, the market had accumulated substantial pent‑up demand. The brokerage met that demand with a controlled, phased release rather than flooding the market.
3. DOM for closed sales was remarkably range‑bound
This is one of the most important reads from the scatter.
The gray dots—the units that did sell—cluster within a tight, normal DOM range for a luxury product at this price point. Their DOM reflects typical exposure time, not distress or stagnation.
The high‑DOM outliers are almost entirely unsuccessful listings (orange dots). Their height on the chart represents the number of days from their list date through the date of analysis (June 1, 2026). These are the units that remain active or pending, not the ones that closed.
This distinction matters:
- Successful listings: normal, range‑bound DOM
- Unsuccessful listings: high DOM because they are still on the market
This pattern reinforces that the early waves did sell efficiently and that the scatter’s tallest points are simply the unsold remainder of each release cycle.
4. After 3/28, absorption slows for newly released units—but closings continue overall
Only three of the units released after 3/28 have closed so far. This marks the transition from the pent‑up demand phase to the organic‑demand phase, where absorption naturally slows as the backlog of waiting buyers is satisfied.
However, this does not mean the project stopped closing units. Actual closings—regardless of list date—continued into May, with seven closings in May.
This distinction is important:
- Release‑cohort absorption slowed (only 3 of the later‑listed units have closed).
- Overall project absorption remained active, just thinner and more typical of a luxury market returning to normal conditions.
The scatter shows this shift: later list dates contain fewer gray dots (closings) and more orange dots (active/pending).
5. No new releases between 4/22 and 5/19
This pause appears in the scatter as a gap in new list dates. The brokerage held back because each release cycle left behind a small number of active units. As absorption slowed, adding more supply would have risked creating drag.
6. Residual inventory is now accumulating — the sensitive phase
There are now 17 active units (plus one pending likely to close). With only 47 of 132 units sold to date, the project still has 85 units remaining.
The scatter shows this clearly:
- Each release cycle leaves a few units unsold.
- Those unsold units accumulate as the market shifts into organic demand.
- DOM for active units is rising—not because pricing is off, but because the buyer pool is no longer front‑loaded with people who have been waiting a year.
This is the expected pattern for a luxury high‑rise after a reset: fast absorption early, slower absorption later, and increasing sensitivity to release timing. With 17 active units (the part of 85 unsold that is currently exposed to the market), the project is entering a more sensitive phase where release timing and inventory management will matter more than during the initial surge.
Concluding Thoughts — A Reset That Worked, and the Phase That Comes Next

Photo: Via Wikimedia Commons (CC BY 4.0)
The post‑reset performance of the Ritz‑Carlton Residences shows a project that successfully re‑entered the market with a pricing structure the market was willing to absorb. The Sales Price vs. Total SF analysis demonstrated that the reset restored a functioning market where qualitative differences once again influenced price. The SP/OLP discipline confirmed that the brokerage team priced the units with precision, holding firm at 100% SP/OLP across all 36 post‑reset sales—an outcome that reflects both strong market acceptance and a research‑driven pricing strategy.
The DOM vs. List Date scatter then revealed how absorption actually unfolded. The initial release cadence met more than a year’s worth of pent‑up demand, clearing nearly 70% of early listings and producing normal, range‑bound DOM for the units that closed. As the market transitioned into organic demand, absorption naturally slowed, and residual inventory began to accumulate. With 17 active units and 85 still unsold, the project now enters a more sensitive phase where release timing, inventory management, and continued pricing discipline will matter more than during the initial surge.
Taken together, these visuals tell a coherent story:
- The reset corrected the pricing structure.
- The brokerage executed a disciplined, data‑supported launch.
- The market responded strongly at first, then settled into a more typical luxury‑market rhythm.
The project is no longer in the “reset” phase; it is now in the management phase, where the remaining 85 units will require careful pacing to maintain the stability achieved so far. The early results show that the repositioning worked. The next chapter will depend on how effectively the team navigates the slower, more organic portion of the absorption curve.
Sources & Further Reading
- The Ritz Carlton Residences | Portland: Official Website
- Christie’s International Real Estate: Official Website
- Christie’s International Real Estate | Ownership: The Real Deal
- Christie’s International Real Estate | Portland Office: Official Website
- The Ritz-Carlton Residences, Portland — Market Resistance and the Principle of Conformity in Downtown Condominiums (2023–2025): Portland Appraisal Blog
Thanks for reading—I hope you found a useful insight or an unexpected nugget along the way. If you enjoyed the post, please consider subscribing for future updates.
CODA
Are you an agent in Portland who wonders why appraisers always do “x”?
A homeowner with questions about appraiser methodology?
If so, feel free to reach out—I enjoy connecting with market participants across Portland and the surrounding counties, and am always happy to help where I can.
And if you’re in need of appraisal services in Portland or anywhere in the Portland Region, we’d be glad to assist.

_-_025.jpg)
_-_010.jpg)