
About This Snapshot
This snapshot summarizes residential sales occurring within the Villages at Mount Hood & Government Camp market area during calendar year 2025 (with some comparisons to calendar year 2024). Because the study area spans several small communities rather than a single municipality, the analysis is organized around properties using postal addresses associated with Brightwood, Government Camp, Rhododendron, and Welches. Included property types are detached homes, attached homes, condominiums, and manufactured homes on owned land. Data are sourced from RMLS and have undergone a rigorous cleaning and validation process. Manufactured homes located in leased-space parks and U.S. Forest Service leased cabins are not included in this analysis. For additional information regarding data cleaning procedures and common MLS data challenges, see the dedicated page: RMLS Data Accuracy Challenges.
Note: Wemme and Zigzag are well-established communities within the Villages at Mount Hood, but neither has had its own post office since 1977 and 1974, respectively. Because RMLS city fields follow postal addressing, homes in these communities are generally recorded under Welches and Rhododendron. This snapshot therefore reports activity by postal city and cannot separate sales within Wemme or Zigzag themselves.
Tables in this snapshot cover important metrics such as:
- Sales price to original list price: SP/OLP
- Price per square foot (total square footage): PPSF (TSF)
- Cumulative days on market: CDOM
- Average lot size in acres: ac
Market Overview
The Villages at Mount Hood & Government Camp market area consists of a collection of small communities located along the Mount Hood Corridor in Clackamas County, Oregon. The Mount Hood Village CDP, which includes Brightwood, Welches, Wemme, Zigzag, and Rhododendron, had a reported population of approximately 4,864 residents according to the 2010 Census, while Government Camp reported a population of 179 residents in the 2020 Census. Despite their small populations, these communities support an active housing market influenced by both year-round residency and the area’s role as a gateway to Mount Hood recreation.
Located approximately one hour east of Portland along U.S. Route 26, the corridor provides convenient access to outdoor destinations such as Timberline Lodge, Mount Hood Skibowl, and Mount Hood Meadows. Government Camp is the closest community to the mountain and serves as the region’s primary ski town, while the Villages at Mount Hood provide a mix of residential neighborhoods, mountain retreats, and housing opportunities throughout the corridor. As a result, the local housing market differs from many suburban Portland-area communities, combining permanent residential ownership with housing that benefits from proximity to recreation, tourism, and seasonal visitation.
The Villages at Mount Hood & Government Camp Residential Market Snapshot
The following table summarizes residential sales occurring within the Villages at Mount Hood & Government Camp during calendar year 2025. Included property types are detached homes, attached homes, condominiums, and manufactured homes on owned land. Together, these four segments provide a high-level overview of the area’s residential market.
| Category | Detached | Attached | Condo | Manuf. |
|---|---|---|---|---|
| Total Dollar Volume | $64,555,956 | $1,196,000 | $5,545,950 | $3,600,000 |
| Average Price | $665,525 | $598,000 | $462,163 | $400,000 |
| Average PPSF (Total SF) | $401.60 | $326.66 | $384.24 | $274.00 |
| Average Total SF | 1,795 | 1,831 | 1,184 | 1,596 |
| Average Lot Size (ac) | 0.73 | 0.11 | 0.00 | 0.51 |
| Average Age (Yrs) | 48.66 | 18.00 | 42.25 | 19.00 |
| Average CDOM | 66.43 | 126.50 | 99.00 | 78.44 |
| Total # of Sales | 97 | 2 | 12 | 9 |
| % of Market | 80.83% | 1.67% | 10.00% | 7.50% |
| Highest Sale | $2,599,000 | $610,000 | $800,000 | $515,000 |
| Lowest Sale | $301,000 | $586,000 | $267,000 | $320,000 |
| # Affordable | 28 | 0 | 8 | 8 |
| % Affordable | 28.87% | 0.00% | 66.67% | 88.89% |
January 2025 – December 2025 (120 total residential sales).
Data: RMLS | PortlandAppraisalBlog.com
The Villages at Mount Hood & Government Camp market generated 120 residential sales during 2025, producing nearly $75 million in residential dollar volume. Detached homes dominated activity, accounting for 97 sales (80.8% of all residential transactions) and 86.2% of residential dollar volume. Condominiums and manufactured homes represented meaningful secondary segments, while attached housing activity remained limited with only 2 sales in 2025 and none in 2024.
Four communities generated residential sales during 2025, with Wemme and Zigzag embedded within them. The sections that follow examine how activity varied across housing types and communities, providing a closer look at marketing, affordability, infrastructure, recreation-oriented influences, and other characteristics that help define the Mount Hood corridor housing market.
Vacation & Investment-Oriented Marketing
Housing statistics alone do not always capture how a market is positioned to prospective buyers. To better understand the character of the Villages at Mount Hood & Government Camp market, listing remarks were reviewed for themes related to vacation use, rental opportunities, short-term rentals, and investment potential. The following table summarizes the number of residential sales containing these themes during 2025. Each row represents an independent search, meaning individual properties may be counted in multiple categories. The final row identifies sales containing at least one of the listed themes.
| Market Terms | # of Sales | % of 2025 Market (120 Sales) |
|---|---|---|
| Vacation | 30 | 25.00% |
| Vacation Rental | 16 | 13.33% |
| Rental | 53 | 44.17% |
| Airbnb/VRBO | 15 | 12.50% |
| Investment/Income | 33 | 27.50% |
| Short-Term/STRs | 32 | 26.67% |
| Any of the Above | 74 | 61.67% |
The Villages at Mount Hood & Government Camp
January 2025 – December 2025 (120 total residential sales).
Data: RMLS | PortlandAppraisalBlog.com
The results indicate that vacation use, rental opportunities, and investment potential are important components of the Mt. Hood corridor housing market. Terms associated with rentals, investments, vacation use, and short-term rentals appeared frequently throughout residential listings, suggesting these characteristics are meaningful considerations for many market participants.
Most notably, 74 of 120 residential sales (61.7%) contained at least one vacation-, rental-, Airbnb/VRBO-, short-term rental-, or investment-related marketing theme. While actual use of acquired properties may vary, these findings indicate that listing agents repeatedly emphasized recreational ownership, second-home potential, and supplemental rental income when marketing properties within the corridor. Combined with the area’s proximity to Mount Hood recreation amenities, the results help explain why the Villages at Mount Hood & Government Camp housing market differs from many traditional suburban housing markets.
Detached Homes
Detached homes represent the largest and most active residential housing segment in the Villages at Mount Hood & Government Camp. Because detached properties accounted for more than 8 out of 10 sales during 2025, this segment provides the clearest view of local market conditions.
Detached Homes Market Statistics
The following table compares detached-home sales activity occurring within the Villages at Mount Hood & Government Camp market area during 2024 and 2025. Metrics include the number of sales, total dollar volume, pricing, property characteristics, marketing times, and affordability.
| Category | 2024 | 2025 | Change |
|---|---|---|---|
| Total $ Volume | $56,102,017 | $64,555,956 | +15.07% |
| Average Price | $660,024 | $665,525 | +0.83% |
| Median Price | $580,000 | $600,000 | +3.45% |
| Avg SP/OLP | 95.233% | 94.715% | -0.518 pts |
| Avg PPSF (TSF) | $426.08 | $401.60 | -5.75% |
| # in HOA | 23 | 30 | +7 homes |
| Avg HOA Dues | $67.96 | $87.34 | +28.52% |
| Avg Total SF | 1,689 | 1,795 | +6.28% |
| Avg Lot Size (ac) | 0.7348 | 0.7309 | -0.52% |
| Avg Age (Yrs) | 51.84 | 48.66 | -3.18 years |
| Avg CDOM | 50.56 | 66.43 | +15.87 days |
| Total # of Sales | 85 | 97 | +12 homes |
| # of New Constr. | 4 | 3 | -1 home |
| # Affordable | 21 | 28 | +7 homes |
| % Affordable | 24.71% | 28.87% | +4.16 pts |
The Villages at Mount Hood & Government Camp
Single-Family Detached Residential | 2024 & 2025
Data: RMLS | PortlandAppraisalBlog.com
Detached-home activity increased during 2025, rising from 85 sales in 2024 to 97 sales in 2025 (+14.1%). As a result, total detached-home dollar volume increased 15.1% and exceeded $64.5 million. While pricing metrics generally remained stable, average home size increased from 1,689 square feet to 1,795 square feet, contributing to a modest decline in average price per square foot. New construction activity remained limited relative to the overall market, accounting for just three sales during 2025.
Marketing times increased during 2025, with cumulative days on market rising from about 51 days to approximately 66 days. HOA representation also increased, with 30 detached-home sales (30.9%) located within homeowner associations compared with 23 sales during 2024. Although average HOA dues increased to $87.34 per month, they remained relatively modest by regional standards. Review of listing remarks indicates that HOA benefits frequently extended beyond traditional amenities, often including services such as road maintenance, water, sewer, and snow removal. Within a mountain community where winter weather can affect access, these services may be particularly valuable to some homeowners.
Detached Homes Sales by City
The following table summarizes where detached-home sales occurred during 2025. While the study area includes six communities, market activity was not evenly distributed.
| City | # of Sales | % of 2025 Detached Market |
|---|---|---|
| Brightwood | 10 | 10.31% |
| Government Camp | 8 | 8.25% |
| Rhododendron | 49 | 50.52% |
| Welches | 30 | 30.93% |
| Total Sales | 97 | — |
The Villages at Mount Hood & Government Camp
Single-Family Detached Residential | 2025
Data: RMLS | PortlandAppraisalBlog.com
Detached-home activity was concentrated in just two communities. Rhododendron accounted for 49 sales (50.5%), while Welches contributed 30 sales (30.9%). Combined, these two communities generated 79 of 97 detached-home sales (81.4%), making them the primary drivers of detached-housing activity within the Mount Hood Villages & Government Camp market area.
Brightwood and Government Camp represented smaller but still meaningful portions of the market, accounting for 10.3% and 8.3% of detached-home sales, respectively.
Detached Homes Sales by Price Range
The following table summarizes detached-home sales occurring within the Villages at Mount Hood & Government Camp market during 2025 by price range. In addition to the number of sales, the table highlights the average price, typical size, construction era, and typical lot size within each price band.
| Price Range | # of Sales | Avg Close Price | Avg Total SF | Avg Year Built | Avg Acres |
|---|---|---|---|---|---|
| <300K | 0 | — | — | — | — |
| 300K – 349K | 5 | $326,800 | 953 | 1939 | 0.311 |
| 350K – 399K | 11 | $379,530 | 1,113 | 1962 | 0.363 |
| 400K – 449K | 8 | $419,500 | 965 | 1960 | 0.364 |
| 450K – 499K | 11 | $477,404 | 1,457 | 1959 | 0.620 |
| 500K – 549K | 6 | $523,583 | 1,568 | 1980 | 0.597 |
| 550K – 599K | 7 | $580,857 | 1,958 | 1986 | 0.446 |
| 600K – 649K | 8 | $623,250 | 1,991 | 1976 | 0.627 |
| 650K – 699K | 8 | $670,750 | 1,864 | 1986 | 0.661 |
| 700K – 749K | 9 | $720,997 | 2,068 | 1986 | 0.913 |
| 750K – 799K | 5 | $768,000 | 2,031 | 2000 | 1.470 |
| 800K – 849K | 1 | $825,000 | 970 | 1952 | 1.470 |
| 850K – 899K | 5 | $881,700 | 2,396 | 1986 | 0.642 |
| 900K – 949K | 2 | $918,350 | 2,609 | 2000 | 1.090 |
| 950K – 999K | 2 | $974,500 | 2,056 | 1991 | 0.213 |
| 1,000K – 1,049K | 1 | $1,025,000 | 1,832 | 1977 | 0.120 |
| 1,050K – 1,099K | 2 | $1,066,500 | 3,440 | 1995 | 6.150 |
| 1,100K – 1,149K | 0 | — | — | — | — |
| 1,150K – 1,199K | 0 | — | — | — | — |
| ≥ 1,200K | 6 | $1,679,000 | 3,280 | 2005 | 0.556 |
| Total/Avg | 97 | $665,525 | 1,795 | 1976 | 0.7309 |
The Villages at Mount Hood & Government Camp
Single-Family Detached Residential | 2025
Data: RMLS | PortlandAppraisalBlog.com
Detached-home sales ranged from $301,000 to $2,599,000 during 2025, illustrating the diverse nature of the Mount Hood corridor housing market. While a meaningful upper-end segment existed, most activity remained concentrated below $750,000, where 73 of 97 sales (75.3%) occurred. The median sale price of $600,000 and modal sale price of $725,000 further indicate that most detached-home transactions occurred within the market’s lower and middle price tiers.
The table also illustrates how property characteristics generally changed as prices increased. Lower-priced sales tended to consist of smaller homes built in earlier decades, while higher-priced properties often offered larger living areas, newer construction dates, greater land area, or a combination of these characteristics. Although sales exceeding $1 million accounted for less than ten percent of the detached-home market, they remained an important component of the corridor’s housing mix, with nine sales occurring above that threshold.
Detached Homes Scatter Plot
The following scatter plot provides a visual overview of detached-home sales occurring during 2025. Each point represents a single sale and illustrates the relationship between sale price and date of sale.
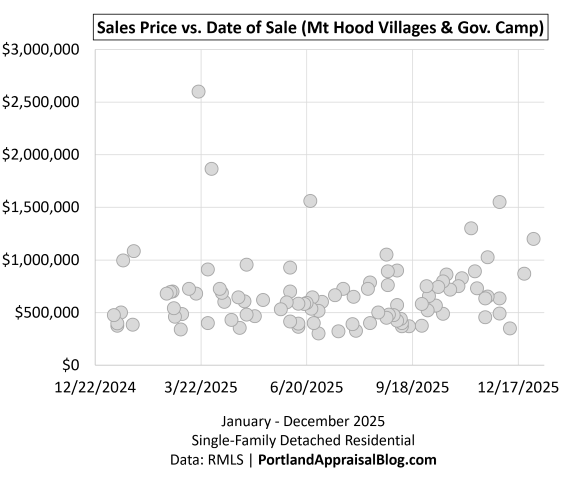
The scatter plot reinforces several themes already identified within the detached-home market. Most sales occurred below $750,000, with transaction density gradually declining as prices increased. While detached-home sales ranged from approximately $301,000 to $2.6 million, the gap between the upper-end market and the majority of transactions is readily apparent.
The graph shows a nearly month-long period where no detached-home sales occurred. From January 25 through February 23, 2025, no closed sales were recorded within this housing segment. However, market activity continued during this period, as homes were still being listed and going under contract. February, while a relatively weak month for both closed sales and new listings, still saw 8 detached homes go pending.
Detached Homes Water & Wastewater Infrastructure
Water supply and wastewater disposal can be important considerations in mountain community housing markets. The following tables summarize the primary water and wastewater systems reported for detached-home sales occurring within the Villages at Mount Hood & Government Camp.
| Water Type | # of Sales | % of 2025 Market |
|---|---|---|
| Public Water | 23 | 23.71% |
| Community Water | 53 | 54.64% |
| Well | 12 | 12.37% |
| Shared Well | 6 | 6.19% |
| Spring | 3 | 3.09% |
| Grand Total | 97 | — |
The Villages at Mount Hood & Government Camp
Single-Family Detached Residential | 2025
Data: RMLS | PortlandAppraisalBlog.com
Community water systems were the most common water source for detached-home sales during 2025, serving 53 properties (54.6%). Public water accounted for an additional 23.7% of sales, meaning nearly 4 of 5 detached-home transactions relied on either community or public water systems. Wells, shared wells, and spring-fed systems remained present throughout the corridor, illustrating the diverse infrastructure characteristics that buyers may encounter within the Villages at Mount Hood & Government Camp market.
| Wastewater Type | # of Sales | % of 2025 Market |
|---|---|---|
| Public Sewer | 35 | 36.08% |
| Community | 9 | 9.28% |
| Septic | 46 | 47.42% |
| Cesspool | 4 | 4.12% |
| Other | 3 | 3.09% |
| Grand Total | 97 | — |
The Villages at Mount Hood & Government Camp
Single-Family Detached Residential | 2025
Data: RMLS | PortlandAppraisalBlog.com
Wastewater infrastructure was more evenly distributed. Septic systems were the most common arrangement, serving 46 detached-home sales (47.4%), followed by public sewer connections at 36.1%. Community wastewater systems accounted for an additional 9.3% of sales. Collectively, these figures indicate that detached-home buyers in the Mount Hood corridor are more likely to encounter private or community-based wastewater solutions than buyers in many suburban housing markets, where public sewer service is often the dominant arrangement.
Detached Homes Required Income & Affordability
The following represents affordability and required income findings for detached homes during 2025 under the Portland Appraisal Blog Affordability Index (PABAI) framework.
| Metric | Value |
|---|---|
| Total Sales (Detached) | 97 |
| # of Affordable Sales | 28 |
| % Affordable | 28.87% |
| Minimum Required Income | $77,846 |
| Average Required Income | $170,883 |
| Median Required Income | $157,132 |
| Maximum Required Income | $650,145 |
The Villages at Mount Hood & Government Camp
Single-Family Detached Residential | 2025
Data: RMLS | PortlandAppraisalBlog.com
How affordability is defined: The Portland Appraisal Blog Affordability Index (PABAI) was used to evaluate affordability during the study period. PABAI calculates the income needed to buy each home using its actual reported price, taxes, HOA dues, and an insurance estimate, financed at the Freddie Mac 30-year rate in effect at the time of sale. A home is considered affordable if the required income does not exceed the HUD median family income for the Portland-Vancouver-Hillsboro MSA in effect at the time of sale.
Despite affordability challenges, detached-home ownership opportunities remained available throughout the corridor. The minimum required income of $77,846 demonstrates that some detached homes remained accessible to households earning below the area’s median family income, though such opportunities were relatively limited. Conversely, the wide gap between the minimum and maximum required incomes highlights the diversity of the detached-home market, which includes both modest mountain cabins and high-end recreational or luxury properties. As subsequent housing segments will demonstrate, detached homes generally required substantially higher incomes than condominiums and manufactured homes.
Condominium Housing
Condominiums represent a very small segment within the Villages at Mount Hood & Government Camp residential market. Due to the limited number of sales, the results are best viewed as descriptive measures of market activity rather than indicators of broader market trends.
Condominium Housing Market Statistics
The following table compares condominium sales activity occurring within the Villages at Mount Hood & Government Camp market during 2024 and 2025. Metrics include the number of sales, total dollar volume, pricing, property characteristics, marketing times, and affordability.
| Category | 2024 | 2025 | Change |
|---|---|---|---|
| Total $ Volume | $8,566,700 | $5,545,950 | -35.26% |
| Average Price | $611,907 | $462,163 | -24.47% |
| Median Price | $617,500 | $361,000 | -41.54% |
| Avg SP/OLP | 95.58% | 96.88% | +1.30 pts |
| Avg PPSF (TSF) | $464.96 | $384.24 | -17.36% |
| # in HOA | 14 | 12 | -2 homes |
| Avg HOA Dues | $557.00 | $493.83 | -11.34% |
| Avg Total SF | 1,358 | 1,184 | -12.79% |
| Avg Age (Yrs) | 40.79 | 42.25 | +1.46 years |
| Avg CDOM | 59.43 | 99.00 | +39.57 days |
| Total # of Sales | 14 | 12 | -2 homes |
| # of New Constr. | 0 | 0 | No Change |
| # Affordable | 3 | 8 | +5 homes |
| % Affordable | 21.43% | 66.67% | +45.24 pts |
| Min Required Income | $100,774 | $91,654 | -9.05% |
| Avg Required Income | $182,469 | $138,877 | -23.89% |
The Villages at Mount Hood & Government Camp
Condominium Residential | 2024 & 2025
Data: RMLS | PortlandAppraisalBlog.com
Condominium activity remained limited during 2025, with only 12 sales occurring throughout the Villages at Mount Hood & Government Camp market. Total dollar volume declined 35.3%, while average and median sale prices decreased 24.5% and 41.5%, respectively. However, these changes should be interpreted cautiously given the small number of transactions. The average condominium sold during 2025 was also smaller than the average unit sold during 2024 (1,184 SF versus 1,358 SF), indicating changes in the mix of properties sold influenced several pricing metrics.
Affordability improved substantially within the condominium segment. The number of affordable sales increased from 3 to 8, while the affordability rate rose from 21.4% to 66.7%. Average required income declined from approximately $182,500 to $138,900, placing condominiums among the more attainable ownership options within the broader Mount Hood corridor market. Marketing times increased from approximately 59 days to 99 days, though sellers generally maintained favorable negotiating positions, with average sale-to-original-list-price ratios remaining near 97%, an improvement over 2024.
Condominium Housing by City
The following table summarizes where condominium sales occurred during 2025. While the study area includes six communities, market activity was not evenly distributed.
| City | # of Sales | % of 2025 Condo Market |
|---|---|---|
| Brightwood | 0 | 0.00% |
| Government Camp | 4 | 33.33% |
| Rhododendron | 0 | 0.00% |
| Welches | 8 | 66.67% |
| Total Sales | 12 | — |
The Villages at Mount Hood & Government Camp
Condominium Residential | 2025
Data: RMLS | PortlandAppraisalBlog.com
Condominium activity was concentrated entirely within Welches and Government Camp during 2025. Welches accounted for 8 sales (66.7%), while Government Camp contributed the remaining 4 sales (33.3%). No condominium sales were recorded in Brightwood, or Rhododendron during the study period.
The concentration of sales within just two communities helps explain some of the volatility observed in the condominium statistics. Government Camp generally contains many of the corridor’s most recreation-oriented and highest-priced condominium developments. During 2024, Government Camp accounted for 9 of 14 condominium sales (64.3%), while only 4 sales occurred there during 2025. As a result, changes in the mix of units sold contributed to lower average prices, lower required incomes, and improved affordability metrics observed within the 2025 condominium market.
Manufactured Homes
Manufactured homes represented a small portion of the Villages at Mount Hood & Government Camp residential market during 2025, accounting for less than 1 out of 10 residential sales. As with condominiums, due to the limited number of sales, the results are best viewed as descriptive measures of market activity rather than indicators of broader market trends.
Manufactured Homes Market Statistics
The following table compares manufactured-home sales activity occurring within the Villages at Mount Hood & Government Camp market area during 2024 and 2025. Metrics include the number of sales, total dollar volume, pricing, property characteristics, marketing times, and affordability.
| Category | 2024 | 2025 | Change |
|---|---|---|---|
| Total $ Volume | $2,872,900 | $3,600,000 | +25.31% |
| Average Price | $410,414 | $400,000 | -2.54% |
| Median Price | $375,000 | $399,000 | +6.40% |
| Avg SP/OLP | 90.526% | 95.404% | +4.878 pts |
| Avg PPSF (TSF) | $288.08 | $274.00 | -4.89% |
| # in HOA | 2 | 5 | +3 homes |
| Avg HOA Dues | $50.00 | $45.00 | -10.00% |
| Avg Total SF | 1,632 | 1,596 | -2.18% |
| Avg Lot Size (ac) | 1.01 | 0.51 | -49.62% |
| Avg Age (Yrs) | 21.86 | 19.00 | -2.86 years |
| Avg CDOM | 59.57 | 78.44 | +18.87 days |
| Total # of Sales | 7 | 9 | +2 homes |
| # of New Constr. | 1 | 1 | No Change |
| # Affordable | 6 | 8 | +2 homes |
| % Affordable | 85.71% | 88.89% | +3.18 pts |
| Min Required Income | $78,189 | $80,752 | +3.28% |
| Avg Required Income | $107,820 | $102,699 | -4.75% |
The Villages at Mount Hood & Government Camp
Single-Family Manufactured Residential | 2024 & 2025
Data: RMLS | PortlandAppraisalBlog.com
Manufactured-home activity increased modestly during 2025, rising from 7 sales in 2024 to 9 sales in 2025. As a result, total dollar volume increased 25.3% to $3.6 million. Despite the increase in activity, pricing remained relatively stable. Average sale price declined 2.5% to $400,000, while the median sale price increased 6.4% to $399,000. Average home size, age, and price-per-square-foot metrics also exhibited only modest year-over-year changes, suggesting a generally stable housing segment.
Manufactured homes remained one of the most affordable ownership options within the Villages at Mount Hood & Government Camp market. Under the PABAI framework, 8 of 9 sales (88.9%) met affordability thresholds during 2025. Average required income declined to approximately $102,700, substantially below the detached-home segment and below the condominium segment. While the manufactured-home market remains small, the results indicate that this housing type continues to provide an important source of attainable homeownership opportunities within the corridor.
Manufactured Homes Sales by City
The following table summarizes where manufactured-home sales occurred during 2025. While the study area includes six communities, market activity was not evenly distributed.
| City | # of Sales | % of 2025 Manufact. Market |
|---|---|---|
| Brightwood | 0 | 0.00% |
| Government Camp | 0 | 0.00% |
| Rhododendron | 1 | 11.11% |
| Welches | 8 | 88.89% |
| Total Sales | 9 | — |
The Villages at Mount Hood & Government Camp
Single-Family Manufactured Residential | 2025
Data: RMLS | PortlandAppraisalBlog.com
Manufactured-home activity was highly concentrated within Welches, which accounted for 8 of 9 sales (88.9%) during 2025. Only one manufactured-home sale occurred outside Welches, with Rhododendron contributing the remaining transaction. No manufactured-home sales were recorded in Brightwood or Government Camp during the study period.
The concentration of sales within Welches increased during 2025. In 2024, manufactured-home sales were distributed more evenly between Welches and Rhododendron, with four and three sales respectively. By comparison, 2025 activity was overwhelmingly centered in Welches. Despite the segment’s small size, manufactured homes continued to provide an important source of comparatively affordable homeownership opportunities within the broader market.
Key Takeaways
The 2025 Villages at Mount Hood & Government Camp residential market saw an increase in market activity compared to 2024, generating 120 sales compared to 106. As a consequence, the market saw an additional $7.4 million in residential dollar volume. Detached homes remained the dominant housing type, accounting for more than 4 out of every 5 residential sales. While condominiums and manufactured homes represented much smaller segments, they provided important alternative ownership opportunities throughout the corridor.
A study of the Villages at Mount Hood & Government Camp market would be incomplete without accounting for the marketing patterns for many homes in the area. A review of listing remarks indicates that recreation, vacation use, and investment potential are core components of the local housing market. About 3 in 5 sales (61.7%) in 2025 contained at least one vacation-, rental-, Airbnb/VRBO-, short-term rental-, or investment-related marketing theme.
Residential activity was concentrated within a handful of communities. Rhododendron and Welches accounted for slightly over 8 out of 10 detached-home sales, while condominium activity was limited to Welches and Government Camp. Manufactured-home activity occurred almost exclusively in Welches in 2025.
Affordability varied significantly by housing type. Detached homes presented the greatest affordability challenges, with more than 71% of sales not meeting PABAI affordability thresholds. Condominiums became substantially more attainable during 2025, while manufactured homes remained the most affordable housing segment, with only one sale not affordable in 2025.
The market exhibited a wide range of housing opportunities. Detached-home sales ranged from just over $300,000 to nearly $2.6 million, demonstrating a housing stock that includes modest mountain cabins, year-round family homes, recreation-oriented properties, and high-end mountain retreats. Together, these findings reveal a housing market that serves both permanent residents and buyers drawn to the recreational amenities associated with the Mount Hood corridor.
Sources & Further Reading
All data presented in this housing market snapshot is sourced directly from RMLS and has been subjected to a rigorous cleaning and validation process to ensure reliability for single-family residential analysis for the Villages at Mount Hood & Government Camp. The trends, comparisons, and commentary are the result of original appraisal expertise and independent analysis—not aggregated from secondary sources or news summaries.
- RMLS Data Challenges: Portland Appraisal Blog
- The Portland Region – Six-County Market Area Overview: Portland Appraisal Blog
- Portland Affordability Index – PABAI: A Realistic Housing Qualification Metric for the Portland Region: Portland Appraisal Blog
- Mortgage Rates & the Portland Region Housing Market: Portland Appraisal Blog
- Mount Hood Village: Wikipedia
- Government Camp, Oregon: Wikipedia
- Wemme & Zigzag Post Offices: Mount Hood History

Coda
Thanks for reading—I hope you found a useful insight or an unexpected nugget along the way. If you enjoyed the post, please consider subscribing for future updates.
Are you an agent in Portland who wonders why appraisers always do “x”?
A homeowner with questions about appraiser methodology?
If so, feel free to reach out—I enjoy connecting with market participants across Portland and the surrounding counties, and am always happy to help where I can.
And if you’re in need of appraisal services in Portland or anywhere in the Portland Region, we’d be glad to assist.
About the Author — Abdur Abdul‑Malik, SRA, ASA
Abdur Abdul‑Malik is the founder, author, and publisher of the Portland Appraisal Blog, where he produces original regional and neighborhood‑level housing analytics for the Portland Region. He is a certified residential appraiser serving Oregon and Washington, drawing on RMLS transaction data, public records, and custom segmentation models he has built.
He developed the Portland Appraisal Blog Affordability Index (PABAI), a payment‑based affordability metric built from actual RMLS sales. PABAI incorporates weekly updates based on the prevailing 30‑year fixed mortgage rate, providing a locally grounded measure of housing affordability across the region.
Learn more → PABAI explainer • mortgage rate series • full author bio


