
About This Snapshot
This snapshot summarizes residential sales occurring within the official City of Maywood Park limits during calendar year 2025 (with some comparisons to calendar year 2024). While all four major housing segments were searched, Maywood Park only reported detached-home sales. Data are sourced from RMLS and have undergone a rigorous cleaning and validation process. For additional information regarding data cleaning procedures and common MLS data challenges, see the dedicated page: RMLS Data Accuracy Challenges.
Tables in this snapshot cover important metrics such as:
- Sales price to original list price: SP/OLP
- Price per square foot (total square footage): PPSF (TSF)
- Cumulative days on market: CDOM
- Average lot size in acres: ac
Market Overview
Located in northeast Multnomah County near the base of Rocky Butte, Maywood Park is one of the smallest incorporated cities in the Portland metropolitan area, encompassing approximately 0.2 square miles and fewer than 1,000 residents. Originally developed beginning in the late 1920s as a planned residential subdivision modeled after Portland’s Laurelhurst and Eastmoreland neighborhoods, the community developed a distinct identity separate from the surrounding Parkrose area.
Maywood Park incorporated in 1967 during efforts to prevent the construction of Interstate 205 through the neighborhood. Although the freeway was ultimately built and removed a portion of the original subdivision, the city retained its independent municipal status and remains entirely surrounded by Portland. Today, Maywood Park continues to function primarily as a small residential community with a unique history and clearly defined city boundaries.
Detached Homes Market Statistics
The following table compares detached-home sales activity occurring within Maywood Park city limits during 2024 and 2025. Metrics include the number of sales, total dollar volume, pricing, property characteristics, marketing times, and affordability.
| Category | 2024 | 2025 | Change |
|---|---|---|---|
| Total $ Volume | $3,309,800 | $4,813,899 | +45.44% |
| Average Price | $551,633 | $534,878 | -3.04% |
| Median Price | $584,950 | $499,999 | -14.52% |
| Avg SP/OLP | 93.26% | 98.19% | +4.93 pts |
| Avg PPSF (TSF) | $211.73 | $196.32 | -7.28% |
| Avg Total SF | 2,603 | 2,743 | +5.36% |
| Avg Lot Size (ac) | 0.1933 | 0.1933 | No Change |
| Avg Age (Yrs) | 88.17 | 87.33 | -0.83 years |
| Avg CDOM | 22.17 | 42.67 | +20.50 days |
| Total # of Sales | 6 | 9 | +3 homes |
| # of New Constr. | 0 | 0 | No Change |
| # Affordable | 1 | 1 | No Change |
| % Affordable | 16.67% | 11.11% | -5.56 pts |
| Min Required Income | $68,718 | $120,685 | +75.62% |
| Avg Required Income | $146,304 | $141,157 | -3.52% |
Single-Family Detached Residential | 2024 & 2025
Data: RMLS | PortlandAppraisalBlog.com
How affordability is defined: The Portland Appraisal Blog Affordability Index (PABAI) was used to evaluate affordability during the study period. PABAI calculates the income needed to buy each home using its actual reported price, taxes, HOA dues, and an insurance estimate, financed at the Freddie Mac 30-year rate in effect at the time of sale. A home is considered affordable if the required income does not exceed the HUD median family income for the Portland-Vancouver-Hillsboro MSA in effect at the time of sale.
With only 9 detached-home sales in 2025 and 6 in 2024, individual transactions exerted a meaningful influence on annual statistics. Total dollar volume increased 45.4%, largely reflecting the increase in sales activity rather than a substantial change in pricing. Average sale price declined just 3.0% year-over-year, while an investigation into individual transactions suggests the larger decline in median price was influenced by transaction mix. Most 2025 sales clustered near the $500,000 mark, whereas the smaller 2024 sample included a greater concentration of higher-priced transactions.
Affordability remained relatively stable. Although only 1 sale met the PABAI affordability threshold in each year, the average required household income declined slightly to approximately $141,000. While still above regional median family income levels, the affordability gap remained modest compared to many higher-priced Portland-area communities.
The detached housing stock that sold remained remarkably consistent between years. Average lot size was unchanged, average living area increased modestly, and the typical home sold was nearly 90 years old. No new-construction sales were reported in either year. Average cumulative days on market increased from 22 to 43 days; however, an investigation into individual transactions found that much of the increase was attributable to a single property that remained on the market for nearly 6 months. Excluding that sale, average marketing time would have been approximately 26 days.
Detached Homes Scatter Plot
The following scatter plot provides a visual overview of detached-home sales occurring during 2025. Each point represents a single sale and illustrates the relationship between sale price and total square footage, with dots sized by acreage.
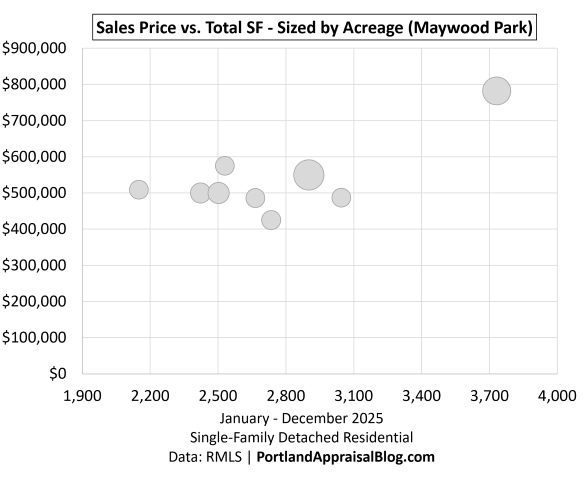
The 2025 detached-home market was remarkably compact, with 8 of 9 sales clustering within a relatively narrow range of home sizes and sale prices. A few properties featured larger-than-average lots, but only one sale stood apart from the rest of the market, closing at approximately $780,000 and establishing the upper end of the year’s price range.
Key Takeaways
Maywood Park’s housing market is best understood through the lens of scarcity. With fewer than 1,000 residents and only 9 residential sales during 2025, the city is one of the smallest housing markets in the Portland metropolitan area. Several months passed without a single residential sale, making it unsurprising that individual transactions exerted a meaningful influence on annual market statistics.
Although only 1 sale met affordability thresholds in both 2024 and 2025, the average required household income remained relatively close to regional median family income levels. While affordability challenges persist, the gap between the income required to purchase the average home and area median incomes was narrower than many buyers might expect based solely on the number of affordable sales.
Geography also helps distinguish Maywood Park from other small housing markets. Despite functioning as an independent city, it is entirely surrounded by Portland, providing residents with convenient access to employment centers, commercial services, parks, and transportation corridors throughout the metropolitan area. This combination of a small residential setting and close proximity to urban amenities continues to shape the community’s housing market.
Sources & Further Reading
All data presented in this housing market snapshot is sourced directly from RMLS and has been subjected to a rigorous cleaning and validation process to ensure reliability for single-family residential analysis for the City of Maywood Park. The trends, comparisons, and commentary are the result of original appraisal expertise and independent analysis—not aggregated from secondary sources or news summaries.
Boundary Definition: Analysis boundaries were established using the official Census Bureau map.
- RMLS Data Challenges: Portland Appraisal Blog
- The Portland Region – Six-County Market Area Overview: Portland Appraisal Blog
- HUD Portland-Vancouver-Hillsboro, OR-WA MSA: Median Family Income
- Portland Affordability Index – PABAI: A Realistic Housing Qualification Metric for the Portland Region: Portland Appraisal Blog
- Mortgage Rates & the Portland Region Housing Market: Portland Appraisal Blog
- City of Maywood Park: Census Bureau Map
- City of Maywood Park: 2020 Decennial Census Population
- City of Maywood Park: Official Website

Coda
Thanks for reading—I hope you found a useful insight or an unexpected nugget along the way. If you enjoyed the post, please consider subscribing for future updates.
Are you an agent in Portland who wonders why appraisers always do “x”?
A homeowner with questions about appraiser methodology?
If so, feel free to reach out—I enjoy connecting with market participants across Portland and the surrounding counties, and am always happy to help where I can.
And if you’re in need of appraisal services in Maywood Park or anywhere in the Portland Region, we’d be glad to assist.
About the Author — Abdur Abdul‑Malik, SRA, ASA
Abdur Abdul‑Malik is the founder, author, and publisher of the Portland Appraisal Blog, where he produces original regional and neighborhood‑level housing analytics for the Portland Region. He is a certified residential appraiser serving Oregon and Washington, drawing on RMLS transaction data, public records, and custom segmentation models he has built.
He developed the Portland Appraisal Blog Affordability Index (PABAI), a payment‑based affordability metric built from actual RMLS sales. PABAI incorporates weekly updates based on the prevailing 30‑year fixed mortgage rate, providing a locally grounded measure of housing affordability across the region.
Learn more → PABAI explainer • mortgage rate series • full author bio


