Portland Region Housing Affordability Snapshot – Rates Climb to 6.52% (June 11, 2026)

At today’s 6.52% mortgage rate, the monthly principal‑and‑interest payment on a Q1 2026 Portland Region median-priced detached home ($580,000) with 20% down is $2,939, up from $2,776 at February’s low. Lifetime interest rises to $594,004, and repricing all Q1 loans at today’s rate adds $169M in regional interest.

What Happened This Week

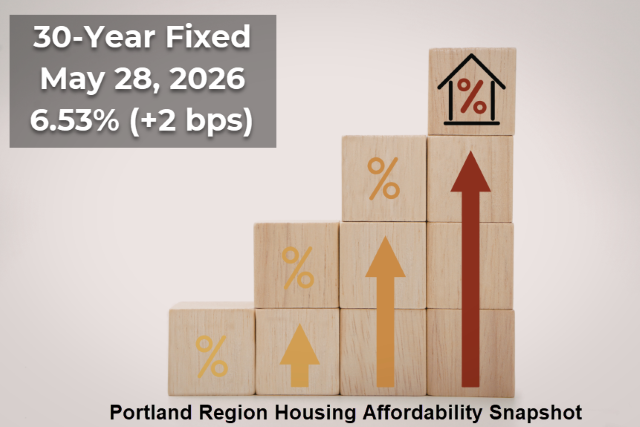
Mortgage rates inched higher this week, with the 30‑year fixed rising to 6.52%, up 4 bps from last week and now sitting just 1 basis point below the year‑to‑date high. The broader 2026 pattern remains unchanged: rates bottomed on March 5th, surged through early April, cooled briefly, and then turned upward again on April 23rd. With this week’s move, we are effectively back at the top of the 2026 range, and the spring cooldown remains firmly behind us.

Affordability continues to deteriorate at these elevated levels. Even a modest 4 bps increase carries weight when rates are this high, and monthly payments remain near their most challenging point of the year. As the charts below show, today’s rate sits right against the ceiling of the year‑to‑date range, and the PABAI reflects the compounding affordability pressure facing buyers across the Portland Region .

Mortgage Rate Context

Long‑Run View (Since 2000)
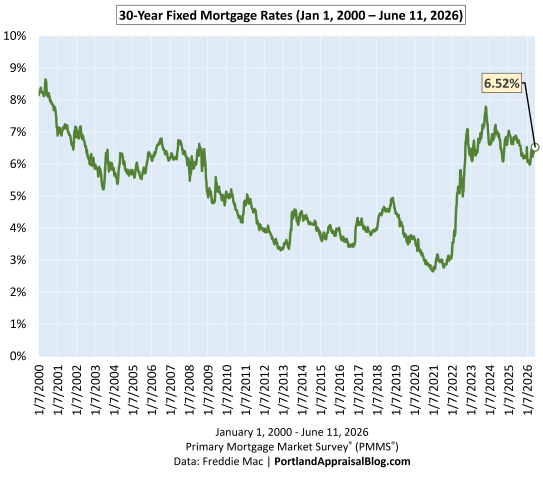
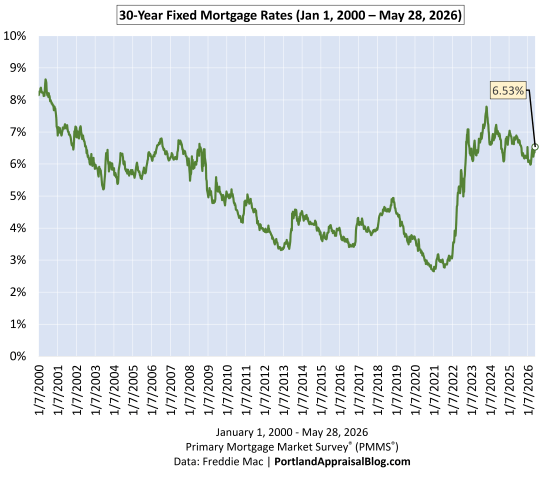
The long‑run chart shows how today’s rate fits into a 25‑year history of mortgage cycles. The early 2000s sat in the 6–8% range, the post‑Great Recession era brought a decade of unusually low rates, and the pandemic period pushed borrowing costs to historic lows. Years after leaving that ultra‑low‑rate environment, the market continues to adjust to more difficult financing constraints, and today’s 6.52% reflects that ongoing shift.

Medium‑Run View (Since COVID)
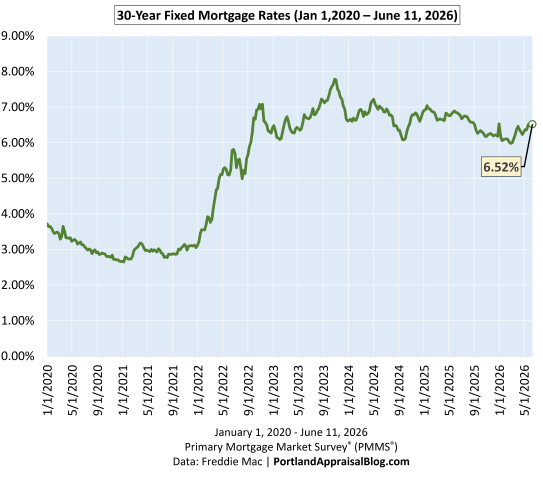
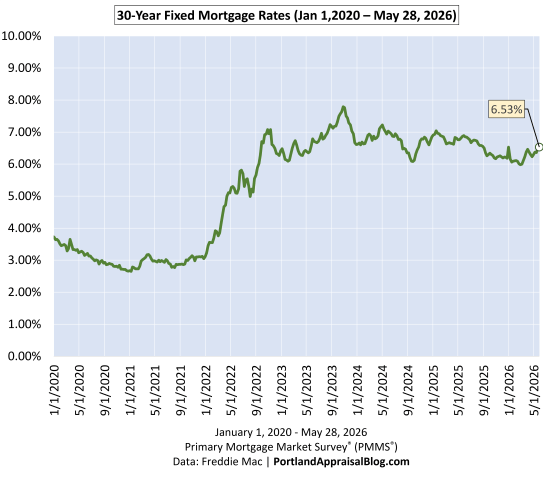
The COVID‑era chart highlights the dramatic rate compression of 2020–2021, the rapid surge of 2022, and the choppy plateau that has defined the past two years. Rates have been oscillating between roughly 6% and 7% since mid‑2023, and today’s 6.52% sits near the upper half of that band. Volatility has cooled compared to 2022, but the medium‑run trend remains one of elevated and persistent borrowing costs.

Short‑Run View (2026 YTD)
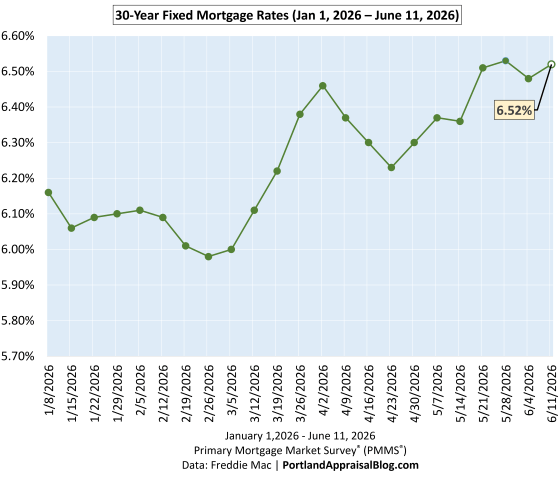
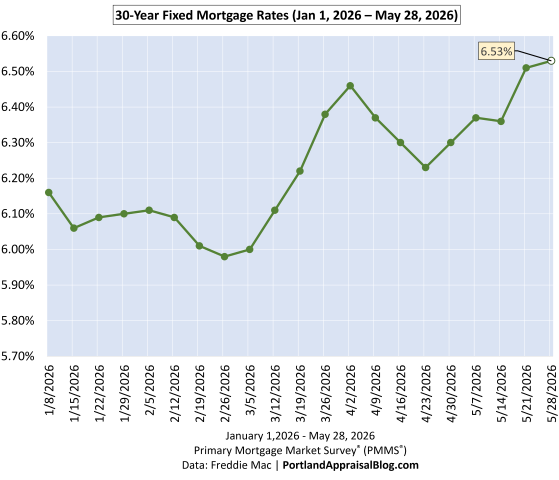
The year‑to‑date chart shows the full shape of the 2026 cycle: a clear bottom at 5.98% on February 26th, a sharp rise into early April, a brief cooldown, and a renewed climb that pushed rates to 6.53% in late May—the highest level of the year. This week’s reading of 6.52% keeps us essentially at that peak, and affordability remains near its weakest point of 2026. This short‑run pattern is the most relevant for buyers today, as it directly shapes monthly payments and qualifying power.

Portland Appraisal Blog Affordability Index (PABAI)

What PABAI Measures

The Portland Appraisal Blog Affordability Index (PABAI) measures how the average home close price compares to what a median‑income household can qualify for under standard lending assumptions (HUD Portland‑Vancouver‑Hillsboro MSA median income, 20% down, and a 28% DTI for principal, interest, taxes, insurance, and HOA dues).

Unlike national affordability indices, PABAI is built from actual RMLS transactions—all 3,349 detached sales for the Portland Region in Q1 2026—which allows for far more precise, locally grounded insights into Portland‑area affordability than any national model can provide.

A PABAI of 100 means the market is exactly affordable at that income level (the Q1 2026 HUD median MSA income was $124,100 for a family of four). Values above 100 indicate excess qualifying capacity (more affordable), while values below 100 indicate a shortfall (strained affordability). Full methodology and the interpretation scale are available on the PABAI explainer page.

PABAI RangeInterpretation
120+Strongly Affordable
100–119Moderately Affordable
80–99Strained
Below 80Severely Constrained

Q1 2026: Actual vs. Constant‑Rate Affordability

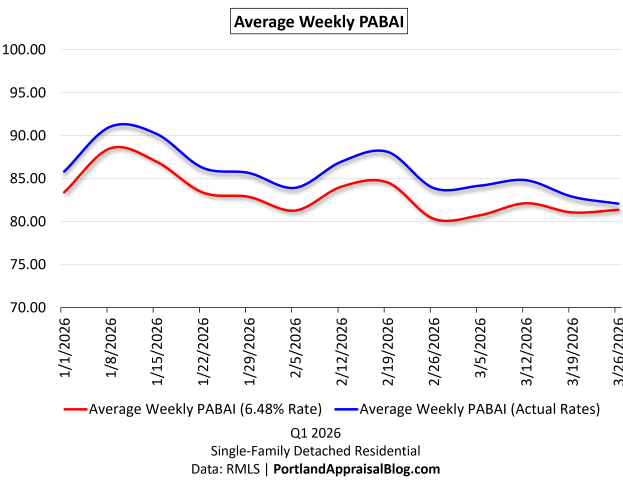
The Q1 chart compares two versions of PABAI: one using actual weekly mortgage rates, and one using today’s rate (6.52%) as a constant. Because the constant‑rate line uses a rate near the top of the 2026 range, it naturally sits below the actual‑rate line for most of the quarter. That part isn’t the story.

The key insight is the size and behavior of the gap between the two lines. Early in the quarter, actual rates were meaningfully lower than today’s rate, giving buyers more qualifying power than a flat‑rate environment would suggest. But as rates climbed through March and into April, the two lines began to converge—a visual confirmation of how persistent rate increases eroded affordability heading into spring. Today’s 6.52% rate keeps the constant‑rate line very close to the actual‑rate line at the end of Q1, reflecting the tightening affordability conditions that carried into mid‑ and late‑spring.

Structural Unaffordability and the Seasonal Pattern

Detached homes in the Portland Region remain structurally unaffordable to a household earning the HUD median MSA income. PABAI has been below 100 for years, and Q1 2026 continues that pattern. What the chart makes clear is that winter remains the best window for buyers on tight qualifying budgets: affordability improves when rates soften and seasonal pricing cools. As spring approaches, both rates and prices firm up, and affordability reliably compresses.

With the 30‑year fixed now sitting near the highest levels of 2026, the convergence of the two PABAI lines at the end of the quarter reflects the same reality: rising rates have pushed qualifying costs to their weakest point of the year, and the early‑year affordability advantage has largely evaporated.

Affordability Snapshot (This Week)

Q1 2026 Affordability Recomputed at Today’s Rate

The table below shows how Q1 2026 affordability metrics change when all 3,349 detached sales are recalculated at this week’s 6.52% rate. This is the clearest way to see how rising rates reshape qualifying power, housing burden, and the share of homes accessible to a median‑income household.

Because today’s rate sits near the top of the 2026 range, the recomputed metrics show a meaningful deterioration in affordability relative to the actual Q1 environment. Required income rises, housing burden increases, and the number of homes affordable to a median‑income household falls sharply—a direct reflection of how even small rate increases compound at elevated levels.

MetricActual Q1 2026 RatesRecomputed at 6.52% RateChange
Average PABAI85.4582.47-2.98 pts
Required income (28% ratio)$145,236$150,470+3.60%
Median‑income shortfall17.03%21.25%+4.22 pts
Avg monthly mortgage pmt$3,932.66$4,072.87+$140.21
Avg housing burden (DTI)38.03%39.38%+1.35 pts
# of Affordable homes967835-132 homes
% of homes affordable28.87%24.93%-3.94 pts
Single-family Detached | Q1 2026
HUD Portland‑Vancouver‑Hillsboro MSA median income: $124,100
Data: RMLS (3,349 observations) | PortlandAppraisalBlog.com

How Rising Rates Reshape Affordability

Taken together, these metrics show how quickly affordability erodes when rates rise into the mid‑6% range. The drop in Average PABAI from 85.45 to 82.47 may look modest at first glance, but it represents a meaningful tightening of qualifying power across the entire detached market. Required income rises to roughly $150,500, widening the gap between what a median‑income household earns and what the market demands. That shortfall now approaches 21.3%, a reminder that the typical Portland household remains well outside traditional affordability thresholds.

The payment side tells the same story. Recomputing Q1 sales at today’s rate pushes the average monthly mortgage obligation up by about $140, which may seem incremental on a monthly basis but compounds sharply over a 30‑year horizon. More importantly, the higher rate pushes the average front‑end DTI from 38.03% to 39.38%, a level that would be considered stretched even in more forgiving underwriting environments. These shifts are not abstract; they directly shape who can buy, what they can buy, and how competitive they can be.

The Buyer‑Side Impact

The most visible consequence of these changes is the shrinking pool of homes accessible to a median‑income household. Under actual Q1 2026 rates, 967 detached homes were affordable; at today’s rate, that number falls to 835. In percentage terms, the share of the market within reach drops from about 28.9% to 24.9%—a loss of nearly four percentage points in a single recalculation. This is the practical expression of rising rates: fewer viable options, tighter qualifying margins, and a market that becomes increasingly selective about who can participate.

For buyers, the experience varies by circumstance but the direction is the same. Households with limited flexibility feel the tightening most acutely, as even small rate movements can eliminate entire segments of the market. Move‑up buyers face a widening payment gap between their current home and the next one, making the trade‑up calculus more difficult unless equity is substantial. Cash buyers, by contrast, gain relative leverage as financed demand thins—though that advantage is uneven across price tiers.

Across all buyer types, the message is consistent: rising rates are reshaping the market in real time, and the affordability landscape at a 6.52% mortgage rate is meaningfully different from the one buyers faced just a few months ago.

The Seller‑Side Impact

Rising rates don’t just reshape the buyer experience—they influence seller outcomes as well. In the 2025 detached market, cumulative days on market (CDOM) increased 11.09%, and the current rate environment suggests that upward pressure on market times may persist. As affordability tightens and the pool of qualified buyers shrinks, homes that would have moved quickly in a lower‑rate environment may begin to sit longer, particularly in segments where pricing is already stretched. This doesn’t imply an abrupt market shutdown, but it does mean sellers need to price with greater precision and expect a more selective buyer pool as 2026 progresses.

TIP: Total Interest Paid — Why Small Rate Moves Matter

Total Interest Paid (TIP) is one of the clearest ways to understand how mortgage rates shape long‑run affordability. While buyers shop based on monthly payment, the lifetime cost of borrowing moves far more dramatically than the payment itself. Even small rate changes can add—or remove—tens of thousands of dollars in interest over the life of a loan.

At today’s 6.52% rate, the lifetime interest on a standard Portland‑area purchase sits far above the levels buyers saw during the pandemic and meaningfully higher than the early‑March lows of this year. The difference between a 5.98% environment and a 6.52% environment may feel subtle on a monthly basis, but over 30 years it compounds into a substantial increase in total repayment.

This is why TIP matters: it captures the hidden cost of rising rates. Buyers feel the payment, but the long‑run financial burden is embedded in the interest curve. As the charts below show, the 2026 rate path has pushed TIP to some of the highest levels of the year, even as the monthly payment has moved more gradually.

2026 YTD Total Interest Paid
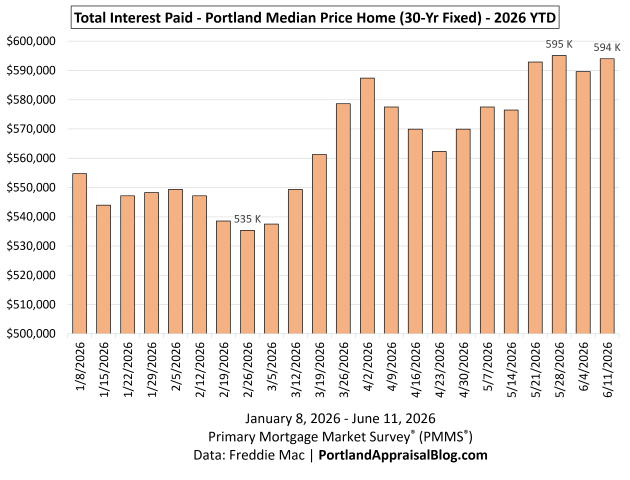
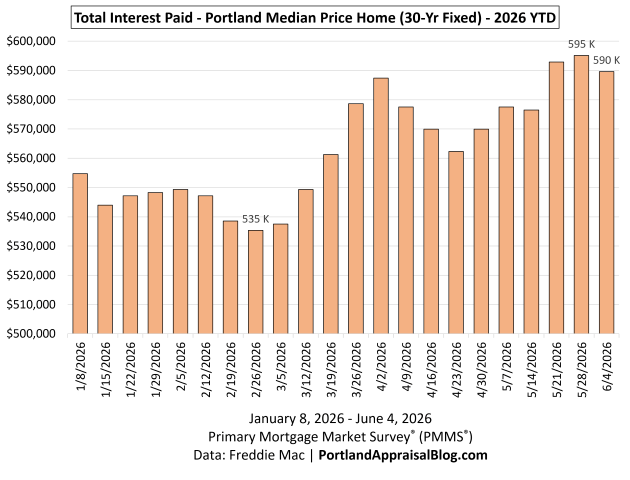
The 2026 YTD TIP chart shows how sharply lifetime borrowing costs have moved as rates climbed through the first half of the year. These calculations are based on the total interest a buyer would pay on the Q1 2026 Portland median‑priced home of $580,000, assuming a 20% down payment and applying the rate effective in each week. This isolates the impact of rate movements alone, holding price and loan structure constant.

The low point came on February 26th, when a 5.98% mortgage rate produced a total interest burden of $535,342. As rates rose through March and into late May, TIP increased steadily, reaching a year‑to‑date high of $595,104 at the 6.53% rate on May 28th. That’s nearly a $60,000 increase in lifetime interest in just three months, driven entirely by rate movement.

This week’s 6.52% rate nudges TIP slightly off the peak, by a single basis point: the total interest burden at today’s rate is $594,004. The shape of the chart makes the pattern unmistakable—at today’s price levels, even small rate changes translate into large long‑run cost differences. Buyers feel the monthly payment, but the lifetime interest curve is where the true financial impact of rising rates becomes visible.

TIP per $1 Borrowed
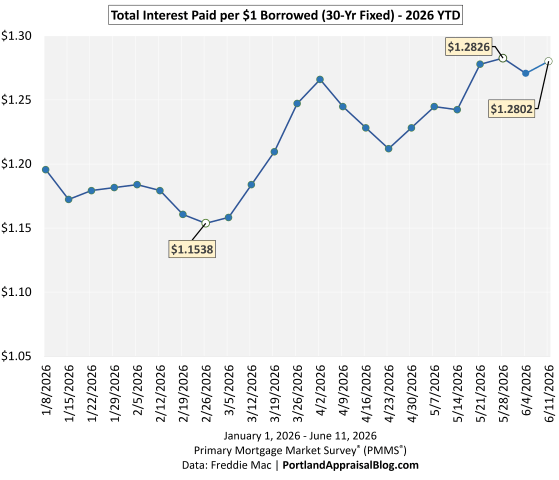
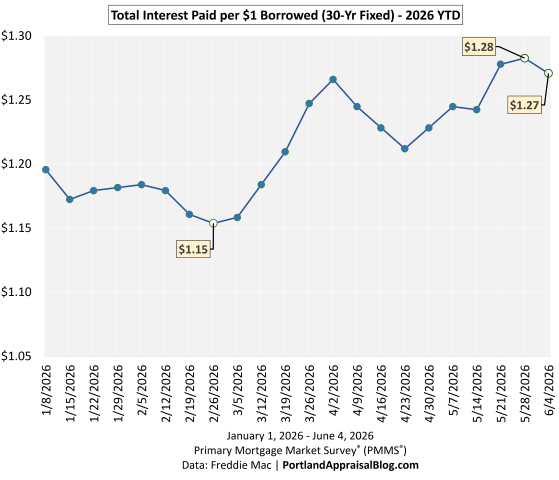
The TIP‑per‑$1 chart shows how much interest a buyer pays for every dollar borrowed at different mortgage rates. This is the clearest way to visualize the rate sensitivity of long‑run borrowing costs. At the year‑to‑date low of 5.98%, each dollar borrowed generated about $1.15 in interest over the life of the loan. As rates climbed through the spring, that figure rose steadily, reaching $1.2826 at the late‑May peak of 6.53%. Today’s 6.52% rate places the cost at $1.2802 per $1 borrowed, only slightly below the YTD high.

Regional Interest Delta (RID)

The Regional Interest Delta (RID) models how much total lifetime interest the Portland Region’s Q1 detached‑home buyers would collectively pay when mortgage rates shift. To keep the metric consistent, RID assumes that all 3,349 Q1 detached sales were financed under standard 20%‑down, 30‑year conventional underwriting, even though the actual dataset includes cash purchases and loans under FHA, VA, jumbo, and other programs. Rates are matched to each home’s close date to reflect the real timing of rate movements, but individual buyers may have locked slightly different rates depending on their specific loan terms. This approach provides a clean, apples‑to‑apples way to measure how rate changes affect the region’s total interest burden.

ScenarioRateTotal Lifetime InterestRID
Actual Q1 2026 PipelineActual rate matched to close date$2,091,901,976—
Modeled at Today’s Rate6.52%$2,260,954,353+$169,052,377
Single-family Detached | Q1 2026
Data: RMLS (3,349 observations) | PortlandAppraisalBlog.com

Using those actual matched rates, the region’s Q1 2026 pipeline will generate $2,091,901,976 in lifetime interest. Recomputing the same loans at today’s 6.52% rate increases the total to $2,260,954,353. The difference—the RID—is $169,052,377 in additional lifetime interest.

To put that number in perspective: $152 million is the cost of hollywoodHUB, a 222‑unit affordable housing development in Portland. A single rate shift—applied across one quarter’s mortgage activity—creates a lifetime interest delta more than building an entire affordable housing project from the ground up.

RID makes the scale of rate movements unmistakable. What looks like a modest rate change at the household level becomes a nine‑figure regional impact when applied across thousands of loans.

Payment Delta

The Payment Delta shows how monthly affordability shifts as mortgage rates move. Using the Q1 2026 Portland median‑priced home of $580,000 with a 20% down payment, the monthly principal‑and‑interest payment changes meaningfully even with small rate movements.

DateRateMonthly P&I
Feb 26, 20265.98%$2,775.95
May 28, 20266.53%$2,941.96
Jun 11, 20266.52%$2,938.90
Monthly payment for home using median Q1 2026 price ($580,000) and 20% down.
Primary Mortgage Market Survey® (PMMS®)
Data: Freddie Mac | PortlandAppraisalBlog.com

From the YTD low to the late‑May peak, the monthly payment increased by $166, and today’s payment remains $163 higher than the February low.

While the Payment Delta is smaller in scale than the lifetime interest changes shown in TIP and RID, it is the number buyers feel most immediately. For households shopping at the lower end of the market, even a $150–$175 shift can meaningfully affect qualifying ratios, required down payment, or even which housing types remain viable—such as moving from detached homes to attached or condos. These adjustments often matter more for affordability‑sensitive buyers than for the broader market.

Closing Thoughts

The story of this week is straightforward: mortgage rates remain elevated, and the effects are visible across every major affordability metric. The PABAI continues to signal structural strain for median‑income households, and the recalculated Q1 data shows how even modest rate movements reshape qualifying power, monthly payments, and the share of homes within reach. The TIP and RID visuals make the pattern clear: higher rates don’t just affect individual buyers—they reshape the long‑run financial burden carried across the entire region.

For buyers, the takeaway is that financing conditions remain tight as we move into early summer. Winter continues to offer the best affordability window, but today’s rate environment means households on the margin feel pressure sooner and more sharply than in prior years. Even a $150–$175 shift in the Payment Delta can influence qualifying ratios, required down payment, or which housing types remain viable.

For sellers, the implications are more subtle but no less real. Last year’s detached market saw CDOM rise more than 11%, and the current rate backdrop suggests that upward pressure on market times may persist. A smaller pool of qualified buyers and higher monthly payments can translate into longer exposure, especially for homes priced aggressively or positioned in segments where affordability is already stretched. Pricing discipline and realistic expectations matter more in this environment than they did during the ultra‑low‑rate era.

As always, the Portland market adapts—sometimes quickly, sometimes reluctantly—but the direction of travel is clear. Higher rates are reshaping both sides of the transaction, and the early summer of 2026 is operating under some of the most constrained financing conditions we’ve seen this year.

Sources & Further Reading

All data presented in this weekly mortgage rate update is based on the Q1 2026 detached homes segment. The data is sourced directly from RMLS and has been subjected to rigorous cleaning and validation processes to ensure reliability for detached single-family residential analysis in the six-county Portland Region. The trends, comparisons, and commentary are the result of original appraisal expertise and independent analysis—not aggregated from secondary sources or news summaries.

Coda

Thanks for reading—I hope you found a useful insight or an unexpected nugget along the way. If you enjoyed the post, please consider subscribing for future updates.

Are you an agent in Portland who wonders why appraisers always do “x”?

A homeowner with questions about appraiser methodology?

If so, feel free to reach out—I enjoy connecting with market participants across Portland and the surrounding counties, and am always happy to help where I can.

And if you’re in need of appraisal services in Portland or anywhere in the Portland Region, we’d be glad to assist.

About the Author — Abdur Abdul‑Malik, SRA, ASA

Abdur Abdul‑Malik is the founder, author, and publisher of the Portland Appraisal Blog, where he produces original regional and neighborhood‑level housing analytics for the Portland Region. He is a certified residential appraiser serving Oregon and Washington, drawing on RMLS transaction data, public records, and custom segmentation models he has built.

He developed the Portland Appraisal Blog Affordability Index (PABAI), a payment‑based affordability metric built from actual RMLS sales. PABAI incorporates weekly updates based on the prevailing 30‑year fixed mortgage rate, providing a locally grounded measure of housing affordability across the region.

Learn more → PABAI explainer • mortgage rate series • full author bio
Portland Region Housing Affordability Snapshot – Rates Dip to 6.48% (June 4, 2026)

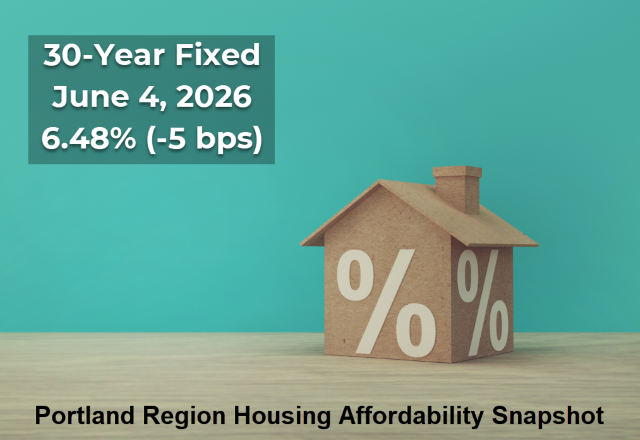
At today’s 6.48% mortgage rate, the monthly principal‑and‑interest payment on a Q1 2026 Portland Region median-priced detached home ($580,000) with 20% down is $2,926, up from $2,776 at February’s low. Lifetime interest rises to $589,610, and repricing all Q1 loans at today’s rate adds $152M in regional interest.

What Happened This Week

Mortgage rates eased slightly this week, with the 30‑year fixed slipping to 6.48% from last week’s 6.53%. It’s only a five‑basis‑point move, but it breaks the late‑May surge that pushed rates to their highest level of 2026. The broader pattern remains intact: rates bottomed at 5.98% on February 26th, climbed steadily through March, spiked sharply into early April, and then oscillated in a tight band before pushing to new highs in late May. Today’s reading pulls us just off the peak, but we’re still operating near the top of the year‑to‑date range.

Affordability remains strained despite the modest improvement. Monthly payments are still far above their late‑February lows, and qualifying costs remain among the toughest of the year. As the charts below show, today’s rate sits only a hair below last week’s high, and the PABAI continues to reflect a challenging affordability environment for the Portland Region as we move into June.

Mortgage Rate Context

Long‑Run View (Since 2000)

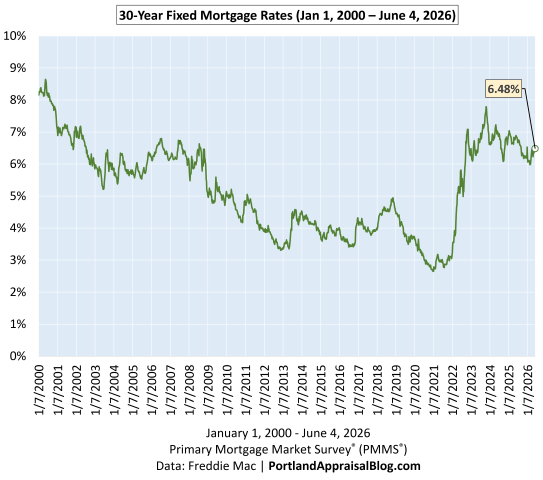
The long‑run chart shows how today’s rate fits into a 25‑year history of mortgage cycles. The early 2000s sat in the 6–8% range, the post‑Great Recession era brought a decade of unusually low rates, and the pandemic period pushed borrowing costs to historic lows. Years after leaving that ultra‑low‑rate environment, the market continues to adjust to more difficult financing constraints, and today’s 6.48% reflects that ongoing shift.

Medium‑Run View (Since COVID)

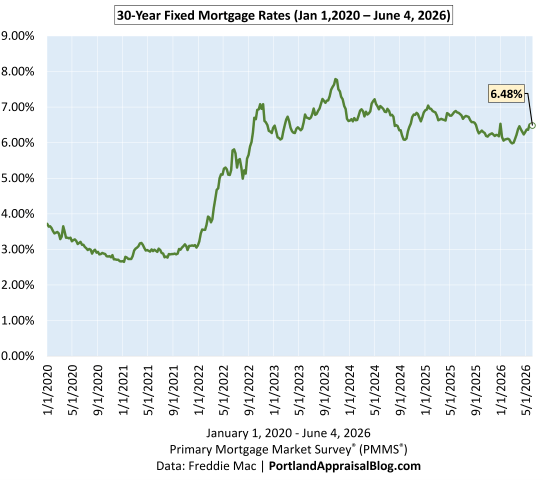
The COVID‑era chart highlights the dramatic rate compression of 2020–2021, the rapid surge of 2022, and the choppy plateau that has defined the past two years. Rates have been oscillating between roughly 6% and 7% since mid‑2023, and today’s 6.48% sits near the middle of that band. Volatility has cooled compared to 2022, but the medium‑run trend remains one of elevated and persistent borrowing costs.

Short‑Run View (2026 YTD)

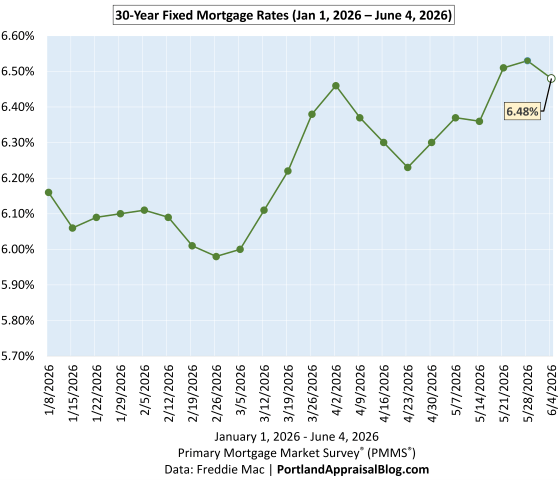
The year‑to‑date chart shows the full shape of the 2026 cycle: a clear bottom at 5.98% on February 26th, a sharp rise into early April, a brief cooldown, and a renewed climb that pushed rates to 6.53% last week—the highest level of the year. This week’s dip to 6.48% pulls us slightly off that peak, but affordability remains near its weakest point of 2026. This short‑run pattern is the most relevant for buyers today, as it directly shapes monthly payments and qualifying power.

Portland Appraisal Blog Affordability Index (PABAI)

What PABAI Measures

The Portland Appraisal Blog Affordability Index (PABAI) measures how the average home close price compares to what a median‑income household can qualify for under standard lending assumptions (HUD Portland‑Vancouver‑Hillsboro MSA median income, 20% down, and a 28% DTI for principal, interest, taxes, insurance, and HOA dues).

Unlike national affordability indices, PABAI is built from actual RMLS transactions—all 3,349 detached sales for the Portland Region in Q1 2026—which allows for far more precise, locally grounded insights into Portland‑area affordability than any national model can provide.

A PABAI of 100 means the market is exactly affordable at that income level (the Q1 2026 HUD median MSA income was $124,100 for a family of four). Values above 100 indicate excess qualifying capacity (more affordable), while values below 100 indicate a shortfall (strained affordability). Full methodology and the interpretation scale are available on the PABAI explainer page.

PABAI RangeInterpretation
120+Strongly Affordable
100–119Moderately Affordable
80–99Strained
Below 80Severely Constrained

Q1 2026: Actual vs. Constant‑Rate Affordability

The Q1 chart compares two versions of PABAI: one using actual weekly mortgage rates, and one using today’s rate (6.48%) as a constant. Because the constant‑rate line uses a rate near the top of the 2026 range, it naturally sits below the actual‑rate line for most of the quarter. That part isn’t the story.

The key insight is the size and behavior of the gap between the two lines. Early in the quarter, actual rates were meaningfully lower than today’s rate, giving buyers more qualifying power than a flat‑rate environment would suggest. But as rates climbed through March and into April, the two lines began to converge—a visual confirmation of how persistent rate increases eroded affordability heading into spring. Today’s 6.48% rate keeps the constant‑rate line close to the actual‑rate line at the end of Q1, reflecting the tightening affordability conditions that carried into mid to late spring.

Structural Unaffordability and the Seasonal Pattern

Detached homes in the Portland Region remain structurally unaffordable to a household earning the HUD median MSA income. PABAI has been below 100 for years, and Q1 2026 continues that pattern. What the chart makes clear is that winter remains the best window for buyers on tight qualifying budgets: affordability improves when rates soften and seasonal pricing cools. As spring approaches, both rates and prices firm up, and affordability reliably compresses.

With the 30‑year fixed now sitting near the highest levels of 2026, the convergence of the two PABAI lines at the end of the quarter reflects the same reality: rising rates have pushed qualifying costs to their weakest point of the year, and the early‑year affordability advantage has largely evaporated.

Affordability Snapshot (This Week)

Q1 2026 Affordability Recomputed at Today’s Rate

The table below shows how Q1 2026 affordability metrics change when all 3,349 detached sales are recalculated at this week’s 6.48% rate. This is the clearest way to see how rising rates reshape qualifying power, housing burden, and the share of homes accessible to a median‑income household.

MetricActual Q1 2026 RatesRecomputed at 6.48% RateChange
Average PABAI85.4582.76-2.69 pts
Required income (28% ratio)$145,236$149,955+3.25%
Median‑income shortfall17.03%20.83%+3.80 pts
Avg monthly mortgage pmt$3,932.66$4,056.00+$123.34
Avg housing burden (DTI)38.03%39.25%+1.22 pts
# of Affordable homes967845-122 homes
% of homes affordable28.87%25.23%-3.64 pts
Single-family Detached | Q1 2026
HUD Portland‑Vancouver‑Hillsboro MSA median income: $124,100
Data: RMLS (3,349 observations) | PortlandAppraisalBlog.com

How Rising Rates Reshape Affordability

Taken together, these metrics show how quickly affordability erodes when rates rise into the mid‑6% range. The drop in Average PABAI from 85.45 to 82.76 may look modest at first glance, but it represents a meaningful tightening of qualifying power across the entire detached market. Required income rises to nearly $150,000, widening the gap between what a median‑income household earns and what the market demands. That shortfall now approaches 21%, a reminder that the typical Portland household remains well outside traditional affordability thresholds.

The payment side tells the same story. Recomputing Q1 sales at today’s rate pushes the average monthly mortgage obligation up by roughly $123, which may seem incremental on a monthly basis but compounds sharply over a 30‑year horizon. More importantly, the higher rate pushes the average front‑end DTI from 38.03% to 39.25%, a level that would be considered stretched even in more forgiving underwriting environments. These shifts are not abstract; they directly shape who can buy, what they can buy, and how competitive they can be.

The Buyer‑Side Impact

The most visible consequence of these changes is the shrinking pool of homes accessible to a median‑income household. Under actual Q1 2026 rates, 967 detached homes were affordable; at today’s rate, that number falls to 845. In percentage terms, the share of the market within reach drops from 28.9% to 25.2%—a loss of more than three and a half percentage points in a single recalculation. This is the practical expression of rising rates: fewer viable options, tighter qualifying margins, and a market that becomes increasingly selective about who can participate.

For buyers, the experience varies by circumstance but the direction is the same. Households with limited flexibility feel the tightening most acutely, as even small rate movements can eliminate entire segments of the market. Move‑up buyers face a widening payment gap between their current home and the next one, making the trade‑up calculus more difficult unless equity is substantial. Cash buyers, by contrast, gain relative leverage as financed demand thins—though that advantage is uneven across price tiers.

Across all buyer types, the message is consistent: rising rates are reshaping the market in real time, and the affordability landscape at a 6.48% mortgage rate is meaningfully different from the one buyers faced just a few months ago.

The Seller‑Side Impact

Rising rates don’t just reshape the buyer experience—they influence seller outcomes as well. In the 2025 detached market, cumulative days on market (CDOM) increased 11.09%, and the current rate environment suggests that upward pressure on market times may persist. As affordability tightens and the pool of qualified buyers shrinks, homes that would have moved quickly in a lower‑rate environment may begin to sit longer, particularly in segments where pricing is already stretched. This doesn’t imply an abrupt market shutdown, but it does mean sellers need to price with greater precision and expect a more selective buyer pool as 2026 progresses.

TIP: Total Interest Paid — Why Small Rate Moves Matter

Total Interest Paid (TIP) is one of the clearest ways to understand how mortgage rates shape long‑run affordability. While buyers shop based on monthly payment, the lifetime cost of borrowing moves far more dramatically than the payment itself. Even small rate changes can add—or remove—tens of thousands of dollars in interest over the life of a loan.

At today’s 6.48% rate, the lifetime interest on a standard Portland‑area purchase sits far above the levels buyers saw during the pandemic and meaningfully higher than the early‑March lows of this year. The difference between a 5.98% environment and a 6.48% environment may feel subtle on a monthly basis, but over 30 years it compounds into a substantial increase in total repayment.

This is why TIP matters: it captures the hidden cost of rising rates. Buyers feel the payment, but the long‑run financial burden is embedded in the interest curve. As the charts below show, the 2026 rate path has pushed TIP to some of the highest levels for the year, even as the monthly payment has moved more gradually.

2026 YTD Total Interest Paid

The 2026 YTD TIP chart shows how sharply lifetime borrowing costs have moved as rates climbed through the first half of the year. These calculations are based on the total interest a buyer would pay on the Q1 2026 Portland median‑priced home of $580,000, assuming a 20% down payment and applying the rate effective in each week. This isolates the impact of rate movements alone, holding price and loan structure constant.

The low point came on February 26th, when a 5.98% mortgage rate produced a total interest burden of $535,342. As rates rose through March and into late May, TIP increased steadily, reaching a year‑to‑date high of $595,104 at the 6.53% rate on May 28th. That’s nearly a $60,000 increase in lifetime interest in just three months, driven entirely by rate movement.

This week’s 6.48% rate pulls TIP slightly off the peak, but only marginally: the total interest burden at today’s rate is $589,610. The shape of the chart makes the pattern unmistakable—at today’s price levels, even small rate changes translate into large long‑run cost differences. Buyers feel the monthly payment, but the lifetime interest curve is where the true financial impact of rising rates becomes visible.

TIP per $1 Borrowed

The TIP‑per‑$1 chart shows how much interest a buyer pays for every dollar borrowed at different mortgage rates. This is the clearest way to visualize the rate sensitivity of long‑run borrowing costs. At the year‑to‑date low of 5.98%, each dollar borrowed generated about $1.15 in interest over the life of the loan. As rates climbed through the spring, that figure rose steadily, reaching $1.28 at the late‑May peak of 6.53%. Today’s 6.48% rate places the cost at $1.27 per $1 borrowed, only slightly below the YTD high.

Regional Interest Delta (RID)

The Regional Interest Delta (RID) models how much total lifetime interest the Portland Region’s Q1 detached‑home buyers would collectively pay when mortgage rates shift. To keep the metric consistent, RID assumes that all 3,349 Q1 detached sales were financed under standard 20%‑down, 30‑year conventional underwriting, even though the actual dataset includes cash purchases and loans under FHA, VA, jumbo, and other programs. Rates are matched to each home’s close date to reflect the real timing of rate movements, but individual buyers may have locked slightly different rates depending on their specific loan terms. This approach provides a clean, apples‑to‑apples way to measure how rate changes affect the region’s total interest burden.

ScenarioRateTotal Lifetime InterestRID
Actual Q1 2026 PipelineActual rate matched to close date$2,091,901,976—
Modeled at Today’s Rate6.48%$2,244,228,907+$152,326,931
Single-family Detached | Q1 2026
Data: RMLS (3,349 observations) | PortlandAppraisalBlog.com

Using those actual matched rates, the region’s Q1 2026 pipeline will generate $2,091,901,976 in lifetime interest. Recomputing the same loans at today’s 6.48% rate increases the total to $2,244,228,907. The difference—the RID—is $152,326,931 in additional lifetime interest.

To put that number in perspective: $152 million is the cost of hollywoodHUB, a 222‑unit affordable housing development in Portland. A single rate shift—applied across one quarter’s mortgage activity—creates a lifetime interest delta equivalent to building an entire affordable housing project from the ground up.

RID makes the scale of rate movements unmistakable. What looks like a modest rate change at the household level becomes a nine‑figure regional impact when applied across thousands of loans.

Payment Delta

The Payment Delta shows how monthly affordability shifts as mortgage rates move. Using the Q1 2026 Portland median‑priced home of $580,000 with a 20% down payment, the monthly principal‑and‑interest payment changes meaningfully even with small rate movements.

DateRateMonthly P&I
Feb 26, 20265.98%$2,775.95
May 28, 20266.53%$2,941.96
Jun 4, 20266.48%$2,926.70
Monthly payment for home using median Q1 2026 price ($580,000) and 20% down.
Primary Mortgage Market Survey® (PMMS®)
Data: Freddie Mac | PortlandAppraisalBlog.com

From the YTD low to the late‑May peak, the monthly payment increased by $166, and today’s payment remains $151 higher than the February low.

While the Payment Delta is smaller in scale than the lifetime interest changes shown in TIP and RID, it is the number buyers feel most immediately. For households shopping at the lower end of the market, even a $150–$175 shift can meaningfully affect qualifying ratios, required down payment, or even which housing types remain viable—such as moving from detached homes to attached or condos. These adjustments often matter more for affordability‑sensitive buyers than for the broader market.

Closing Thoughts

The story of this week is straightforward: mortgage rates remain elevated, and the effects are visible across every major affordability metric. The PABAI continues to signal structural strain for median‑income households, and the recalculated Q1 data shows how even modest rate movements reshape qualifying power, monthly payments, and the share of homes within reach. The TIP and RID visuals make the pattern clear: higher rates don’t just affect individual buyers—they reshape the long‑run financial burden carried across the entire region.

For buyers, the takeaway is that financing conditions remain tight as we move into early summer. Winter continues to offer the best affordability window, but today’s rate environment means households on the margin feel pressure sooner and more sharply than in prior years. Even a $150–$175 shift in the Payment Delta can influence qualifying ratios, required down payment, or which housing types remain viable.

For sellers, the implications are more subtle but no less real. Last year’s detached market saw CDOM rise more than 11%, and the current rate backdrop suggests that upward pressure on market times may persist. A smaller pool of qualified buyers and higher monthly payments can translate into longer exposure, especially for homes priced aggressively or positioned in segments where affordability is already stretched. Pricing discipline and realistic expectations matter more in this environment than they did during the ultra‑low‑rate era.

As always, the Portland market adapts—sometimes quickly, sometimes reluctantly—but the direction of travel is clear. Higher rates are reshaping both sides of the transaction, and the early summer of 2026 is operating under some of the most constrained financing conditions we’ve seen this year.

Sources & Further Reading

All data presented in this weekly mortgage rate update is based on the Q1 2026 detached homes segment. The data is sourced directly from RMLS and has been subjected to rigorous cleaning and validation processes to ensure reliability for detached single-family residential analysis in the six-county Portland Region. The trends, comparisons, and commentary are the result of original appraisal expertise and independent analysis—not aggregated from secondary sources or news summaries.

Coda

Thanks for reading—I hope you found a useful insight or an unexpected nugget along the way. If you enjoyed the post, please consider subscribing for future updates.

Are you an agent in Portland who wonders why appraisers always do “x”?

A homeowner with questions about appraiser methodology?

If so, feel free to reach out—I enjoy connecting with market participants across Portland and the surrounding counties, and am always happy to help where I can.

And if you’re in need of appraisal services in Portland or anywhere in the Portland Region, we’d be glad to assist.

About the Author — Abdur Abdul‑Malik, SRA, ASA

Abdur Abdul‑Malik is the founder, author, and publisher of the Portland Appraisal Blog, where he produces original regional and neighborhood‑level housing analytics for the Portland Region. He is a certified residential appraiser serving Oregon and Washington, drawing on RMLS transaction data, public records, and custom segmentation models he has built.

He developed the Portland Appraisal Blog Affordability Index (PABAI), a payment‑based affordability metric built from actual RMLS sales. PABAI incorporates weekly updates based on the prevailing 30‑year fixed mortgage rate, providing a locally grounded measure of housing affordability across the region.

Learn more → PABAI explainer • mortgage rate series • full author bio
Portland Region Housing Affordability Snapshot – Rates Rise to 6.53% (May 28, 2026)

With the 30‑year fixed rising to a 2026 high of 6.53% on May 28, structural affordability in the Portland region declined across every PABAI metric. This rate peak directly raised monthly payments and required incomes, squeezing 136 homes out of reach within the Q1 detached housing dataset for median-income households.

What Happened This Week

Mortgage rates climbed again this week to 6.53%, marking the third straight weekly increase. The broader 2026 pattern is now clear: rates bottomed on March 5th, surged sharply through early April, cooled briefly, and then reversed course on April 23rd. With this week’s move, we are now sitting at the highest 30‑year fixed rate of the year, and the spring cooldown is definitively over.

Affordability has deteriorated in step with these increases. Monthly payments are now higher than at any point in 2026, and the upward pressure on rates has pushed qualifying costs well above their early‑March lows. As the charts below show, today’s rate sits at the top of the year‑to‑date range, and the PABAI reflects a worsening affordability trend for the Portland Region as we move deeper into the spring market.

Mortgage Rate Context

Long‑Run View (Since 2000)

The long‑run chart shows how today’s rate fits into a 25‑year history of mortgage cycles. The early 2000s sat in the 6–8% range, the post‑Great Recession era brought a decade of unusually low rates, and the pandemic period pushed borrowing costs to historic lows. Years after leaving that ultra‑low‑rate environment, the market continues to adjust to more difficult financing constraints, and today’s 6.53% reflects that ongoing shift.

Medium‑Run View (Since COVID)

The COVID‑era chart highlights the dramatic rate compression of 2020–2021, the rapid surge of 2022, and the choppy plateau that has defined the past two years. Rates have been oscillating between roughly 6% and 7% since mid‑2023, and the recent climb places today’s rate near the upper end of that band. Volatility has cooled compared to 2022, but the medium‑run trend remains one of elevated and persistent borrowing costs.

Short‑Run View (2026 YTD)

The year‑to‑date chart shows the full shape of the 2026 cycle: a clear bottom on March 5th, a sharp rise into early April, a brief cooldown, and a reversal beginning April 23rd. With this week’s increase, the 30‑year fixed now sits at its highest level of the year, and the upward pressure has pushed affordability to its weakest point of 2026. This short‑run pattern is the most relevant for buyers today, as it directly shapes monthly payments and qualifying power.

Portland Appraisal Blog Affordability Index (PABAI)

What PABAI Measures

The Portland Appraisal Blog Affordability Index (PABAI) measures how the average home close price compares to what a median‑income household can qualify for under standard lending assumptions (HUD Portland‑Vancouver‑Hillsboro MSA median income, 20% down, and a 28% DTI for principal, interest, taxes, insurance, and HOA dues).

Unlike national affordability indices, PABAI is built from actual RMLS transactions—all 3,349 detached sales for the Portland Region in Q1 2026—which allows for far more precise, locally grounded insights into Portland‑area affordability than any national model can provide.

A PABAI of 100 means the market is exactly affordable at that income level (the Q1 2026 HUD median MSA income was $124,100 for a family of four). Values above 100 indicate excess qualifying capacity (more affordable), while values below 100 indicate a shortfall (strained affordability). Full methodology and the interpretation scale are available on the PABAI explainer page.

PABAI RangeInterpretation
120+Strongly Affordable
100–119Moderately Affordable
80–99Strained
Below 80Severely Constrained

Q1 2026: Actual vs. Constant‑Rate Affordability

The Q1 chart compares two versions of PABAI: one using actual weekly mortgage rates, and one using the current rate (6.53%) as a constant. Because the constant‑rate line uses the highest rate of the year, it naturally sits below the actual‑rate line for most of the quarter. That part isn’t the story.

The key insight is the size of the gap between the two lines. Early in the quarter, actual rates were meaningfully lower than the current rate (YTD high), giving buyers more qualifying power than a flat‑rate environment would suggest. But as rates climbed through March and into April, the two lines began to slowly converge—a visual confirmation of how persistent rate increases have eroded affordability heading into spring.

Structural Unaffordability and the Seasonal Pattern

Detached homes in the Portland region remain structurally unaffordable to a household earning the HUD median MSA income. PABAI has been below 100 for years, and Q1 2026 continues that pattern. What the chart makes clear is that winter remains the best window for buyers on tight qualifying budgets: affordability improves when rates soften and seasonal pricing cools. As spring approaches, both rates and prices firm up, and affordability reliably compresses.

With the 30‑year fixed now at its highest level of 2026, the convergence of the two PABAI lines at the end of the quarter reflects the same reality: rising rates have pushed qualifying costs to their weakest point of the year.

Affordability Snapshot (This Week)

Q1 2026 Affordability Recomputed at Today’s Rate

The table below shows how Q1 2026 affordability metrics change when all 3,349 detached sales are recalculated at this week’s 6.53% rate. This is the clearest way to see how rising rates reshape qualifying power, housing burden, and the share of homes accessible to a median‑income household.

MetricActual Q1 2026 RatesRecomputed at 6.53% RateChange
Average PABAI85.4582.40-3.05 pts
Required income (28% ratio)$145,236$150,600+3.69%
Median‑income shortfall17.03%21.35%+4.32 pts
Avg monthly mortgage pmt$3,932.66$4,076.35+$143.69
Avg housing burden (DTI)38.03%39.42%+1.39 pts
# of Affordable homes967831-136 homes
% of homes affordable28.87%24.81%-4.06 pts
Single-family Detached | Q1 2026
HUD Portland‑Vancouver‑Hillsboro MSA median income: $124,100
Data: RMLS (3,349 observations) | PortlandAppraisalBlog.com

How Rising Rates Reshape Affordability

Taken together, these metrics show how quickly affordability erodes when rates rise into the mid‑6% range. The drop in PABAI from 85.45 to 82.40 may look modest at first glance, but it represents a meaningful tightening of qualifying power across the entire detached market. Required income rises to nearly $151,000, widening the gap between what a median‑income household earns and what the market demands. That shortfall is now over 21%, a reminder that the typical Portland household is operating well outside traditional affordability thresholds.

The payment side tells the same story. Recomputing Q1 sales at today’s rate pushes the average monthly mortgage obligation up by roughly $144, which may seem incremental on a monthly basis but compounds sharply over a 30‑year horizon. More importantly, the higher rate pushes the average front‑end debt-to-income ratio from 38.03% to 39.42%, a level that would be considered stretched even in more forgiving underwriting environments. These shifts are not abstract; they directly shape who can buy, what they can buy, and how competitive they can be.

The Buyer‑Side Impact

The most visible consequence of these changes is the shrinking pool of homes accessible to a median‑income household. Under actual Q1 2026 rates, 967 detached homes were affordable; at today’s rate, that number falls to 831. In percentage terms, the share of the market within reach drops from 28.9% to 24.8%—a loss of more than four percentage points in a single recalculation. This is the practical expression of rising rates: fewer viable options, tighter qualifying margins, and a market that becomes increasingly selective about who can participate.

For buyers, the experience varies by circumstance but the direction is the same. Households with limited flexibility feel the tightening most acutely, as even small rate movements can eliminate entire segments of the market. Move‑up buyers face a widening payment gap between their current home and the next one, making the trade‑up calculus more difficult unless equity is substantial. Cash buyers, by contrast, gain relative leverage as financed demand thins, though that advantage is uneven across price tiers.

Across all buyer types, the message is consistent: rising rates are reshaping the market in real time, and the affordability landscape at a 6.53% mortgage rate is meaningfully different from the one buyers faced just a few months ago.

The Seller‑Side Impact

Rising rates don’t just reshape the buyer experience—they influence seller outcomes as well. In the 2025 detached market, cumulative days on market (CDOM) increased 11.09%, and the current rate environment suggests that upward pressure on market times may persist. As affordability tightens and the pool of qualified buyers shrinks, homes that would have moved quickly in a lower‑rate environment may begin to sit longer, particularly in segments where pricing is already stretched. This doesn’t imply an abrupt market shutdown, but it does mean sellers need to price with greater precision and expect a more selective buyer pool as 2026 progresses.

Closing Thoughts

The story of this week is straightforward: mortgage rates have climbed to their highest level of 2026, and the effects are visible across every affordability metric. The PABAI continues to signal structural strain for median‑income households, and the recalculated Q1 data shows how even modest rate movements reshape qualifying power, monthly payments, and the share of homes within reach.

For buyers, the takeaway is that financing conditions remain tight and are tightening further as we move deeper into the spring market. Winter continues to offer the best affordability window, but the current rate environment means households on the margin will feel pressure sooner and more sharply than in prior years.

For sellers, the implications are more subtle but no less real. Last year’s detached market saw CDOM rise more than 11%, and the present rate backdrop suggests that trend may persist. A smaller pool of qualified buyers and higher monthly payments can translate into longer market times, especially for homes priced aggressively or positioned in segments where affordability is already stretched. Pricing discipline and realistic expectations matter more in this environment than they did during the ultra‑low‑rate era.

As always, the Portland market adapts—sometimes quickly, sometimes reluctantly—but the direction of travel is clear. Higher rates are reshaping both sides of the transaction, and the spring of 2026 is operating under the most constrained financing conditions we’ve seen this year.

Sources & Further Reading

All data presented in this weekly mortgage rate update is based on the Q1 2026 detached homes segment. The data is sourced directly from RMLS and has been subjected to rigorous cleaning and validation processes to ensure reliability for detached single-family residential analysis in the six-county Portland Region. The trends, comparisons, and commentary are the result of original appraisal expertise and independent analysis—not aggregated from secondary sources or news summaries.

Coda

Thanks for reading—I hope you found a useful insight or an unexpected nugget along the way. If you enjoyed the post, please consider subscribing for future updates.

Are you an agent in Portland who wonders why appraisers always do “x”?

A homeowner with questions about appraiser methodology?

If so, feel free to reach out—I enjoy connecting with market participants across Portland and the surrounding counties, and am always happy to help where I can.

And if you’re in need of appraisal services in Portland or anywhere in the Portland Region, we’d be glad to assist.

About the Author — Abdur Abdul‑Malik, SRA, ASA

Abdur Abdul‑Malik is the founder, author, and publisher of the Portland Appraisal Blog, where he produces original regional and neighborhood‑level housing analytics for the Portland Region. He is a certified residential appraiser serving Oregon and Washington, drawing on RMLS transaction data, public records, and custom segmentation models he has built.

He developed the Portland Appraisal Blog Affordability Index (PABAI), a payment‑based affordability metric built from actual RMLS sales. PABAI incorporates weekly updates based on the prevailing 30‑year fixed mortgage rate, providing a locally grounded measure of housing affordability across the region.

Learn more → PABAI explainer • mortgage rate series • full author bio
Appraisal Deep Dive: Portland Seniors and the Condo Dream — Q3 2025 Data Shows Only 5% of Sales Are Truly Affordable

Q3 2025 Portland Region condo data reveals only 5% of sales are realistically affordable for senior households on median fixed incomes, despite condos being an ideal downsizing option.

Dramatic upward view of the entrance facade of the Empress Condominiums at 20 NW 16th Avenue in Northwest Portland, Oregon. Built in 1927 as the Empress Hotel, this five-story brick building was later converted to condominiums. The photo emphasizes the tiled signage, arched window, and vintage lanterns in the Nob Hill/Alphabet District.
Entrance detail of the Empress Condominiums in Northwest Portland—a 1927 building exemplifying the historic character of many pre-1970 condominium conversions in the region.
Photo: Abdur, Abdul-Malik, Portland Appraisal Blog (CC BY-SA 4.0)

Condominiums have long been viewed as an ideal downsizing option for seniors seeking lower-maintenance ownership, potential aging-in-place features, and proximity to urban amenities. National narratives—including recent discussions of a “silver tsunami” of baby boomer downsizers—often highlight condos as a key solution for older households looking to “rightsize.”

Yet Q3 2025 condominium closed-sales data from the Portland Region reveals a starkly different reality for seniors reliant on typical fixed incomes.

Using the Portland Appraisal Blog Affordability Index (PABAI)—a distribution-averaged metric calculated individually for each transaction based on actual sale price, reported HOA dues, and property taxes, combined with current mortgage rates, insurance estimates, and a conservative 20% down payment with 28% qualifying ratio—only 5.4% of the 651 condominium sales (35 units) generated a monthly carrying cost affordable on a median senior household income of approximately $68,284.

This analysis focuses exclusively on single-family residential class condominiums across the Portland Region—the six-county area that is the focus of this blog.

The Equity Divide in the Condo Market

Financing terms, as reported by listing agents in RMLS, tell much of the story (see table below). Cash purchasers accounted for 33.8% of transactions (220 sales) and paid the highest average price ($407,000) while accepting the highest average monthly HOA dues ($669). Conventional financing dominated another 54.1%, reflecting buyers with strong credit and often substantial down payments.

Financing Type% of Sales# SalesAvg Close PriceAvg Monthly HOA
Cash33.8%220$407,000$669
Conv.54.1%352$365,000$460
FHA8.0%52$283,000$403
VA2.6%17$340,000$356
Q3 2025 Portland Region condominium financing terms as reported by listing agents in RMLS, showing average close price and monthly HOA dues by type. (Top 4 financing types only.)
Data: RMLS | Portland Appraisal Blog

In contrast, FHA financing—typically associated with lower down payments and more income-sensitive qualification—represented only 8.0% of sales, with an average close price of $283,000 and more moderate HOA dues ($403 monthly).

This segmentation underscores a clear divide: equity-rich seniors downsizing from detached homes can readily access the market, often paying cash or leveraging large down payments to absorb elevated carrying costs. Seniors without significant prior home equity, reliant primarily on Social Security, pensions, or modest retirement savings, face severe barriers.

Price Distribution and the Narrow Affordable Tier

Q3 2025 condominium sales clustered heavily in the $200,000–$400,000 range, but the truly affordable segment for median senior incomes proved far smaller.

Price Band# Sales% of TotalAvg Close PriceAvg Year BuiltAvg Monthly HOA
Under $200k538%$164,0001968$461
$200–299k21633%$255,0001984$500
$300–399k20331%$346,0001997$431
$400–499k8914%$443,0001999$492
$500k+9014%$779,0001997$889
Q3 2025 Portland Region condominium sales distribution by price band, with average year built and monthly HOA dues.
Data: RMLS | Portland Appraisal Blog

The 35 units affordable under conservative PABAI assumptions were overwhelmingly concentrated in the under-$200,000 and lower $200,000–$299,000 bands—older, smaller properties that appear accessible on purchase price alone.

Age, Obsolescence, and Elevated Carrying Costs

Older condominiums—many conversions of pre-1970 apartment buildings — present particular valuation challenges. The table below excludes new construction deliveries, as agent-reported HOA dues for newly completed projects are often provisional or incomplete.

Year Built Bracket# SalesAvg Close PriceAvg Sq FtAvg Monthly HOAAvg HOA per Sq Ft
Pre-197095$304,000977$572$0.67
1970–1989194$309,0001,146$575$0.52
1990–199943$388,0001,117$555$0.52
2000–2009199$443,0001,265$661$0.54
2010+51$474,0001,394$284$0.26
Average Q3 2025 condominium characteristics by year-built bracket (new construction excluded due to provisional HOA reporting). Pre-2010 stock shows markedly higher HOA burden per square foot.
Data: RMLS | Portland Appraisal Blog

Pre-1970 stock carries the highest average HOA dues per square foot ($0.67), reflecting ongoing capital needs for aging systems, reserves, and occasional special assessments. This elevated recurring cost creates meaningful external obsolescence for income-constrained buyers, even when entry prices appear lower.

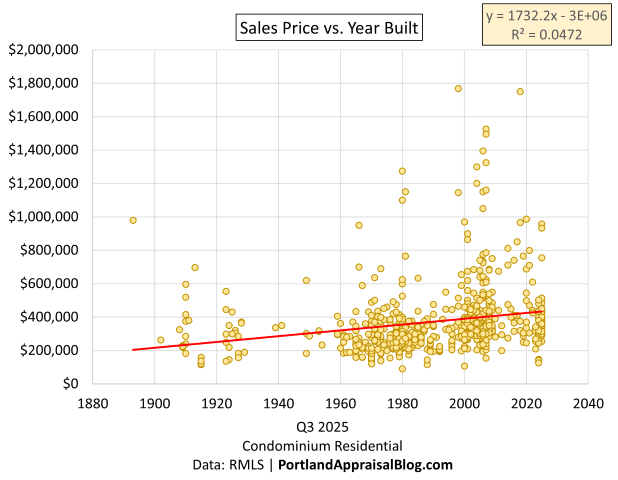
A scatterplot of sales price against year built further illustrates this dynamic. While newer construction generally commands higher prices, the weak correlation (R² = 0.047) confirms that factors beyond age—location, views, amenities, and building quality—dominate value. Older units cluster at lower prices, yet as shown above, they often carry disproportionately high recurring costs.

Scatterplot of condominium sales prices versus year built in the Portland Region for Q3 2025, showing weak correlation between age and value with most sales clustering between $200,000 and $800,000 across 1980–2010 construction.
Sales Price vs. Year Built — Q3 2025 Portland Region condominiums (651 sales). The weak correlation (R² = 0.047) illustrates that location, amenities, and building quality drive value far more than age alone.

County-Level Consistency

The challenge persists across the Portland Region:

County# Sales% Affordable for Seniors
Multnomah4266.3%
Washington1443.5%
Clackamas694.4%
Portland Region Total6515.4%
Share of Q3 2025 condominium sales affordable under conservative PABAI assumptions, by county.
Data: RMLS | Portland Appraisal Blog

No county offers a meaningful suburban relief valve for fixed-income seniors. (Over 98% of Q3 2025 condominium sales occurred in the three counties in the table above.)

Even FHA Terms Do Not Meaningfully Expand Access

Conventional wisdom might suggest FHA financing—with 3.5% down payments and more lenient debt-to-income ratios—would open the market wider for seniors with limited savings. Yet when mortgage insurance premium (0.55% annual) and the resulting larger loan are included, the share of affordable units actually declines to 3.8%.

Higher principal and interest, combined with permanent MIP, outweigh the benefits of lower upfront equity for households with constrained monthly cash flow.

Appraiser Perspective: Comparable Selection and Reconciliation Challenges

When appraising condominiums, comparable selection must account for competitive market segments defined by building age, location, complex-specific amenities, and HOA structure. Units in markedly different projects—for example, a 1960s conversion versus a 2000s high-amenity tower—are rarely direct substitutes.

Differences in functional utility, functional obsolescence, and market-perceived recurring costs often require careful adjustments or exclusion from the primary grid.

Conclusion

While condominiums remain a logical theoretical choice for seniors seeking reduced maintenance and urban access, Q3 2025 condo data demonstrates that ownership is realistically attainable only for those with substantial prior home equity. For senior households reliant primarily on fixed incomes near the median, monthly carrying costs—particularly in older stock with higher HOA burdens—render the vast majority of the market out of reach without additional equity or savings.

Many will continue to rely on rental options or supportive housing models, such as the recently opened Julia West House in Portland, which provides dedicated affordable senior housing.

Senior couple happily moving into a new condominium home, representative of the downsizing dream for many older households in the Portland Region.
For many seniors, condominiums represent an appealing downsizing opportunity—yet Q3 2025 data shows monthly carrying costs limit access for those without substantial equity.
Via Canva Pro

Sources & Further Reading

Decorative text divider.

Thanks for reading—I hope you found a useful insight or an unexpected nugget along the way. If you enjoyed the post, please consider subscribing for future updates.

Coda

Are you an agent in Portland who wonders why appraisers always do “x”?

A homeowner with questions about appraiser methodology?

If so, feel free to reach out—I enjoy connecting with market participants across Portland and the surrounding counties, and am always happy to help where I can.

And if you’re in need of appraisal services in Portland or anywhere in the Portland Region, we’d be glad to assist.

About the Author — Abdur Abdul‑Malik, SRA, ASA

Abdur Abdul‑Malik is the founder, author, and publisher of the Portland Appraisal Blog, where he produces original regional and neighborhood‑level housing analytics for the Portland Region. He is a certified residential appraiser serving Oregon and Washington, drawing on RMLS transaction data, public records, and custom segmentation models he has built.

He developed the Portland Appraisal Blog Affordability Index (PABAI), a payment‑based affordability metric built from actual RMLS sales. PABAI incorporates weekly updates based on the prevailing 30‑year fixed mortgage rate, providing a locally grounded measure of housing affordability across the region.

Learn more → PABAI explainer • mortgage rate series • full author bio
Appraisal Deep Dive: Portland’s First-Time Buyers Have No Choice But to Wait Until 40 — Q3 2025 Data Explains Why

Q3 2025 data shows only 10% of detached homes in the Portland Region were affordable to typical 25–44 households under realistic PITI assumptions using the Portland Appraisal Blog Affordability Index—explaining why first-time buyers have little choice but to wait until age 40.

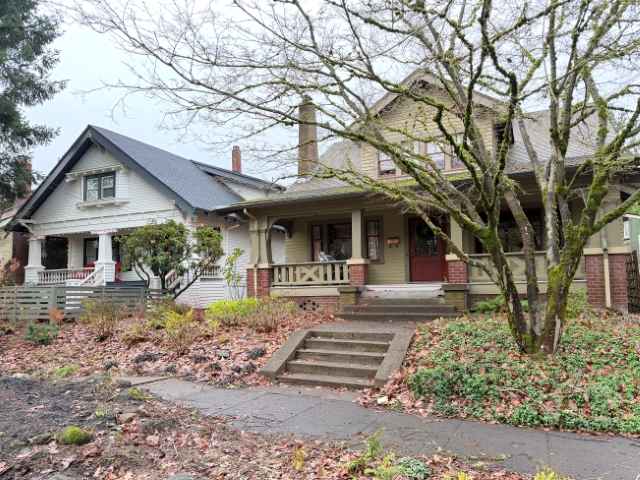
Two classic homes in a Portland neighborhood, with the right house having sold for $1.1M in Q3 2025.
Classic Craftsman bungalows homes in a Portland neighborhood. While older detached stock like this offered relatively better access for younger buyers in Q3 2025 (15% affordable in Multnomah County under realistic PITI assumptions), many close-in properties commanded premium prices—this example on the right sold for $1.1 million.
Photo: Abdur Abdul-Malik, Portland Appraisal Blog

The National Association of Realtors recently reported that the median age of first-time home buyers has reached 40—the highest on record—with their share of purchases falling to a historic low of 21%. These trends are driven by affordability challenges that national indices like NAR’s Housing Affordability Index attempt to measure.

Using NAR’s standard methodology (principal and interest only, 25% qualifying ratio), approximately 28% of Q3 2025 detached single-family sales in the six-county Portland region were affordable to a household earning the area’s median income of $124,100.

In reality, no buyer escapes property taxes or homeowners insurance. When we incorporate actual taxes from listings and a conservative insurance estimate into the full monthly payment (PITI, 28% ratio), affordability drops to 20% for that same benchmark household.

To provide a more accurate local measure, this analysis introduces the Portland Appraisal Blog Affordability Index (PABAI)—a PITI-based index designed for the Portland Region’s residential market. Like traditional housing affordability indices, the PABAI expresses affordability as an index value where 100 means a household at the reference median income can exactly qualify for the typical home under realistic lending conditions. Values below 100 indicate unaffordability. A secondary calculation—the percentage of sales affordable to that reference household—derives directly from the index and serves as the primary insight in this post. For the overall Portland Region benchmark (using HUD’s Area Median Income of $124,100), the PABAI stood at approximately 78—confirming an unaffordable market even before drilling into younger households.

The challenge is even more severe for the cohort most people associate with first-time buyers: households headed by someone aged 25–44. With a median income of approximately $110,000 (2024 American Community Survey estimate), the PABAI drops to 69—meaning the typical younger household fell 31% short, with only 9.8% of Q3 detached sales (460 homes out of 4,682) within reach. The typical $600,000 detached home required roughly $159,000 in household income—45% above the cohort median.

Q3 2025 Affordability for Younger Buyers — County by County

Q3 2025 PABAI modeling reveals stark geographic variation for households aged 25–44.

CountyMedian Q3 PriceRequired Income for Median Home% of Sales Affordable: 25–44 Age Group
Columbia$471,000$122,00034%
Yamhill$510,000$132,00023%
Multnomah$555,000$150,00015%
Clackamas$675,000$178,0005%
Washington$625,000$165,0003%
Hood River$773,000$195,0003%
Regional$600,000$159,00010%
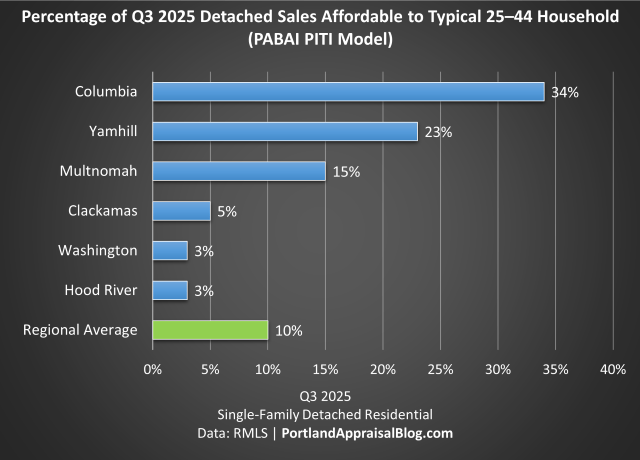
Percentage of Q3 2025 detached sales affordable to typical 25–44 household under the PABAI (PITI model). Affordability modeled using 20% down payment, 28% front-end ratio, actual weekly rates, listing taxes, and 0.40% annual insurance estimate.
Data: RMLS | Portland Appraisal Blog

Under the PABAI, outer counties like Columbia (34%) and Yamhill (23%) offered the highest shares of reachable detached homes, but this comes with trade-offs. Homes in these more rural areas typically involve longer commute times to Portland’s core amenities, job markets, and urban services—a key consideration for households prioritizing proximity over initial affordability. More urban Multnomah (15%) outperformed the pricier suburban counties of Washington (3%) and Clackamas (5%). Hood River’s premium inventory made it effectively inaccessible at just 3%.

The suburban counties’ low accessibility reflects their inventory mix. Clackamas County’s average lot size in Q3 sales was 1.07 acres—significantly larger than Washington County’s 0.36 acres or Multnomah’s 0.27 acres—contributing to higher median prices and required incomes well above the 25–44 cohort median. Larger lots and newer improvements demand stronger buyer qualifications, while Multnomah’s denser, older stock provided relatively more options for younger households.

Horizontal bar chart showing the percentage of Q3 2025 detached single-family home sales affordable to a typical household aged 25–44 in the Portland region under the Portland Appraisal Blog Affordability Index (PABAI PITI Model). Columbia County leads at 34%, followed by Yamhill (23%), Multnomah (15%), Clackamas (5%), Washington (3%), Hood River (3%), with the regional average at 10%. Data source: RMLS | PortlandAppraisalBlog.com

The Realistic Paths to Ownership for Younger Buyers

For most households in their 20s and 30s, entry into the detached-home market in Q3 2025 required one of three things:

  1. Substantial family assistance (gift for down payment, co-signer, or direct equity help).
  2. Extreme lifestyle sacrifice (aggressive saving for larger down payment, renting with multiple roommates far longer, minimal discretionary spending).
  3. Outlier household income (well above the cohort median—e.g., $150,000+ dual incomes early in careers).

Without one of these, even well-qualified younger buyers were effectively priced out until they aged into higher earnings—typically the late 30s or early 40s. Or they had to consider alternative housing options, like condominiums or townhouses.

This dynamic directly explains the national shift toward older first-time buyers and underscores the limited market participation of younger cohorts in the current environment.

Methodology Note

This analysis introduces the Portland Appraisal Blog Affordability Index (PABAI)—a PITI-based metric designed for the Portland region’s residential market (detached single-family, attached homes, condominiums, and manufactured homes on owned land). The PABAI measures the percentage of sales affordable to a reference household under realistic lending conditions. The PABAI can be calculated for distinct property types or the residential market as a whole. For this post, the PABAI is calculated for detached single-family homes only.

Affordability is modeled using a 20% down payment, 28% front-end housing expense ratio (per Freddie Mac guidelines), actual weekly 30-year fixed rates at closing, property taxes from listings, and a conservative 0.40% annual homeowners insurance rate (aligned with 2025 Oregon averages per Bankrate). Unlike national indices that rely on principal and interest only, the PABAI incorporates full PITI for a more accurate reflection of buyer qualification in the Portland region.

For an overall regional benchmark, the PABAI uses HUD’s Area Median Income for a 4-person household in the Portland–Vancouver–Hillsboro MSA ($124,100 as of 2025). In Q3 2025, the PABAI for this benchmark stood at approximately 78—meaning the typical household at the area median income could afford about 20% of detached sales under realistic PITI assumptions.

Reference incomes for specific age cohorts are estimated from the U.S. Census Bureau’s 2024 American Community Survey (Table B19037) using standard linear interpolation on grouped income data. For households aged 25–44, this yields an estimated median of approximately $110,000. This lowers the PABAI to approximately 69 for this age band, placing only 9.8% of Q3 2025 detached sales within reach.

For quarterly market context, see the Q3 2025 detached single-family update.

Sources & Further Reading

Decorative text divider.

Thanks for reading—I hope you found a useful insight or an unexpected nugget along the way. If you enjoyed the post, please consider subscribing for future updates.

Coda

Are you an agent in Portland who wonders why appraisers always do “x”?

A homeowner with questions about appraiser methodology?

If so, feel free to reach out—I enjoy connecting with market participants across Portland and the surrounding counties, and am always happy to help where I can.

And if you’re in need of appraisal services in Portland or anywhere in the Portland Region, we’d be glad to assist.

About the Author — Abdur Abdul‑Malik, SRA, ASA

Abdur Abdul‑Malik is the founder, author, and publisher of the Portland Appraisal Blog, where he produces original regional and neighborhood‑level housing analytics for the Portland Region. He is a certified residential appraiser serving Oregon and Washington, drawing on RMLS transaction data, public records, and custom segmentation models he has built.

He developed the Portland Appraisal Blog Affordability Index (PABAI), a payment‑based affordability metric built from actual RMLS sales. PABAI incorporates weekly updates based on the prevailing 30‑year fixed mortgage rate, providing a locally grounded measure of housing affordability across the region.

Learn more → PABAI explainer • mortgage rate series • full author bio