Hillsboro’s residential market responded to Intel’s 2024–2025 layoffs with clear external obsolescence—condominium and attached resale segments showed steepest price declines and longest marketing times. Original RMLS analysis.
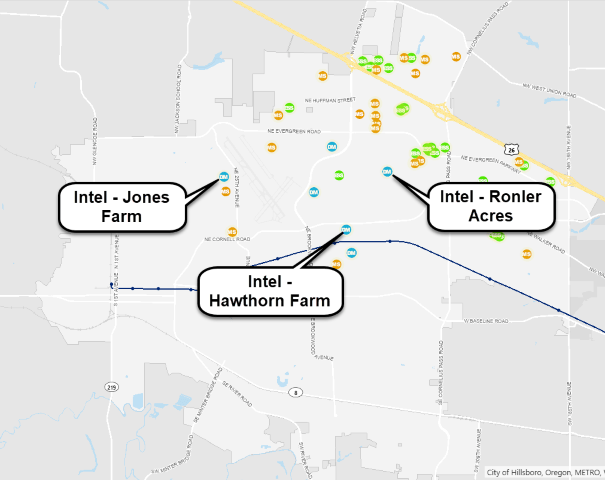
Intel’s Gordon Moore Park at Ronler Acres—the largest campus in Hillsboro and primary site impacted by 2024–2025 workforce reductions. Photo: M.O. Stevens via Wikimedia Commons (CC BY 3.0)
Hillsboro has long been synonymous with high-wage technology employment, anchored by Intel’s extensive campus network. When a dominant employer undergoes significant workforce reduction, the ripple effect can manifest as external obsolescence in the surrounding residential market—reduced buyer demand, extended marketing periods, and downward pressure on realized prices, particularly in segments most tied to that employment base.
Between late 2024 and the end of 2025, Intel eliminated more than 4,400 positions in Oregon, with the vast majority concentrated in Hillsboro facilities. This represented a roughly 20% contraction from peak local headcount. The timeline provides clear inflection points for analyzing market reaction.
October 2024: Approximately 1,300 positions eliminated (separations beginning November 2024).
July 2025: Roughly 2,400 additional positions cut across Ronler Acres, Jones Farm, Hawthorn Farm, and Aloha sites.
November 2025: Further 669 roles removed, bringing the 2025 total above 3,100.
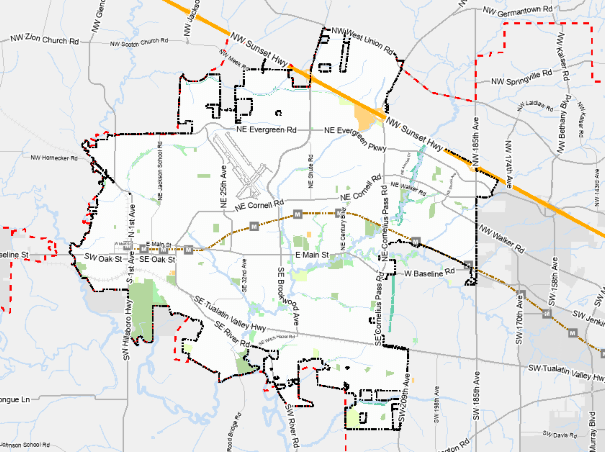
Semiconductor business cluster in Hillsboro, Oregon, illustrating the concentration of Intel campuses (Ronler Acres, Jones Farm, Hawthorn Farm) amid supplier and partner facilities—the geographic core of the employment shock. Via Hillsboro GISApproximate Hillsboro city limits boundary used for RMLS closed-sales analysis (detached, attached, and condominium properties, 2023–2025). Via Hillsboro GIS
Annual market summary for Hillsboro closed sales (all property types, including new construction, 2023–2025). Overall averages reflect relative price stability across the period. Data: RMLS | Portland Appraisal Blog
Data reflects single-family residential class properties within Hillsboro city limits (detached homes, attached townhomes/rowhomes, and condominiums).
Price Trends Reveal a Split Market
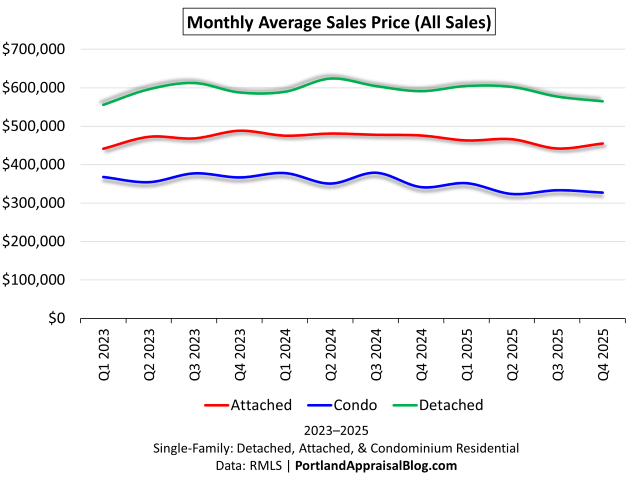
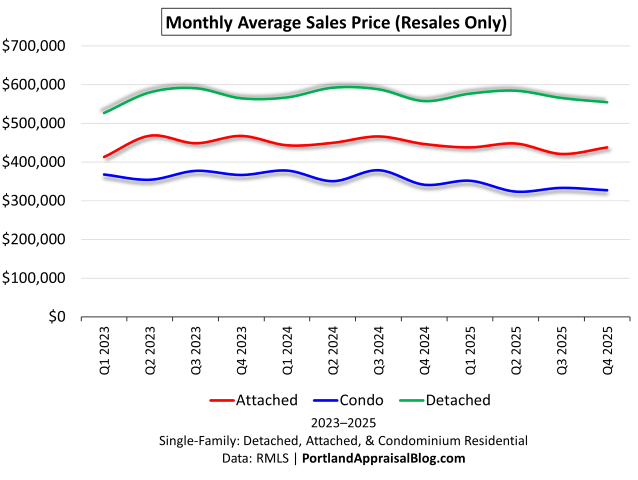
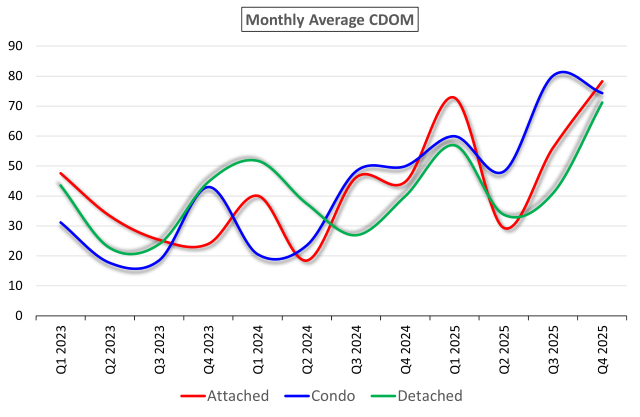
Quarterly average close price trends in Hillsboro (all closed sales, 2023–2025). Detached properties maintained relative stability longest, while condominium and attached segments showed earlier and steeper declines. Quarterly average close price trends in Hillsboro (resale properties only, excluding new construction). Removing builder sales unmasks deeper weakness in existing detached and attached stock.
Some local year-end commentary described Hillsboro values as generally stable, citing modest average price gains and balanced overall inventory; this matches the annual market summary table above. However, if you peel back the onion a different picture emerges. The apparent stability reflects the continued delivery of new-construction projects—many planned and entitled well before Intel’s workforce reductions began. When new-construction sales are excluded, existing condominium and attached resale properties show consistent price declines and significantly longer marketing periods—evidence that the employment shock has already exerted measurable external obsolescence on resale stock. The broader market averages may feel the full effect in 2026 and beyond as pre-layoff development pipelines clear.
Type
2023 Avg Close
2024 Avg Close
2025 Avg Close
2025 vs 2023 Change
2025 Avg CDOM
SP/OLP 2025
Condo
$366,533
$361,835
$335,105
–8.6%
66 days
94.89%
Attach.
$449,270
$452,930
$435,573
–3.0%
56 days
96.22%
Detach.
$568,134
$578,012
$570,170
+0.4%
50 days
97.37%
Resale-only trends reveal clearer softening, particularly in condominium and attached segments. Data: RMLS | Portland Appraisal Blog
The Textbook Signal: Rising Cumulative Days on Market
Perhaps the clearest indicator of external obsolescence is the extension of marketing periods. Prolonged days on market with little to no price premium is a hallmark response to localized employment contraction.
Quarterly average cumulative days on market (resale properties only, Q1 2023–Q4 2025). Condominium resale led the increase, followed closely by attached; detached resale joined the upward trend decisively in late 2025.
The extension of marketing periods in resale properties offers one of the clearest indicators of external obsolescence. Condominium resale led the trend with sharp increases beginning in mid-2024, followed closely by attached resale. Detached resale, initially more resilient, joined the upward trajectory decisively in late 2025. By Q4 2025, average cumulative days on market across all three resale segments converged in the 74–83 day range—a dramatic shift from the 20–40 day norms prevalent in 2023.
Key CDOM Inflection Points (Resale Properties)
Type
Avg CDOM Q4 2024
Avg CDOM Q4 2025
Increase
Condominium
50 days
74 days
+48%
Attached
61 days
83 days
+36%
Detached
48 days
78 days
+63%
Average cumulative days on market for resale properties: Q4 2024 vs. Q4 2025 comparison, highlighting the sharpest extensions. Data: RMLS | Portland Appraisal Blog
The near-convergence at 74–83 days by year-end 2025 represents a dramatic shift from pre-2024 norms, when most segments averaged 20–40 days.
Individual Sale Behavior: No Premium for Extended Marketing Time
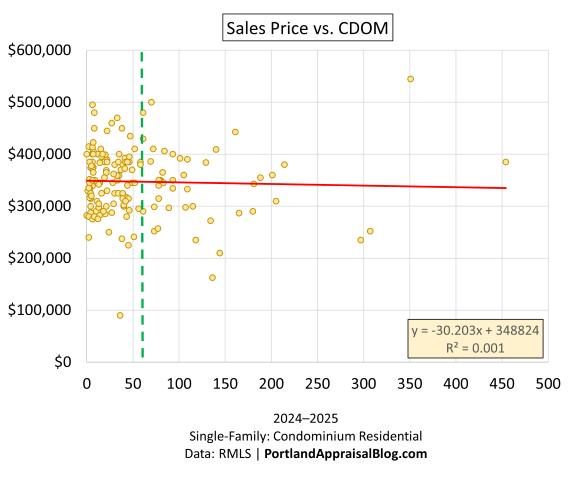
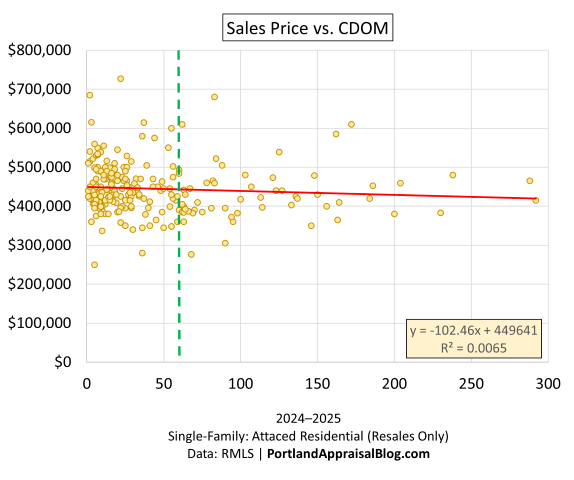
Scatter analysis of 2024–2025 closed sales reinforces the aggregate trend.
Sales price vs. cumulative days on market—Hillsboro condominium sales, 2024–2025. Flat trend line and long rightward tail illustrate absence of price compensation for prolonged marketing periods. Vertical dashed line at 60 days highlights extended-market properties. Sales price vs. cumulative days on market—Hillsboro attached resale properties only, 2024–2025. Similar flat relationship and extended tail once new-construction sales are removed. Vertical dashed line at 60 days.
Both distributions exhibit essentially zero correlation between longer marketing time and higher achieved price—a buyer’s market signal where sellers concede on price rather than wait.
Upper-Tier Detached Vulnerability
Year
# of Resales
Avg Resale Price
# of New Con
Avg New Con Price
% New Con
2023
24
$1,006,573
17
$981,111
41%
2024
24
$964,685
28
$969,004
54%
2025
35
$954,781
28
$901,582
44%
Total
83
$972,592
73
$945,687
47%
Hillsboro detached sales priced $800,000 and above (2023–2025), separated by resale and new construction. Resale and new-construction prices trend lower while sheer new-construction volume helps support aggregates, leading to an impression of overall market stability. Data: RMLS | Portland Appraisal Blog
Even within the more resilient detached segment, properties priced $800,000 and above—often appealing to higher-compensated technology professionals—displayed noticeable softening. Resale upper-tier homes closed at lower average prices in 2025 ($955,000) than in prior years, while new-construction sales in this bracket experienced even sharper erosion, averaging $902,000 in 2025—an 8.1% decline from the 2023 figure.
Appraiser Perspective: Practical Implications
The data presents several direct challenges in current Hillsboro residential appraisals:
Comparable selection becomes more complex when pre-layoff and post-layoff sales coexist. Appraisers must prioritize recent closings and apply verifiable market condition (time) adjustments, particularly for condominium and attached resale comps.
Reconciliation weighting should favor sales with similar motivation profiles; distressed or relocation-driven transactions carry greater weight in segments showing extended CDOM.
Market condition (time) adjustments are warranted when comparable sales bracket the layoff timeline. Sales closing before mid-2024 often reflect stronger demand and may require negative adjustments when applied to current assignments to account for subsequent market erosion; more recent closings in condominium and attached resale segments typically need little or no adjustment, while pre-layoff comps may warrant downward support in reconciliation.
New vs. resale distinction is critical in attached and upper-tier detached appraisals. Builder sales frequently achieve high sale-to-list ratios through incentives and concessions that are not always reflected in the recorded price, which can distort aggregate trends and make the overall market appear more stable than the resale segment suggests. Generally, appraisers compare new to new and resale to resale. The danger zone arises when comparing a 2–3 year-old near-new resale home to an actual new-construction sale; extensive efforts should be made to verify whether recent new-construction transactions included substantial concessions or favorable financing terms.
New construction accounted for 27.8% of all Hillsboro closed sales from 2023–2025—a notably high share that remained steady year-over-year. These deliveries largely reflect projects planned and entitled before Intel’s workforce reductions began. As that pre-layoff pipeline clears in the coming years, overall market averages may more closely mirror the resale trends observed here.
Lenders, homeowners, and real estate professionals active in Hillsboro should recognize that proximity to the semiconductor corridor no longer commands the same location premium it once did—at least in denser and higher-priced segments. The Portland Appraisal Blog will monitor how the tapering new-construction pipeline shapes broader metrics in 2026 and beyond.
Thanks for reading—I hope you found a useful insight or an unexpected nugget along the way. If you enjoyed the post, please consider subscribing for future updates.
CODA
Are you an agent in Portland who wonders why appraisers always do “x”?
A homeowner with questions about appraiser methodology?
If so, feel free to reach out—I enjoy connecting with market participants across Portland and the surrounding counties, and am always happy to help where I can.
And if you’re in need of appraisal services in Portland or anywhere in the Portland Region, we’d be glad to assist.
Sandy’s sewer moratorium has halted most new development after a 27-year boom where new homes made up ~27% of sales—nearly 3x the regional average. Original RMLS analysis (1998–2025) and field reporting reveal the impacts and what comes next.
The entrance sign to the City of Sandy Wastewater Treatment Plant at 33400 SE Jarl Rd. Built in 1965 for a much smaller population, this facility is at the center of the moratorium on new sewer connections. Photo: Abdur Abdul-Malik, Portland Appraisal Blog
After decades of explosive growth—one of Oregon’s highest rates of new home construction—the City of Sandy faced a severe infrastructure crisis. A federal settlement with the EPA forced the city to impose a moratorium on new sewer connections, halting most new development.
Sandy’s wastewater treatment plant, built in 1965 and last significantly upgraded in 1998, could not keep pace with expansion. Population grew from ~5,000 to over 13,000, adding thousands of homes and overwhelming the system with inflow and infiltration during wet weather. This led to hundreds of violations of Clean Water Act permits, including exceedances of effluent limits and prohibited bypasses that released untreated or partially treated wastewater into Tickle Creek—a tributary of the Clackamas River.
The violations exposed the city to potential civil penalties exceeding $100 million under the Clean Water Act. A fine which, if imposed, could have bankrupted the city. Sandy reached an agreement with the EPA, U.S. Department of Justice, and Oregon DEQ, committing to major upgrades to remediate the pollution.
Key requirements also included limiting new sewer connections—resulting in the moratorium, initiated in October 2022 and extended most recently to June 2, 2026 (Resolution 2025-39). The long-term fix favors piping effluent to Gresham’s plant (target late 2020s–early 2030s).
While vested pre-moratorium projects continue to build and sell in 2026, the backlog will soon run out—likely in the coming years—bringing new construction to a near-total halt. The most significant constraints on supply may therefore emerge 2027–2030, until regional wastewater capacity is fully online.
This post details the timeline, infrastructure roots, and—through original RMLS analysis (1998–2025)—the moratorium’s emerging and future impacts on Sandy’s housing market.
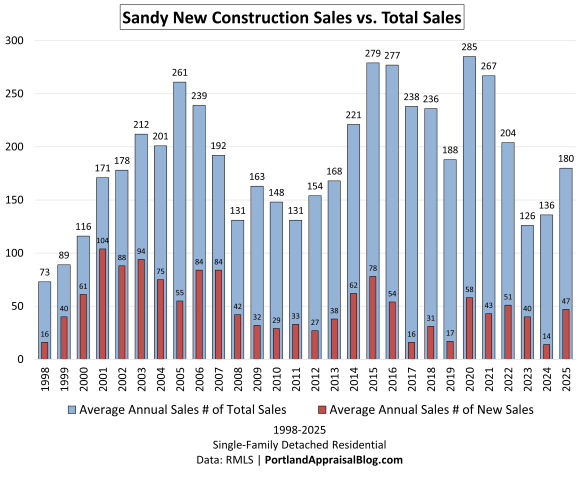
Teaser Stat: New detached single-family homes represented ~27% of all SFR sales from 1998–2025—nearly three times the typical regional average (~10%).
Tickle Creek Trail entrance sign in Sandy. The creek’s water quality improvements came at the cost of a moratorium on new sewer connections to prevent further strain on the system. Photo: Abdur Abdul-Malik, Portland Appraisal BlogTickle Creek in Sandy today—flowing through protected riparian forest. Photo: Abdur Abdul-Malik, Portland Appraisal Blog
The situation underscores the long-term consequences when growth outpaces infrastructure.
The Infrastructure Story – How Sandy Reached the Breaking Point
Sandy’s sewer moratorium didn’t appear out of nowhere. It was the culmination of decades of rapid growth colliding with infrastructure built for a much smaller town.
The city’s wastewater treatment plant was constructed in 1965, designed to serve a population of roughly 2,000–2,500 residents. A significant upgrade in 1998 increased capacity to 1.2 million gallons per day (MGD), but no further major expansions followed.
Meanwhile, Sandy transformed. Between 1998 and 2025, 1,413 new single-family homes were sold (RMLS data)—representing ~27% of all SFR sales over that period, nearly three times the typical regional average.
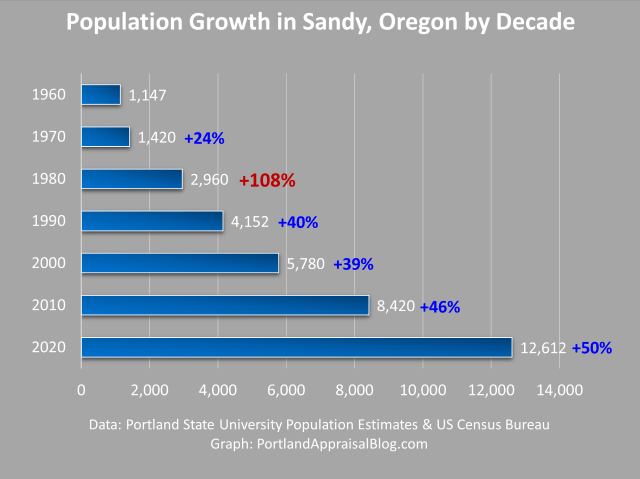
Population growth accelerated sharply after 1970, leaving the city more than twice as large as it was when the Sandy plant last underwent a major upgrade (1998):
The result placed extraordinary demand on the aging system. During wet weather, inflow and infiltration (I&I)—stormwater entering through direct connections and groundwater seeping into pipes—routinely overwhelmed the system. Rain alone might have caused flooding or diluted overflows, but when combined with effluent from homes (wastewater containing nutrients, bacteria, and solids), it resulted in treatment capacity being exceeded, leading to permit violations including the release of untreated or partially treated wastewater into Tickle Creek.
Storm drain in Sandy during rain. Surface runoff entering the sewer system through drains like this is a primary source of inflow and infiltration (I&I), which overwhelmed the treatment plant and led to permit violations. Photo: Abdur Abdul-Malik, Portland Appraisal Blog
The violations triggered federal enforcement. Under the Clean Water Act, potential civil penalties could have exceeded $100 million—a sum larger than the city’s annual budget. The latest biennial budget is $188 million (2025–2027 adopted). In 2023, Sandy reached a Consent Decree with the EPA, U.S. Department of Justice, and Oregon DEQ. The city settled for a reduced penalty of $324,300 (after completing a $200,000 supplemental environmental project for riparian restoration along Tickle Creek) and committed to comprehensive upgrades.
Central to the agreement was the “Sandy Clean Waters” program—a multi-phase overhaul of collection systems, treatment processes, and long-term planning. A key compliance requirement: limit new sewer connections that increase flows until capacity is proven.
This led directly to the moratorium on new land-use applications requiring sewer hookups, first adopted in October 2022 and extended multiple times—most recently to June 2, 2026 via Resolution 2025-39.
The city’s preferred long-term solution is a regional partnership: constructing an approximately 10-mile pipeline to send effluent to Gresham’s larger treatment facility. Engineering studies and intergovernmental agreements are underway, with completion targeted for the late 2020s or early 2030s.
Aerial view of the Sandy Wastewater Treatment Plant (1965, upgraded 1998), tucked away in a forested area near Tickle Creek. The limited space and aging design were overwhelmed by Sandy’s growth from ~5,000 to over 13,000 residents. Image: Google MapsAerial view of the Gresham Wastewater Treatment Plant – the larger, regional facility that will become Sandy’s primary treatment partner through the proposed 10-mile effluent pipeline, targeted for the late 2020s or early 2030s. Image: Google Maps
In the interim, the city has made progress on immediate fixes—infiltration repairs, basin upgrades, and stress testing—but growth remains capped to protect water quality and avoid further penalties.
The result is a community that grew faster than its infrastructure could support, now navigating the consequences of that mismatch.
The Moratorium – Timeline and Mechanics
With the infrastructure crisis established, the City of Sandy turned to a rarely used tool under Oregon law: a moratorium on development tied to public facilities.
Authorized by ORS 197.520–197.530, such moratoria allow cities to pause land-use applications when a “shortage of public facilities” exists, provided they demonstrate reasonable progress toward resolution. Sandy has relied on this framework since 2022, extending the moratorium multiple times through public hearings and written findings.
Key Timeline
Date
Resolution / Action
Key Details
10/3/2022
Resolution 2022-24
Initial moratorium adopted; no new applications requiring sewer connections accepted
3/20/2023
Resolution 2023-07
First extension; stress testing begins
6/20/2023
Resolution 2023-27
Consent Decree-aligned moratorium; capacity capped at 300 connections
11/20/2023
Resolution 2023-34
Extension to June 2024
5/20/2024
Ordinance 2024-09
Extensions for pre-moratorium approvals to prevent expiration
6/3/2024
Resolution 2024-11
Capacity unlocked to ~451 available (conditional EPA approval)
12/2/2024
Resolution 2024-24
Extension to June 2025
6/2/2025
Resolution 2025-14
Mass allocation closed; focus on extensions/reassignments
11/17/2025
Resolution 2025-39
Current extension to June 2, 2026
Timeline of City of Sandy’s resolutions extending the moratorium.
The moratorium is not a blanket building ban. Remodels, additions that do not increase wastewater flows (e.g., no new bathrooms), and certain replacements are generally permitted. Property line adjustments, variances, and developments using on-site septic systems are also exempt.
What is restricted: new land-use applications that propose additional sewer connections or modifications increasing flows. This includes most new subdivisions, partitions creating additional lots, multifamily projects, and commercial developments requiring hookups.
How Capacity Is Managed
The city uses Equivalent Residential Units (ERUs) as a measure—one ERU roughly equals the wastewater load of a single-family home.
Initial cap (2022–2023): 120–300 ERUs
Conditional EPA approval (April 2024): Potential total of 570 ERUs (with pathway to more pending upgrades)
As of late 2025: Approximately 374 ERUs remain available, primarily reserved for vested pre-moratorium projects, public health needs (failed septics), and limited reassignments—meaning the actual number of new detached single-family homes that can connect is far lower than the ERU figure suggests.
Pre-October 2022 applications (“vested”) retain priority, allowing some construction to continue. However, the backlog is finite, and new non-vested projects face significant hurdles.
The extensions follow state law requirements: six-month terms, public hearings, and findings of ongoing shortage plus progress (e.g., infiltration repairs, engineering for the Gresham pipeline).
This mechanism has bought time for compliance but will eventually constrain supply of new homes—effects explored through market data in the next section.
The Market Impact – An Appraiser’s Original Analysis (1998–2025)
The moratorium’s effects on Sandy’s real estate market are already measurable—and point to a future of tighter supply and shifting values.
Original RMLS analysis of single-family residential (SFR) sales in Sandy ZIP 97055 from January 1998 through December 2025 reveals a market long defined by exceptional new-construction activity, now facing a sharp pivot.
Over 28 years, 5,264 SFR detached home sales closed in Sandy. Of these, 1,413 were new-construction homes—representing ~27% of the total. This is nearly three times the typical share seen in comparable Portland-metro and Clackamas County markets, where new homes rarely exceed 10–12% of annual sales.
Sandy’s reliance on new construction was extraordinary—and, frankly, almost unheard of in mature real estate markets. In peak years like 2001, more than 60% of all single-family sales were brand-new homes—meaning over one in two transactions involved a house that didn’t exist the year before. Even the long-term average of ~27% is roughly three times the norm for established markets. Outside true boom-town anomalies (think early-2000s Las Vegas or parts of Florida), you rarely see new development dominate to this degree. For decades, Sandy operated less like a typical suburb and more like an active greenfield expansion zone.
The pattern was not uniform:
Early 2000s peak: New construction frequently exceeded 50–60% of sales.
Mid-2010s dip: Share fell to single digits during post-recovery caution.
2018–2023 resurgence: New homes consistently 20–32% of sales, reflecting migration, low rates, and Sandy’s appeal as a Mt. Hood gateway.
Focusing on new construction as a percentage of total sales shows Sandy peaking over 60% and beginning a downward trajectory, bottoming in 2017. A new trend began in 2018, interrupted by the moratorium:
The 2024–2025 period marks the clearest shift:
2024: New share fell to 10.3% (lowest since the Great Recession era).
2025: Partial rebound to 26.1%, reflecting the final closings from vested pre-moratorium projects.
This rebound masks the underlying trend: the pipeline of vested developments is thinning. As it exhausts, new supply faces a near-total halt.
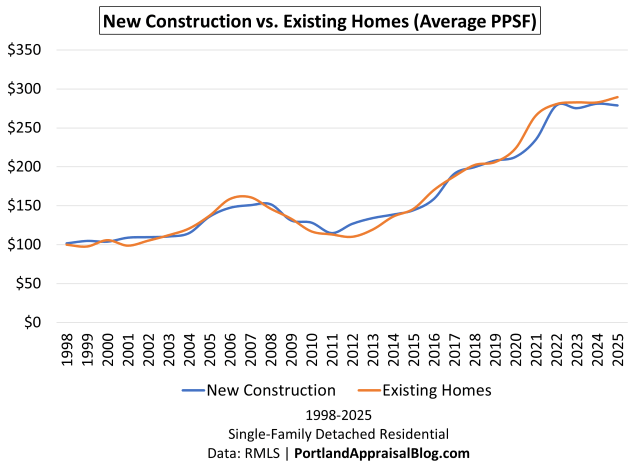
Price Per Square Foot Trends
Average price per square foot (PPSF) rose across both segments, but patterns differ due to size variation.
The lines cross multiple times (e.g., 2004–2005, 2010, 2014–2015). In periods of similar size—such as 2014–2015 (both ~1,780 SF)—PPSF was nearly identical, with no consistent advantage for new homes.
Existing homes: Steady increase from ~$100 in 1998 to $290 in 2025.
New construction: Slightly more volatile, often tracking below existing PPSF in many years—largely because new homes averaged significantly larger square footage and PPSF generally declines the larger a home gets.
The 2014–2015 period provides the clearest evidence that PPSF differences are primarily size-driven. During those years, new and existing homes had nearly identical average square footage (~1,780 SF), and PPSF tracked very closely (~$138–$146), with no consistent advantage for new construction. Other crossing points (e.g., 2004–2005, where existing edged higher, and 2010) further illustrate that per-square-foot pricing reflects size and market timing more than construction age.
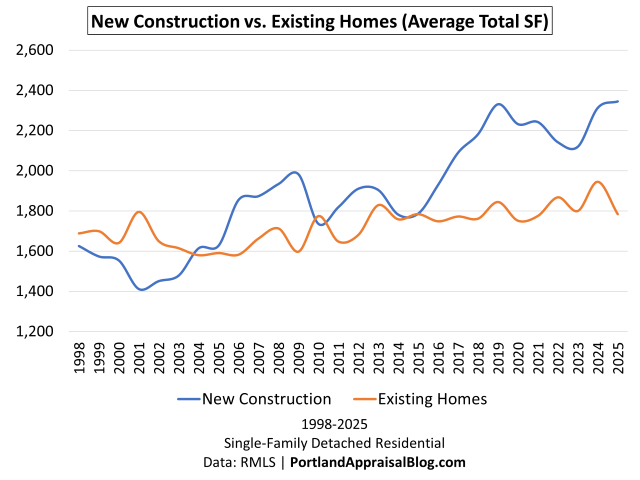
Size and Age: New Homes Drove Greater Demand
New construction trended larger and more fixture-intensive—amplifying strain on the system.
Average total SF (new): Progressed from ~1,600 in early years to 2,300–2,345 in 2024–2025.
Average bedrooms/baths (new): 3.7–3.8 beds / 2.5–2.6 baths in recent years (vs. existing ~3.3 beds / 2.0 baths).
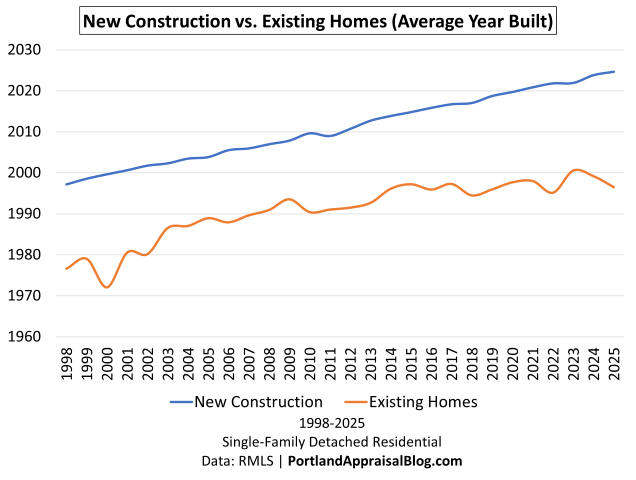
Sandy’s overall housing stock is notably younger than the broader Portland region. Average year built for all homes sold in the period was ~2003, compared to a regional average age of ~48 years (Q3 2025 data). The narrower gap in the late 1990s reflects an earlier growth surge in the 1980s, which temporarily refreshed the existing stock. The widening gap from 2000 onward illustrates the intensity of subsequent development.
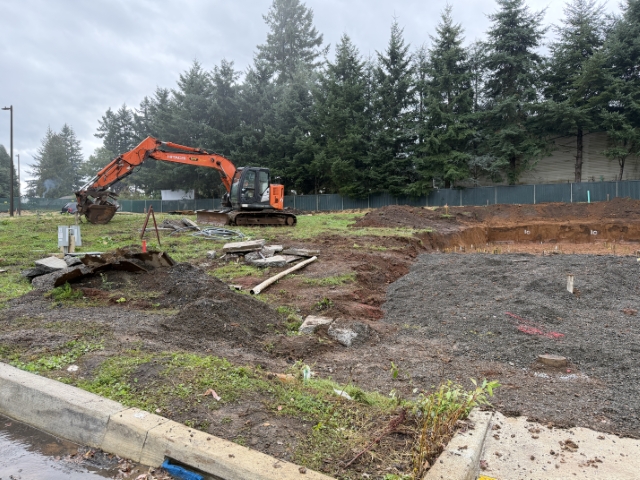
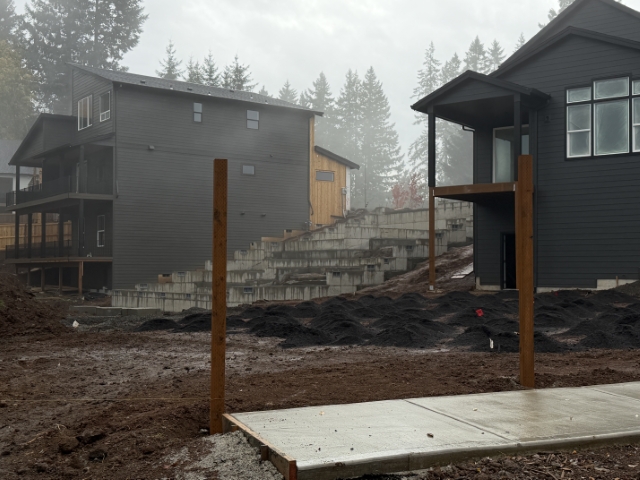
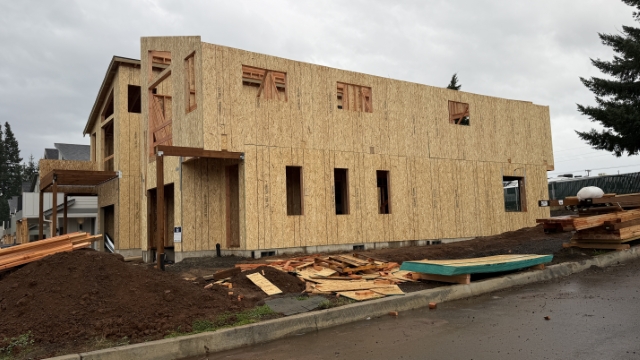
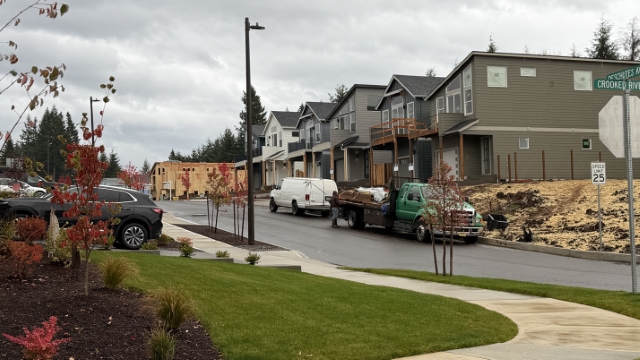
Field Observations: Vested Projects in Transition
On-site visits to pre-moratorium subdivisions reveal ongoing construction in vested phases, contrasting with the broader supply constraint as the backlog thins.
Construction in progress at a pre-moratorium (vested) subdivision in Sandy (October 2025). These projects continue under previously allocated sewer connections, but represent the thinning backlog as the moratorium limits new supply. Photo: Abdur Abdul-Malik, Portland Appraisal BlogHomes in various stages of completion, from foundation recently poured to nearly complete. Photo: Abdur Abdul-Malik, Portland Appraisal BlogA framed home. The average size of new homes has climbed by ~50% since 1998. With fixture count increasing as well. Photo: Abdur Abdul-Malik, Portland Appraisal BlogA subdivision nearly complete, a framed house can be seen in the distance. Photo: Abdur Abdul-Malik, Portland Appraisal Blog
Summary of Impacts
Supply: New construction share has fallen from a long-term ~27% average to volatile single-digit territory in 2024, with 2025’s rebound likely the final surge.
Pricing: Overall PPSF has risen steadily across both segments, influenced by size differences rather than consistent age-based premiums.
Future: As vested projects complete, non-vested development faces severe constraints until regional capacity arrives.
The data confirms a market transitioning from abundance of new inventory to reliance on existing stock—with corresponding pressure on redevelopment and constrained large-scale growth.
Looking Ahead – The Next Decade of Constraints
The moratorium on new sewer connections is currently extended through June 2, 2026 (Resolution 2025-39, adopted November 2025). City staff and council findings indicate continued six-month renewals are likely until permanent capacity is secured.
While some pre-moratorium (“vested”) projects continue construction and sales in 2026, the remaining backlog of allocated connections is finite—approximately 374 ERUs as of late 2025, mostly reserved for committed developments and limited exceptions.
As this pipeline exhausts—likely in the coming years—new non-vested development will face a near-total halt. The most significant supply constraints may therefore emerge 2027–2030, a period when demand from Portland-metro spillover could remain strong but new inventory options are severely limited.
The city’s preferred long-term solution is a regional partnership: constructing an approximately 10-mile pipeline to route effluent to Gresham’s larger treatment facility. Engineering studies and an intergovernmental agreement were targeted for completion by late 2025, with construction and transition spanning several years thereafter (city estimates point to the late 2020s or early 2030s for full operation).
Until then, the Consent Decree and state law require ongoing limits on connections that increase wastewater flows.
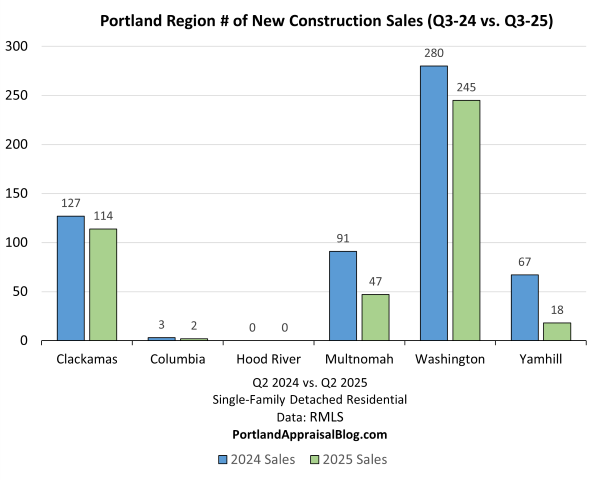
Regional Ripple Effects
Sandy’s constraints will soon begin to influence broader county trends. New single-family detached sales in the Portland region show Washington County maintaining strong dominance in volume, with Clackamas County (home to Sandy) less than half the volume. As Sandy’s vested backlog thins, Washington County’s lead in regional new construction is likely to grow.
The Rising Cost of Connection
The Clean Waters program and eventual Gresham partnership come with substantial financial implications for ratepayers and future development.
To fund the estimated $211–$245 million total program cost, Sandy has implemented significant rate increases. Residential sewer bills now include a base fee of $35.08 per month plus a usage charge of $9.00 per CCF (Centum Cubic Feet; one CCF equals 100 cubic feet of water, or approximately 748 gallons—a common billing unit for utilities).
For a typical household using 7–10 CCF per month, the extra $40–$50 per month over comparable Gresham rates is equivalent to the cost of two streaming services or a budget gym membership. With projected annual increases of 10–15% to service the program’s debt, this gap is expected to widen in coming years—potentially adding $6,000 or more in additional costs per household over a decade.
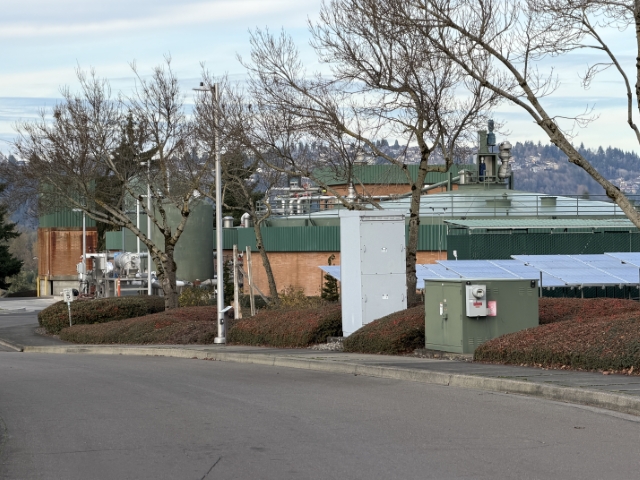
Entrance sign for the Gresham waster water treatment plant. This facility is substantially larger than the one in Sandy and has excess capacity and has reached energy net zero. Photo: Abdur Abdul-Malik, Portland Appraisal Blog (CC BY-SA 4.0)Anaerobic digestion tanks with green roofs and associated buildings at the City of Gresham Wastewater Treatment Plant, 20015 NE Sandy Blvd, Gresham, Oregon. View from the entrance road shows solar panels and part of the biogas production and sludge stabilization facilities. Photo: Abdur Abdul-Malik, Portland Appraisal Blog (CC BY-SA 4.0)
Cost Category
HistoricalBaseline (Sandy)
Current/Projected (2025–2026+)
Gresham Benchmark
Total Program Cost
N/A
$211–$245 million
N/A
Monthly Base Rate
~$30
$35.08
$27.18
Usage Rate (per CCF*)
~$7.76
$9.00
$2.41
Est. Monthly Bill (Avg User)
~$55–$65
~$75–$85+ (with increases)
~$44–$51
SDC (Detached SFR)
~$3,000–$5,000
Under review (likely higher)
$7,915
*CCF = 100 cubic feet (~748 gallons). For reference, the average Sandy household uses 7–10 CCF per month. Rising costs reflect the scale of required upgrades and regional partnership. Future SDCs may include contributions to Gresham capacity.
These higher ongoing expenses represent a notable shift. Once the moratorium lifts and regional capacity is online, the elevated barrier to entry—through both system development charges and monthly utility costs—may alter the economics of large-scale new construction compared to the 1998–2023 boom period. The full impact on development feasibility remains to be seen.
Vacant Land and Interim Use
For vacant lots without vested rights, the moratorium creates a prolonged holding period. Highest and best use as immediate residential development is no longer supportable; instead, these parcels function as speculative holds for future development—potentially until the Gresham pipeline is operational around 2030.
This interim use introduces time-value considerations in appraisals: discounted cash flow adjustments for the delay in realizing development potential, alongside uncertainty over final SDC levels and rate structures.
Alternative Development Paths
The moratorium explicitly exempts developments using on-site septic systems, provided they meet Clackamas County health standards for soil percolation, setbacks, and reserve areas (typically requiring ~1 acre minimum for public water, or 2 acres with a well, plus ~10,000 square feet for drainfield and reserve).
This carve-out may encourage a shift in strategy for owners of larger parcels (0.5–2+ acres), particularly on the city’s fringes or within the Urban Growth Boundary. Subdividing such lots into multiple sewer-ready parcels is blocked, as it requires new connections. However, keeping the lot intact and building a single home on septic remains permitted. In fact, owners of adjacent parcels may explore assemblage to create lots large enough to support a single septic system, potentially keeping otherwise vacant land financially viable during the holding period.
Builders—especially spec or custom operators rather than high-volume tract developers—may pivot to this model: larger, high-end homes on assembled junior-acreage or full-acreage sites. This path preserves lot size (necessary for septic viability), limits density, and carries higher upfront costs (~$20,000–$40,000 for the system) plus ongoing maintenance. It is likely most viable for luxury or custom builds, where buyers prioritize space, privacy, and views over urban density.
Over time, this could slow the historical trend toward smaller lots and denser subdivisions (evident in the -15% to -17% correlation between year built and lot size for 1998–2025 sales). Parcels with proven septic suitability may command a premium as one of the few remaining routes to truly new construction.
Market Implications
With new greenfield or large-scale subdivisions effectively paused, buyers will continue relying on existing inventory, including new construction homes already vested. Older properties with existing sewer connections—particularly marginal or teardown candidates—may see increased redevelopment interest, though additions or replacements that increase flows remain prohibited, capping rebuild scale on many lots.
Sandy’s housing market is beginning to adapt to reduced new supply. The next several years will test how it performs under prolonged constraints—until regional capacity finally arrives.
Takeaway
Sandy’s story is a microcosm of a larger challenge facing many growing communities in Oregon and beyond: infrastructure rarely keeps pace with demand. For nearly three decades, new homes made up ~27% of all single-family sales—nearly three times the regional norm—with peaks above 60% in the early 2000s. That pace was extraordinary, but it came at a cost: an aging 1965 treatment plant overwhelmed, permit violations, federal penalties, and now a multi-year moratorium on new sewer connections.
The data reveals a market in transition. The 2024 drop to 10.3% new construction share was an early warning of the supply squeeze, even as 2025 rebounded to 26.1% (likely the final surge from vested projects). While 2026 may still see decent new home closings from the remaining backlog, the real constraints are likely still ahead—potentially dipping to low single-digit percentages (or even near 1%) in the 2027–2030+ period as non-vested development faces a near-total halt.
The long-term fix—a 10-mile pipeline to Gresham—is underway, with engineering studies and intergovernmental agreements targeted for late 2025. However, as of early 2026, it appears the formal IGA between Sandy and Gresham has not yet been signed, illustrating how even well-planned large-scale infrastructure projects frequently encounter delays due to permitting, coordination, terrain challenges, or cost overruns. Such delays could push pipeline completion well into the 2030s and prolong constraints on new supply.
As a result, builders will likely shift their focus to jurisdictions or areas with existing capacity (e.g., neighboring counties or sewered infill sites), further concentrating regional new construction outside Sandy. The next several years will test how the market adapts to prolonged limits—rewarding existing inventory, redevelopment on sewered lots, and alternative paths on larger parcels—until regional capacity finally arrives.
Sources & Further Reading
This post is based on official public records, direct city documents, EPA filings, and original RMLS data analysis (1998–2025). All links were verified as active on January 08, 2026. For the most current moratorium status, always check the City of Sandy’s development moratorium page.
City of Sandy Official Pages
Development Moratorium Information (main hub – current status, extensions to June 2, 2026, ERU allocation): Link
Equivalent Residential Units (ERUs) Currently Available: Link
Sandy Clean Waters Program (project overview, Gresham pipeline, upgrades, $211–$245 million cost range): Link
Wastewater Consent Decree Settlement (city summary and supporting documents): Link
EPA Approves New Sewer Capacity for Sandy (2024 ERU increase details): Link
Adopted Budget 2025–2027 ($188 million biennial budget reference): Link
Thanks for reading—I hope you found a useful insight or an unexpected nugget along the way. If you enjoyed the post, please consider subscribing for future updates.
CODA
Are you an agent in Portland who wonders why appraisers always do “x”?
A homeowner with questions about appraiser methodology?
If so, feel free to reach out—I enjoy connecting with market participants across Portland and the surrounding counties, and am always happy to help where I can.
And if you’re in need of appraisal services in Portland or anywhere in the Portland Region, we’d be glad to assist.
The Ritz-Carlton Residences Portland closed only 11 of 132 units in 2024–2025 at an average $274,000 reduction from original list, illustrating external obsolescence and violation of the principle of conformity in downtown Portland’s soft condo market.
Block 216 (The Ritz-Carlton, Portland hotel and Ritz-Carlton Residences) viewed from West Burnside Street, Portland, Oregon. Photo: Steven Walling via Wikimedia Commons (CC BY 2.0)
As 2025 draws to a close, Block 216—Portland’s tallest residential tower at 460 feet and 35 stories—stands as a prominent feature of the downtown skyline. Completed in 2023–2024, the mixed-use project includes The Ritz-Carlton, Portland hotel on the lower floors and 132 branded luxury condominiums above, marketed as the Ritz-Carlton Residences, Portland.
Launched with considerable optimism for a post-pandemic downtown revival, the residences were positioned as the pinnacle of urban luxury living—complete with Ritz-Carlton service access, premium finishes, and panoramic views. Original list prices ranged from $850,000 to $7,850,000.
Yet the market response has been markedly different. As of December 31, 2025, only 11 units have closed. The original developer transferred the unsold inventory to the lender via deed in lieu of foreclosure in summer 2025, and Christie’s International Real Estate Evergreen was appointed exclusive brokerage in December 2025, with significant price reductions (starting at 50%) scheduled for January 2026.
This appraisal deep dive examines the project’s sales and listing history through RMLS data, placing it within the broader context of the Portland Downtown condominium market and highlighting key valuation principles brought into sharp relief.
Timeline of Key Developments
2019–2023: Block 216 construction and pre-sales period. Residences marketed under Ritz-Carlton branding license as ultra-luxury product with hotel amenity access.
2024: Tower completion and public launch of condominium sales under LUXE Forbes Global Properties. Phased marketing begins.
Late 2023–early 2025: Eleven closings recorded in RMLS, eight of which show 0 days on market (indicative of off-market or exclusive arrangements).
Summer 2025: Developer executes deed in lieu of foreclosure, transferring bulk unsold inventory to lender Ready Capital—a project-level transaction, not individual buyer foreclosures. Public records confirm the hotel portions of Block 216 transferred to a lender REO entity in July 2025.
December 2025: Christie’s International Real Estate Evergreen appointed exclusive brokerage; major price repositioning announced for January 2026.
The Portland Downtown Condominium Market: A Soft Backdrop
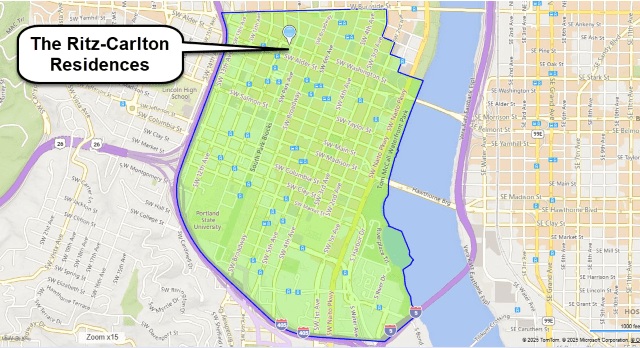
The Ritz-Carlton Residences are located in the City of Portland’s “Portland Downtown” neighborhood—the central area immediately south of the Pearl District, encompassing the West End and cultural district around Pioneer Courthouse Square and the South Park Blocks.
The Ritz-Carlton Residences, Portland (Block 216) within the City of Portland’s “Portland Downtown” neighborhood boundary, immediately south of the Pearl District. Map via Bing Maps
This area offers exceptional walkability and proximity to cultural institutions, but the condominium market has remained soft for years. From 2022–2025, 482 condominium sales closed in the neighborhood at an average price of $407,358 and $372 per square foot. Units averaged 1,109 square feet in size, with an average year built of 1982 and average monthly HOA fees of $784.
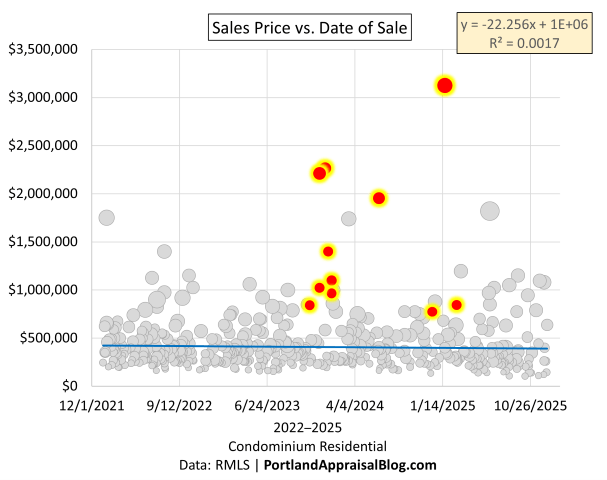
The scatterplot below illustrates the price distribution over time:
Sales Price vs. Date of Sale for condominiums in Portland’s Downtown neighborhood (2021–2025). All points are sized proportionally by total square feet. Gray dots represent all other sales; colored dots are the 11 closed sales at the Ritz-Carlton Residences, Portland. The Ritz units closed well above the neighborhood norm.
Sales prices have shown remarkable stability—remaining largely in the $200,000–$1.2 million range, with the historical high (prior to Block 216) at $3.065 million from a 2017 transaction. This stagnation reflects persistent oversupply and slow absorption in the urban core.
The table below quantifies the contrast between the neighborhood and the Ritz-Carlton Residences:
Metric
Portland Downtown (482 sales)
Ritz-Carlton (11 sales)
Insight
Avg Close Price
$407,358
$1,500,364
Ritz closed at 3.7× the neighborhood average.
Avg PPSF
$372.27
$1,052.73
Ritz realized 2.8× higher PPSF—still far above neighborhood norm.
SP/OLP %
93.29%
84.48%
Ritz required significantly larger price reductions from original list to close.
Avg Year Built
1982
2023
Ritz is brand-new vs. 40+ year-old neighborhood average.
Avg Total SF
1,109
1,363
Ritz units larger on average.
Avg HOA Monthly
$784
$2,402
Ritz HOA 3× higher—significant carrying cost difference.
Avg CDOM
114
25
Skewed by Ritz exclusives; real public marketing time much longer.
Data: RMLS | Portland Appraisal Blog
The Ritz-Carlton Residences: Pricing Premise vs. Market Reality
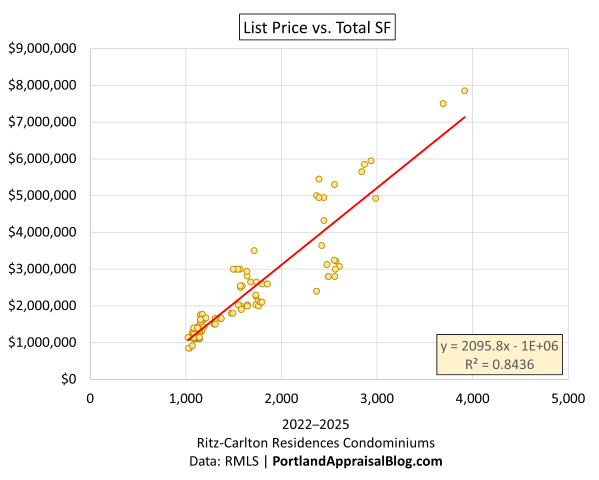
Of the 132 total residences, 71 distinct units were publicly marketed in phases—full release of floors 21–23 (the “entry-level” tiers) and selective listings on higher floors. These 71 units generated 105 separate listing records in RMLS, with a median of 145 days per active spell and many accumulating 400+ cumulative days across repeated expirations and re-lists.
Only 11 closings were recorded:
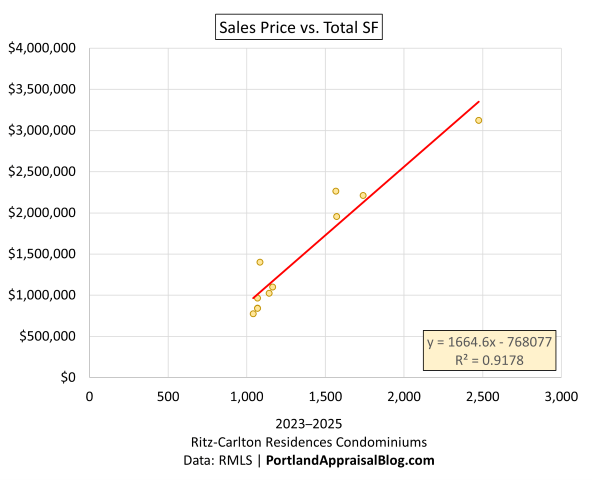
Average sold price $1,500,364 (average reduction of $274,000 from original list price per unit).
Average PPSF $1,053 (marginal trend from regression ~$1,665).
These closings occurred between late 2023 and February 2025, with no additional sales recorded in the remainder of the year.
The developer’s original pricing was highly disciplined and size-driven:
List Price vs. Total Square Feet for the 71 marketed units at the Ritz-Carlton Residences, Portland (2022–2025). Trend implies ~$2,096 per square foot.
The closed sales followed a similar pattern but at a lower level:
Sales Price vs. Total Square Feet for the 11 closed sales at the Ritz-Carlton Residences, Portland (~$1,665 marginal PPSF trend, average realized $1,053/psf).
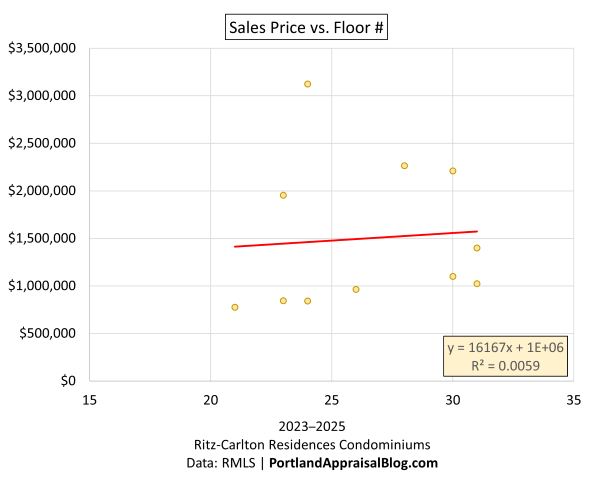
Among the 11 closed sales (primarily on floors 21–31), no discernible premium for higher floors was observed in realized prices:
Sales Price vs. Floor Number for the 11 closed sales at the Ritz-Carlton Residences, Portland (floors 21–31). R² near zero—no contributory value observed for higher floors in current data; upper floors remain unsold.
Notably, eight of the 11 closings showed 0 days on market—likely off-market or exclusive arrangements. The publicly marketed units faced far greater resistance.
The Inclusionary Housing Obligation and Additional External Pressure
Portland’s Inclusionary Housing program requires new residential developments of 20 or more units to either include affordable units or pay a fee-in-lieu. For Block 216, the developer initially proposed 26 on-site affordable units during the entitlement phase but switched to the fee option in 2023.
On-site inclusion proved functionally challenging: even with restricted sale prices, the project’s elevated monthly HOA dues (averaging $2,402 across closed sales) and luxury service model would likely exceed income qualifications for targeted buyers. The calculated fee-in-lieu obligation totaled approximately $7.8 million (base plus interest) and was due December 31, 2025.
Following the summer 2025 deed-in-lieu transfer to lender Ready Capital, uncertainty remains regarding collection of this amount. As of the post date, it is unknown whether the fee has been paid. If unpaid, it would represent an additional external factor appraisers must consider—a financial encumbrance separate from the physical improvements that may influence marketability and value reconciliation for both unsold inventory and existing ownerships.
Appraiser Perspective: The Principle of Conformity and External Obsolescence
The original pricing strategy for the Ritz-Carlton Residences appears to have been calibrated to the Pearl District rather than the property’s actual location in Portland Downtown. The Pearl has demonstrated a proven ceiling around $7 million for top-tier condominiums, as detailed in an earlier Portland Appraisal Blog post analyzing that market over the past decade. In contrast, the highest condominium sale in the Portland Downtown neighborhood prior to Block 216 was $3.065 million in 2017.
By listing units up to $7.85 million, the developer effectively positioned the project outside the neighborhood’s historical range of conformity—a principle of appraisal theory that holds value is maximized when a property aligns with prevailing market expectations in its location. The resulting resistance illustrates how site-specific external factors can override new construction, branding, and amenity premiums.
This pricing strategy mirrors a common challenge appraisers encounter when reviewing sale transactions or proposed listings: comparable sales selected from superior or more established submarkets to support an optimistic value conclusion. The uniform price reductions required on closed sales (average $274,000 reduction from original list price per unit) and prolonged adverse listing history on the unsold inventory further demonstrate concentrated external obsolescence within an already challenged submarket.
Outlook and Implications for Owners and Lenders
The January 2026 price repositioning may improve absorption at levels more aligned with neighborhood norms. However, the influx of discounted intra-building comparable sales could create reconciliation challenges for appraisals of the existing 11 ownerships—particularly the eight early exclusive buyers who closed near original asks.
Lenders and owners of recently purchased units should monitor upcoming sales closely, as distressed marketing conditions on remaining inventory can influence market value indications even for arms-length prior transactions.
For developers and lenders contemplating future high-rise condominium projects in the urban core, the Block 216 experience underscores the importance of grounding pricing premises in location-specific comparable data rather than aspirational benchmarks from adjacent submarkets.
Sources & Further Reading
Christie’s International Real Estate Evergreen appointment and price repositioning announcement: Press Release
The Portland Pearl District Condo Market – The Last 10 Years (2015–2024): Portland Appraisal Blog
Thanks for reading—I hope you found a useful insight or an unexpected nugget along the way. If you enjoyed the post, please consider subscribing for future updates.
CODA
Are you an agent in Portland who wonders why appraisers always do “x”?
A homeowner with questions about appraiser methodology?
If so, feel free to reach out—I enjoy connecting with market participants across Portland and the surrounding counties, and am always happy to help where I can.
And if you’re in need of appraisal services in Portland or anywhere in the Portland Region, we’d be glad to assist.
Q3 2025 Portland Region condo data reveals only 5% of sales are realistically affordable for senior households on median fixed incomes, despite condos being an ideal downsizing option.
Entrance detail of the Empress Condominiums in Northwest Portland—a 1927 building exemplifying the historic character of many pre-1970 condominium conversions in the region. Photo: Abdur, Abdul-Malik, Portland Appraisal Blog (CC BY-SA 4.0)
Condominiums have long been viewed as an ideal downsizing option for seniors seeking lower-maintenance ownership, potential aging-in-place features, and proximity to urban amenities. National narratives—including recent discussions of a “silver tsunami” of baby boomer downsizers—often highlight condos as a key solution for older households looking to “rightsize.”
Yet Q3 2025 condominium closed-sales data from the Portland Region reveals a starkly different reality for seniors reliant on typical fixed incomes.
Using the Portland Appraisal Blog Affordability Index (PABAI)—a distribution-averaged metric calculated individually for each transaction based on actual sale price, reported HOA dues, and property taxes, combined with current mortgage rates, insurance estimates, and a conservative 20% down payment with 28% qualifying ratio—only 5.4% of the 651 condominium sales (35 units) generated a monthly carrying cost affordable on a median senior household income of approximately $68,284.
This analysis focuses exclusively on single-family residential class condominiums across the Portland Region—the six-county area that is the focus of this blog.
The Equity Divide in the Condo Market
Financing terms, as reported by listing agents in RMLS, tell much of the story (see table below). Cash purchasers accounted for 33.8% of transactions (220 sales) and paid the highest average price ($407,000) while accepting the highest average monthly HOA dues ($669). Conventional financing dominated another 54.1%, reflecting buyers with strong credit and often substantial down payments.
Financing Type
% of Sales
# Sales
Avg Close Price
Avg Monthly HOA
Cash
33.8%
220
$407,000
$669
Conv.
54.1%
352
$365,000
$460
FHA
8.0%
52
$283,000
$403
VA
2.6%
17
$340,000
$356
Q3 2025 Portland Region condominium financing terms as reported by listing agents in RMLS, showing average close price and monthly HOA dues by type. (Top 4 financing types only.) Data: RMLS | Portland Appraisal Blog
In contrast, FHA financing—typically associated with lower down payments and more income-sensitive qualification—represented only 8.0% of sales, with an average close price of $283,000 and more moderate HOA dues ($403 monthly).
This segmentation underscores a clear divide: equity-rich seniors downsizing from detached homes can readily access the market, often paying cash or leveraging large down payments to absorb elevated carrying costs. Seniors without significant prior home equity, reliant primarily on Social Security, pensions, or modest retirement savings, face severe barriers.
Price Distribution and the Narrow Affordable Tier
Q3 2025 condominium sales clustered heavily in the $200,000–$400,000 range, but the truly affordable segment for median senior incomes proved far smaller.
Price Band
# Sales
% of Total
Avg Close Price
Avg Year Built
Avg Monthly HOA
Under $200k
53
8%
$164,000
1968
$461
$200–299k
216
33%
$255,000
1984
$500
$300–399k
203
31%
$346,000
1997
$431
$400–499k
89
14%
$443,000
1999
$492
$500k+
90
14%
$779,000
1997
$889
Q3 2025 Portland Region condominium sales distribution by price band, with average year built and monthly HOA dues. Data: RMLS | Portland Appraisal Blog
The 35 units affordable under conservative PABAI assumptions were overwhelmingly concentrated in the under-$200,000 and lower $200,000–$299,000 bands—older, smaller properties that appear accessible on purchase price alone.
Age, Obsolescence, and Elevated Carrying Costs
Older condominiums—many conversions of pre-1970 apartment buildings — present particular valuation challenges. The table below excludes new construction deliveries, as agent-reported HOA dues for newly completed projects are often provisional or incomplete.
Year Built Bracket
# Sales
Avg Close Price
Avg Sq Ft
Avg Monthly HOA
Avg HOA per Sq Ft
Pre-1970
95
$304,000
977
$572
$0.67
1970–1989
194
$309,000
1,146
$575
$0.52
1990–1999
43
$388,000
1,117
$555
$0.52
2000–2009
199
$443,000
1,265
$661
$0.54
2010+
51
$474,000
1,394
$284
$0.26
Average Q3 2025 condominium characteristics by year-built bracket (new construction excluded due to provisional HOA reporting). Pre-2010 stock shows markedly higher HOA burden per square foot. Data: RMLS | Portland Appraisal Blog
Pre-1970 stock carries the highest average HOA dues per square foot ($0.67), reflecting ongoing capital needs for aging systems, reserves, and occasional special assessments. This elevated recurring cost creates meaningful external obsolescence for income-constrained buyers, even when entry prices appear lower.
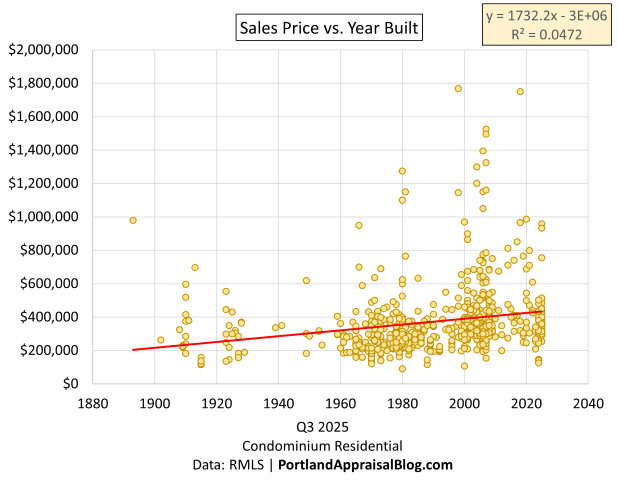
A scatterplot of sales price against year built further illustrates this dynamic. While newer construction generally commands higher prices, the weak correlation (R² = 0.047) confirms that factors beyond age—location, views, amenities, and building quality—dominate value. Older units cluster at lower prices, yet as shown above, they often carry disproportionately high recurring costs.
Sales Price vs. Year Built — Q3 2025 Portland Region condominiums (651 sales). The weak correlation (R² = 0.047) illustrates that location, amenities, and building quality drive value far more than age alone.
County-Level Consistency
The challenge persists across the Portland Region:
County
# Sales
% Affordable for Seniors
Multnomah
426
6.3%
Washington
144
3.5%
Clackamas
69
4.4%
Portland Region Total
651
5.4%
Share of Q3 2025 condominium sales affordable under conservative PABAI assumptions, by county. Data: RMLS | Portland Appraisal Blog
No county offers a meaningful suburban relief valve for fixed-income seniors. (Over 98% of Q3 2025 condominium sales occurred in the three counties in the table above.)
Even FHA Terms Do Not Meaningfully Expand Access
Conventional wisdom might suggest FHA financing—with 3.5% down payments and more lenient debt-to-income ratios—would open the market wider for seniors with limited savings. Yet when mortgage insurance premium (0.55% annual) and the resulting larger loan are included, the share of affordable units actually declines to 3.8%.
Higher principal and interest, combined with permanent MIP, outweigh the benefits of lower upfront equity for households with constrained monthly cash flow.
Appraiser Perspective: Comparable Selection and Reconciliation Challenges
When appraising condominiums, comparable selection must account for competitive market segments defined by building age, location, complex-specific amenities, and HOA structure. Units in markedly different projects—for example, a 1960s conversion versus a 2000s high-amenity tower—are rarely direct substitutes.
Differences in functional utility, functional obsolescence, and market-perceived recurring costs often require careful adjustments or exclusion from the primary grid.
Conclusion
While condominiums remain a logical theoretical choice for seniors seeking reduced maintenance and urban access, Q3 2025 condo data demonstrates that ownership is realistically attainable only for those with substantial prior home equity. For senior households reliant primarily on fixed incomes near the median, monthly carrying costs—particularly in older stock with higher HOA burdens—render the vast majority of the market out of reach without additional equity or savings.
Many will continue to rely on rental options or supportive housing models, such as the recently opened Julia West House in Portland, which provides dedicated affordable senior housing.
For many seniors, condominiums represent an appealing downsizing opportunity—yet Q3 2025 data shows monthly carrying costs limit access for those without substantial equity. Via Canva Pro
Sources & Further Reading
The Portland Appraisal Blog Affordability Index: PABAI
National Association of REALTORS discussion of senior downsizing trends: Original Article
Recent coverage of Julia West House supportive senior housing opening: Portland Appraisal Blog
Thanks for reading—I hope you found a useful insight or an unexpected nugget along the way. If you enjoyed the post, please consider subscribing for future updates.
CODA
Are you an agent in Portland who wonders why appraisers always do “x”?
A homeowner with questions about appraiser methodology?
If so, feel free to reach out—I enjoy connecting with market participants across Portland and the surrounding counties, and am always happy to help where I can.
And if you’re in need of appraisal services in Portland or anywhere in the Portland Region, we’d be glad to assist.
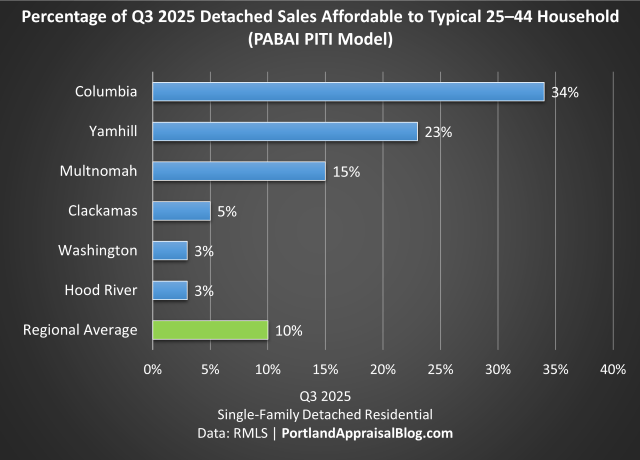
Q3 2025 data shows only 10% of detached homes in the Portland Region were affordable to typical 25–44 households under realistic PITI assumptions using the Portland Appraisal Blog Affordability Index—explaining why first-time buyers have little choice but to wait until age 40.
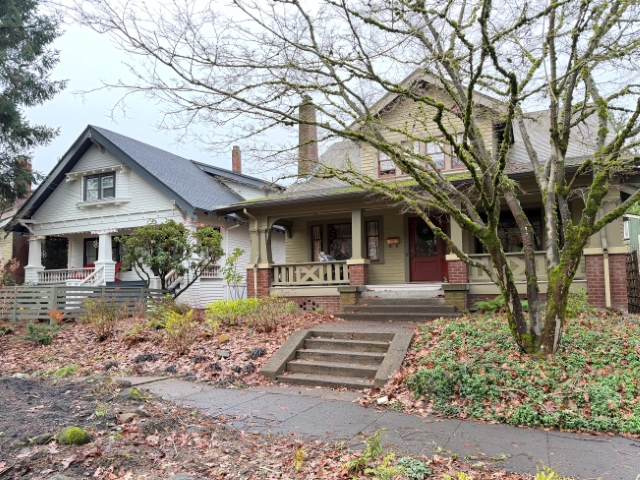
Classic Craftsman bungalows homes in a Portland neighborhood. While older detached stock like this offered relatively better access for younger buyers in Q3 2025 (15% affordable in Multnomah County under realistic PITI assumptions), many close-in properties commanded premium prices—this example on the right sold for $1.1 million. Photo: Abdur Abdul-Malik, Portland Appraisal Blog
The National Association of Realtors recently reported that the median age of first-time home buyers has reached 40—the highest on record—with their share of purchases falling to a historic low of 21%. These trends are driven by affordability challenges that national indices like NAR’s Housing Affordability Index attempt to measure.
Using NAR’s standard methodology (principal and interest only, 25% qualifying ratio), approximately 28% of Q3 2025 detached single-family sales in the six-county Portland region were affordable to a household earning the area’s median income of $124,100.
In reality, no buyer escapes property taxes or homeowners insurance. When we incorporate actual taxes from listings and a conservative insurance estimate into the full monthly payment (PITI, 28% ratio), affordability drops to 20% for that same benchmark household.
To provide a more accurate local measure, this analysis introduces the Portland Appraisal Blog Affordability Index (PABAI)—a PITI-based index designed for the Portland Region’s residential market. Like traditional housing affordability indices, the PABAI expresses affordability as an index value where 100 means a household at the reference median income can exactly qualify for the typical home under realistic lending conditions. Values below 100 indicate unaffordability. A secondary calculation—the percentage of sales affordable to that reference household—derives directly from the index and serves as the primary insight in this post. For the overall Portland Region benchmark (using HUD’s Area Median Income of $124,100), the PABAI stood at approximately 78—confirming an unaffordable market even before drilling into younger households.
The challenge is even more severe for the cohort most people associate with first-time buyers: households headed by someone aged 25–44. With a median income of approximately $110,000 (2024 American Community Survey estimate), the PABAI drops to 69—meaning the typical younger household fell 31% short, with only 9.8% of Q3 detached sales (460 homes out of 4,682) within reach. The typical $600,000 detached home required roughly $159,000 in household income—45% above the cohort median.
Q3 2025 Affordability for Younger Buyers — County by County
Q3 2025 PABAI modeling reveals stark geographic variation for households aged 25–44.
County
Median Q3 Price
Required Income for Median Home
% of Sales Affordable: 25–44 Age Group
Columbia
$471,000
$122,000
34%
Yamhill
$510,000
$132,000
23%
Multnomah
$555,000
$150,000
15%
Clackamas
$675,000
$178,000
5%
Washington
$625,000
$165,000
3%
Hood River
$773,000
$195,000
3%
Regional
$600,000
$159,000
10%
Percentage of Q3 2025 detached sales affordable to typical 25–44 household under the PABAI (PITI model). Affordability modeled using 20% down payment, 28% front-end ratio, actual weekly rates, listing taxes, and 0.40% annual insurance estimate. Data: RMLS | Portland Appraisal Blog
Under the PABAI, outer counties like Columbia (34%) and Yamhill (23%) offered the highest shares of reachable detached homes, but this comes with trade-offs. Homes in these more rural areas typically involve longer commute times to Portland’s core amenities, job markets, and urban services—a key consideration for households prioritizing proximity over initial affordability. More urban Multnomah (15%) outperformed the pricier suburban counties of Washington (3%) and Clackamas (5%). Hood River’s premium inventory made it effectively inaccessible at just 3%.
The suburban counties’ low accessibility reflects their inventory mix. Clackamas County’s average lot size in Q3 sales was 1.07 acres—significantly larger than Washington County’s 0.36 acres or Multnomah’s 0.27 acres—contributing to higher median prices and required incomes well above the 25–44 cohort median. Larger lots and newer improvements demand stronger buyer qualifications, while Multnomah’s denser, older stock provided relatively more options for younger households.
The Realistic Paths to Ownership for Younger Buyers
For most households in their 20s and 30s, entry into the detached-home market in Q3 2025 required one of three things:
Substantial family assistance (gift for down payment, co-signer, or direct equity help).
Extreme lifestyle sacrifice (aggressive saving for larger down payment, renting with multiple roommates far longer, minimal discretionary spending).
Outlier household income (well above the cohort median—e.g., $150,000+ dual incomes early in careers).
Without one of these, even well-qualified younger buyers were effectively priced out until they aged into higher earnings—typically the late 30s or early 40s. Or they had to consider alternative housing options, like condominiums or townhouses.
This dynamic directly explains the national shift toward older first-time buyers and underscores the limited market participation of younger cohorts in the current environment.
Methodology Note
This analysis introduces the Portland Appraisal Blog Affordability Index (PABAI)—a PITI-based metric designed for the Portland region’s residential market (detached single-family, attached homes, condominiums, and manufactured homes on owned land). The PABAI measures the percentage of sales affordable to a reference household under realistic lending conditions. The PABAI can be calculated for distinct property types or the residential market as a whole. For this post, the PABAI is calculated for detached single-family homes only.
Affordability is modeled using a 20% down payment, 28% front-end housing expense ratio (per Freddie Mac guidelines), actual weekly 30-year fixed rates at closing, property taxes from listings, and a conservative 0.40% annual homeowners insurance rate (aligned with 2025 Oregon averages per Bankrate). Unlike national indices that rely on principal and interest only, the PABAI incorporates full PITI for a more accurate reflection of buyer qualification in the Portland region.
For an overall regional benchmark, the PABAI uses HUD’s Area Median Income for a 4-person household in the Portland–Vancouver–Hillsboro MSA ($124,100 as of 2025). In Q3 2025, the PABAI for this benchmark stood at approximately 78—meaning the typical household at the area median income could afford about 20% of detached sales under realistic PITI assumptions.
Reference incomes for specific age cohorts are estimated from the U.S. Census Bureau’s 2024 American Community Survey (Table B19037) using standard linear interpolation on grouped income data. For households aged 25–44, this yields an estimated median of approximately $110,000. This lowers the PABAI to approximately 69 for this age band, placing only 9.8% of Q3 2025 detached sales within reach.
Thanks for reading—I hope you found a useful insight or an unexpected nugget along the way. If you enjoyed the post, please consider subscribing for future updates.
CODA
Are you an agent in Portland who wonders why appraisers always do “x”?
A homeowner with questions about appraiser methodology?
If so, feel free to reach out—I enjoy connecting with market participants across Portland and the surrounding counties, and am always happy to help where I can.
And if you’re in need of appraisal services in Portland or anywhere in the Portland Region, we’d be glad to assist.


