

What Happened This Week
Mortgage rates moved higher this week, with the 30‑year fixed rising to 6.55%—a 6 bps increase from last week and now sitting at the year‑to‑date high. The table below shows where today’s rate sits within the 2026 range, including the February low, last week’s reading, and this week’s breakout to the top of the band.
| Time Frame | Date | Rate | Rate Delta |
|---|---|---|---|
| YTD Low | Feb 26, 2026 | 5.98% | -0.57% |
| Last Week | July 9, 2026 | 6.49% | -0.06% |
| Current Week (YTD High) | July 16, 2026 | 6.55% | — |
January 1, 2026 – July 16, 2026
Primary Mortgage Market Survey® (PMMS®)
Data: Freddie Mac | PortlandAppraisalBlog.com
The broader 2026 pattern remains intact: rates bottomed in late February, climbed sharply through early April, cooled briefly, and then resumed their upward drift beginning April 23. Over the past month and a half, rates have been locked in a narrow, high‑pressure band—oscillating between 6.43% and 6.53%—but this week’s move finally broke that pattern, pushing us decisively to the high side of the 2026 range.
Affordability remains strained at these levels. When rates are elevated, even small increases carry outsized weight, and the week‑to‑week movement—from 6.49% last week to 6.55% today—continues to push monthly payments toward their most challenging point of the year. For buyers operating near qualification limits, these incremental shifts compound quickly and can meaningfully affect which housing types remain viable.
As the charts below show, today’s rate is now pressing against—and slightly exceeding—the upper edge of the 2026 range, and the Portland Appraisal Blog Affordability Index (PABAI) continues to reflect the compounding affordability pressure across the Portland Region.
Table of Contents
- Mortgage Rate Context
- Portland Appraisal Blog Affordability Index (PABAI)
- Affordability Snapshot (This Week)
- TIP: Total Interest Paid — Why Small Rate Moves Matter
- Payment Delta
- Purchasing Power
- Payment Milestones
- Closing Thoughts
- Sources & Further Reading
- Coda
Mortgage Rate Context
Long‑Run View (Since 2000)
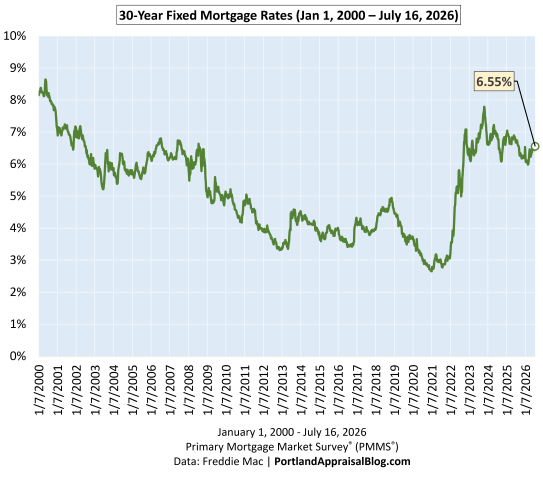
The long‑run chart shows how today’s rate fits into a 25‑year history of mortgage cycles. The early 2000s sat in the 6–8% range, the post‑Great Recession era brought a decade of unusually low rates, and the pandemic period pushed borrowing costs to historic lows. Years after leaving that ultra‑low‑rate environment, the market continues to adjust to more difficult financing constraints, and today’s 6.55% reflects that ongoing shift. With this week’s jump, rates remain elevated in a long‑term context, and affordability continues to be shaped by the same structural pressures highlighted in the medium‑run and short‑run views.
Medium‑Run View (Since COVID)
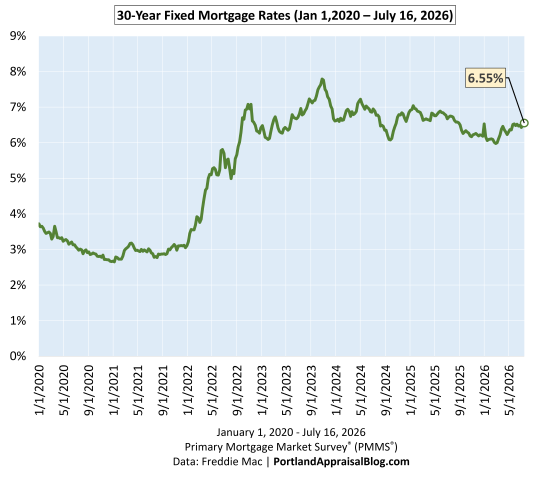
The COVID‑era chart highlights the dramatic rate compression of 2020–2021, the rapid surge of 2022, and the choppy plateau that has defined the past two years. Rates have been oscillating between roughly 6% and 7% since mid‑2023, and today’s 6.55% sits near the upper portion of that band. Volatility has cooled compared to 2022, but the medium‑run trend remains one of elevated and persistent borrowing costs, with the market continuing to adjust to structurally higher financing conditions across the Portland Region.
Short‑Run View (2026 YTD)
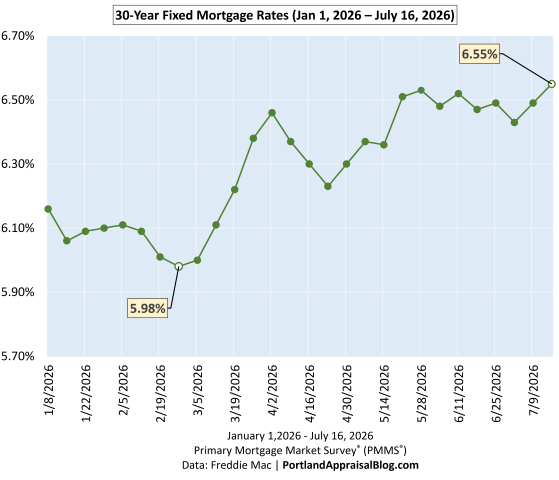
The year‑to‑date chart shows the full shape of the 2026 cycle: a clear bottom at 5.98% on February 26th, a sharp rise into early April, a brief cooldown, and a renewed climb that pushed rates to 6.53% in late May—the highest level of the year at the time. This week’s reading of 6.55% now exceeds that prior peak, establishing a new YTD high and keeping affordability at its most challenging point of 2026. This short‑run pattern is the most relevant for buyers today, as it directly shapes monthly payments and qualifying power across the Portland Region.
Portland Appraisal Blog Affordability Index (PABAI)
What PABAI Measures
The Portland Appraisal Blog Affordability Index (PABAI) is a model that estimates how home sale prices compare to what a median‑income household can qualify for under standard lending assumptions (HUD Portland‑Vancouver‑Hillsboro MSA median income, 20% down, and a 28% DTI for principal, interest, taxes, insurance, and HOA dues).
Unlike national affordability indices, PABAI is built from actual RMLS transactions rather than a single hypothetical price point. It computes an affordability ratio for every closed sale in the Portland Region during the analysis period using rates matched to the date of close, reported taxes, reported HOA dues, and an insurance estimate based on a percentage of the home’s value. The individual affordability ratios are then averaged to produce the reported PABAI value for that period. For Q1 2026, this approach captures the actual mix of homes sold and the financing conditions present at the time those transactions occurred. Each housing segment—detached, attached, condos, and manufactured—is calculated separately, ensuring that segment‑specific dynamics are preserved rather than blended together. This approach provides a more detailed, locally grounded view of Portland‑area affordability and avoids the distortions that occur when fundamentally different housing types are combined into a single regional metric.
A PABAI of 100 means the market is exactly affordable at that income level (the Q1 2026 HUD median MSA income was $124,100 for a family of four). Values above 100 indicate excess qualifying capacity (more affordable), while values below 100 indicate a shortfall (strained affordability). Full methodology and the interpretation scale are available on the PABAI explainer page.
| PABAI Range | Interpretation |
|---|---|
| 120+ | Strongly Affordable |
| 100–119 | Moderately Affordable |
| 80–99 | Strained |
| Below 80 | Severely Constrained |
Q1 2026: Actual vs. Constant‑Rate Affordability
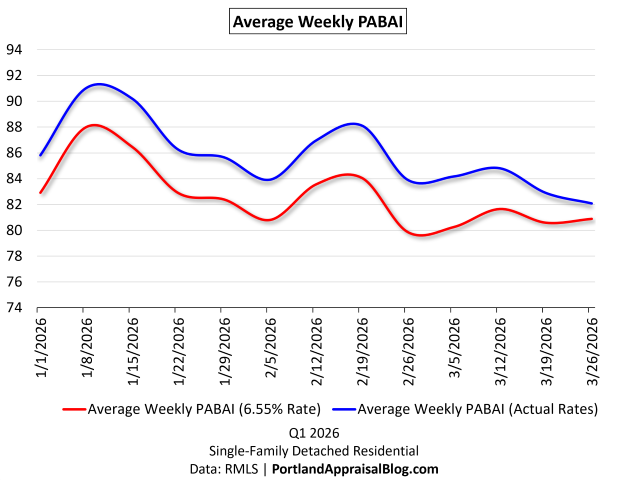
The Q1 chart compares two versions of PABAI: one using actual weekly mortgage rates, and one using today’s rate (6.55%) as a constant. Because the constant‑rate line uses a rate at the very top of the 2026 range, it naturally sits below the actual‑rate line for every week of the quarter. That part isn’t the story.
The key insight is the size and behavior of the gap between the two lines. Early in the quarter, actual rates were meaningfully lower than today’s rate, giving buyers more qualifying power than a flat‑rate environment would suggest. As rates climbed through March, the two lines began to converge—a visual confirmation of how persistent rate increases eroded affordability heading into spring. With today’s 6.55% rate now at the year‑to‑date high, the constant‑rate line sits even closer to the actual‑rate line at the end of Q1, reflecting the tightening affordability conditions that carried into mid‑ and late‑spring across the Portland Region.
Structural Unaffordability and the Seasonal Pattern
Detached homes in the Portland Region remain structurally unaffordable to a household earning the HUD median MSA income. PABAI has been below 100 for years, and Q1 2026 continues that pattern. What the chart makes clear is that winter remains the best window for buyers on tight qualifying budgets: affordability improves when rates soften and seasonal pricing cools. As spring approaches, both rates and prices firm up, and affordability reliably compresses.
With the 30‑year fixed now sitting at the highest level of 2026, the convergence of the two PABAI lines at the end of the quarter reflects the same reality: rising rates have pushed qualifying costs to their weakest point of the year, and the early‑year affordability advantage has largely evaporated. Today’s 6.55% reading keeps affordability firmly in the strained range, underscoring how sensitive the market remains to even small rate movements.
Affordability Snapshot (This Week)
Q1 2026 Affordability Recomputed at Today’s Rate
The table below shows how Q1 2026 affordability metrics change when all 3,349 detached sales are recalculated at this week’s 6.55% rate. This is the clearest way to see how rising rates reshape qualifying power, housing burden, and the share of homes accessible to a median‑income household.
Because today’s rate now sits at the highest point of the 2026 YTD range, the recomputed metrics show a pronounced deterioration in affordability relative to the actual Q1 environment. Required income rises, housing burden increases, and the number of homes affordable to a median‑income household falls sharply—a direct reflection of how elevated rates compound qualifying pressure. Even small movements at these levels materially shift the boundary of what a median‑income buyer can access.
| Metric | Actual Q1 2026 Rates | Recomputed at 6.55% Rate | Change |
|---|---|---|---|
| Average PABAI | 85.45 | 82.26 | -3.19 pts |
| Required income (28% ratio) | $145,236 | $150,858 | +3.87% |
| Median‑income shortfall | 17.03% | 21.56% | +4.53 pts |
| Avg monthly mortgage pmt | $3,932.66 | $4,083.29 | +$150.63 |
| Avg housing burden (DTI) | 38.03% | 39.48% | +1.45 pts |
| # of Affordable homes | 967 | 824 | -143 homes |
| % of homes affordable | 28.87% | 24.60% | -4.27 pts |
HUD Portland‑Vancouver‑Hillsboro MSA median income: $124,100
Data: RMLS (3,349 observations) | PortlandAppraisalBlog.com
How Rising Rates Reshape Affordability
Taken together, these metrics show how quickly affordability erodes when rates rise into the mid‑6% range. The drop in Average PABAI from 85.45 to 82.26 may look modest at first glance, but it represents a meaningful tightening of qualifying power across the entire detached market. Required income rises to roughly $150,900, widening the gap between what a median‑income household earns and what the market demands. That shortfall now reaches 21.56%, a reminder that the typical Portland household remains well outside traditional affordability thresholds.
The payment side tells the same story. Recomputing Q1 sales at today’s rate pushes the average monthly mortgage obligation up by about $150, which may seem incremental on a monthly basis but compounds sharply over a 30‑year horizon. More importantly, the higher rate pushes the average front‑end DTI from 38.03% to 39.48%, a level that would be considered stretched even in more forgiving underwriting environments. These shifts are not abstract; they directly shape who can buy, what they can buy, and how competitive they can be.
The Buyer‑Side Impact
The most visible consequence of these changes is the shrinking pool of homes accessible to a median‑income household. Under actual Q1 2026 rates, 967 detached homes were affordable; at today’s rate, that number falls to 824. In percentage terms, the share of the market within reach drops from 28.87% to 24.60%—a loss of more than four percentage points in a single recalculation. This is the practical expression of rising rates: fewer viable options, tighter qualifying margins, and a market that becomes increasingly selective about who can participate.
For buyers, the experience varies by circumstance but the direction is the same. Households with limited flexibility feel the tightening most acutely, as even small rate movements can eliminate entire segments of the market. Move‑up buyers face a widening payment gap between their current home and the next one, making the trade‑up calculus more difficult unless equity is substantial. Cash buyers, by contrast, gain relative leverage as financed demand thins—though that advantage is uneven across price tiers.
Across all buyer types, the message is consistent: rising rates are reshaping the market in real time, and the affordability landscape at a 6.55% mortgage rate is meaningfully different from the one buyers faced just a few months ago. The shift is incremental week to week, but cumulative in effect—a defining feature of today’s strained affordability environment.
The Seller‑Side Impact
Rising rates don’t just reshape the buyer experience—they influence seller outcomes as well. In the Q1 2026 detached market, cumulative days on market (CDOM) increased 11.26%, and the current rate environment suggests that upward pressure on market times may persist. As affordability tightens and the pool of qualified buyers shrinks, homes that would have moved quickly in a lower‑rate environment may begin to sit longer, particularly in segments where pricing is already stretched.
Today’s 6.55% rate keeps financing conditions at the most challenging level of 2026, reinforcing the same dynamic: fewer qualified buyers, more selective demand, and a market where pricing precision matters. This doesn’t imply an abrupt market slowdown, but it does mean sellers should expect a more deliberate buyer pool and prepare for longer market times—especially in higher‑priced tiers where rate sensitivity is most acute.
TIP: Total Interest Paid — Why Small Rate Moves Matter
Total Interest Paid (TIP) is one of the clearest ways to understand how mortgage rates shape long‑run affordability. While buyers shop based on monthly payment, the lifetime cost of borrowing moves far more dramatically than the payment itself. Even small rate changes can add—or remove—tens of thousands of dollars in interest over the life of a loan.
At today’s 6.55% rate, the lifetime interest on a standard Portland‑area purchase sits far above the levels buyers saw during the pandemic and meaningfully higher than the early‑March lows of this year. The difference between a 5.98% environment and a 6.55% environment may feel subtle on a monthly basis, but over 30 years it compounds into a substantial increase in total repayment—the kind of shift that materially affects long‑run household finances in the Portland Region.
This is why TIP matters: it captures the hidden cost of rising rates. Buyers feel the payment, but the long‑run financial burden is embedded in the interest curve. As the charts below show, the 2026 rate path has pushed TIP to the highest levels of the year, even as the monthly payment has moved more gradually. The cumulative effect is what reshapes affordability—a dynamic that becomes especially clear when comparing TIP across different rate scenarios.
2026 YTD Total Interest Paid

The 2026 YTD TIP chart shows how sharply lifetime borrowing costs have moved as rates climbed through the first half of the year. These calculations are based on the total interest a buyer would pay on the Q1 2026 Portland median‑priced home of $580,000, assuming a 20% down payment and applying the rate effective in each week. This isolates the impact of rate movements alone, holding price and loan structure constant.
The low point came on February 26th, when a 5.98% mortgage rate produced a total interest burden of $535,342. As rates rose through March and into late May, TIP increased steadily, reaching a then year‑to‑date high of $595,104 at the 6.53% rate on May 28th. That’s nearly a $60,000 increase in lifetime interest in just three months, driven entirely by rate movement.
This week’s 6.55% rate pushes TIP to a new year‑to‑date high: the total interest burden at today’s rate is $597,305, exceeding last week’s level and marking the most expensive borrowing environment of 2026 so far. The shape of the chart makes the pattern unmistakable—at today’s price levels, even small rate changes translate into large long‑run cost differences. Buyers feel the monthly payment, but the lifetime interest curve is where the true financial impact of rising rates becomes visible, especially when comparing TIP across different rate environments.
TIP per $1 Borrowed

The TIP‑per‑$1 chart shows how much interest a buyer pays for every dollar borrowed at different mortgage rates. This is the clearest way to visualize the rate sensitivity of long‑run borrowing costs. At the year‑to‑date low of 5.98%, each dollar borrowed generated about $1.1538 in interest over the life of the loan. As rates climbed through the spring, that figure rose steadily, reaching $1.2826 at the late‑May peak of 6.53%.
Today’s 6.55% rate pushes the cost to $1.2873 per $1 borrowed—the highest level of 2026 so far. The line makes the pattern clear: once rates move into the mid‑6% range, each additional uptick adds meaningfully more lifetime interest—a dynamic that becomes especially clear when comparing rate environments side by side.
Regional Interest Delta (RID)
The Regional Interest Delta (RID) models how much total lifetime interest the Portland Region’s Q1 detached‑home buyers would collectively pay when mortgage rates shift. To keep the metric consistent, RID assumes that all 3,349 Q1 detached sales were financed under standard 20%‑down, 30‑year conventional underwriting, even though the actual dataset includes cash purchases and loans under FHA, VA, jumbo, and other programs. Rates are matched to each home’s close date to reflect the real timing of rate movements, but individual buyers may have locked slightly different rates depending on their specific loan terms. This approach provides a clean, apples‑to‑apples way to measure how rate changes affect the region’s total interest burden.
| Scenario | Rate | Total Lifetime Interest | RID |
|---|---|---|---|
| Actual Q1 2026 Pipeline | Actual rate matched to close date | $2,091,901,976 | — |
| Modeled at Today’s Rate | 6.55% | $2,273,517,548 | +$181,615,572 |
Single-family Detached | Q1 2026
Data: RMLS (3,349 observations) | PortlandAppraisalBlog.com
Using those actual matched rates, the region’s Q1 2026 pipeline would generate $2,091,901,976 in lifetime interest. Recomputing the same loans at today’s 6.55% rate increases the total to $2,273,517,548. The difference—the RID—is $181,615,572 in additional lifetime interest.
To put that number in perspective: $152 million is the cost of hollywoodHUB, a 222‑unit affordable housing development in Portland. A single rate shift—applied across one quarter’s mortgage activity—creates a lifetime interest delta larger than the cost of building an entire affordable housing project from the ground up. Today’s RID exceeds that benchmark by nearly $30 million, underscoring how dramatically elevated rates scale when applied across thousands of loans.
RID makes the scale of rate changes unmistakable. What looks like a modest shift at the household level becomes a region‑wide financial impact when applied across thousands of mortgages—a reminder of how sensitive the Portland market remains to even small movements in the 30‑year fixed.
Payment Delta
The Payment Delta shows how monthly affordability shifts as mortgage rates move. Using the Q1 2026 Portland median‑priced home of $580,000 with a 20% down payment, the monthly principal‑and‑interest payment changes meaningfully even with small rate movements.
| Date | Rate | Monthly P&I | Pmt Delta |
|---|---|---|---|
| Feb 26, 2026 | 5.98% | $2,775.95 | — |
| July 9, 2026 | 6.49% | $2,929.74 | +$153.79 |
| July 16, 2026 | 6.55% | $2,948.07 | +$172.12 |
Monthly payment for home using median Q1 2026 price ($580,000) and 20% down.
Primary Mortgage Market Survey® (PMMS®)
Data: Freddie Mac | PortlandAppraisalBlog.com
Monthly payments remain meaningfully higher than the February low. At 5.98%, the Q1 median‑priced home carried a principal‑and‑interest payment of $2,775.95. Today’s 6.55% rate pushes that figure to $2,948.07, a $172.12 increase from the year‑to‑date low. Even the week‑to‑week movement—from last week’s 6.49% to this week’s 6.55%—adds another $18.33 to the monthly payment, a small but noticeable shift for buyers operating near qualification limits.
While the Payment Delta is smaller in scale than the lifetime interest changes shown in TIP and RID, it is the number buyers feel most immediately. For households shopping at the lower end of the market, even a $150–$175 increase can meaningfully affect qualifying ratios, required down payment, or even which housing types remain viable. These shifts often push buyers from detached homes into attached homes or condos, or require sellers to offer concessions or rate buydowns to keep deals together.
Payment Delta remains one of the clearest week‑to‑week indicators of how rate movements translate directly into buyer experience—small changes in rates can quickly reshape what is affordable, especially for affordability‑sensitive buyers.
Purchasing Power
The table below shows how purchasing power has changed since the year‑to‑date low, based on a range of monthly P&I budgets. At February’s 5.98% rate, buyers could finance meaningfully more than they can at today’s 6.55% rate.
| Target Monthly P&I Budget | Purchasing Power at YTD Low Rate (5.98%) | Purchasing Power at Today’s Rate (6.55%) | Change in YTD Low Purchasing Power |
|---|---|---|---|
| $2,000 | $417,875 | $393,478 | -$24,397 |
| $2,500 | $522,344 | $491,847 | -$30,496 |
| $3,000 | $626,812 | $590,217 | -$36,596 |
| $3,500 | $731,281 | $688,586 | -$42,695 |
| $4,000 | $835,750 | $786,956 | -$48,794 |
| $4,500 | $940,218 | $885,325 | -$54,893 |
| $5,000 | $1,044,687 | $983,695 | -$60,993 |
| $5,500 | $1,149,156 | $1,082,064 | -$67,092 |
| $6,000 | $1,253,624 | $1,180,433 | -$73,191 |
Rates are based on the Primary Mortgage Market Survey® (PMMS®)
Data: Freddie Mac | PortlandAppraisalBlog.com
Purchasing power has fallen by $24,397 to $73,191 since the YTD low, depending on the monthly budget. For most buyers in the Portland Region—especially those shopping near the Q1 2026 median price of $580,000—the relevant range is typically $2,500 to $3,000 in monthly P&I. In that bracket, purchasing power has dropped by $30,496 to $36,596, a decline of roughly 5.84%. That is a meaningful shift for buyers operating near their maximum qualification limits.
It’s also important to note that this table reflects principal and interest only. Actual purchasing power is lower once property taxes, insurance, HOA dues, and other housing costs are included. These additional expenses often push buyers out of certain price brackets even when the P&I budget appears workable—a dynamic that becomes especially clear when comparing detached homes, attached homes, and condos.
For sellers, a $30,000–$37,000 reduction in purchasing power at common buyer budgets can materially affect demand. When buyers are stretched, sellers may need to offer concessions or rate buydowns to keep deals together. At today’s 6.55% rate, even modest increases can reshape what buyers can finance, and the cumulative decline from the YTD low remains one of the clearest indicators of affordability pressure in 2026.
Payment Milestones
The table below shows the key payoff milestones for a loan originated this month, with the first payment due on the first of next month. Each milestone reflects how much of the loan has been repaid and how much interest has accrued by that point at today’s 6.55% rate.
| Milestone | % of Loan Paid | Calendar Date | Interest Paid to Date |
|---|---|---|---|
| Early Equity | 10% | Dec-2033 | $212,664 |
| Quarter Paid | 25% | Oct-2040 | $387,176 |
| Half Paid | 50% | Dec-2047 | $525,455 |
| Three-Quarters | 75% | Nov-2052 | $582,627 |
Data: Freddie Mac | PortlandAppraisalBlog.com
These milestones highlight how interest‑heavy the early and middle years of the amortization schedule remain at current rates. At today’s 6.55% rate, early equity arrives in December 2033, roughly seven years into repayment, after $212,664 in interest has already been paid. The halfway point does not arrive until December 2047, by which time cumulative interest reaches $525,455. Even at the 75% milestone in November 2052, interest continues to dominate the totals—a reminder of how slowly principal reduction accelerates at mid‑6% rates.
Milestones like these help illustrate why small rate changes matter: higher rates push each payoff marker further into the future and increase the amount of interest paid before meaningful principal reduction occurs. At today’s rate, principal reduction accelerates only in the later years of the amortization schedule, reinforcing how front‑loaded interest remains throughout the loan’s life. This is the long‑run counterpart to Payment Delta and TIP—the structural impact of rate movement becomes clearest when viewed across decades rather than months.
Closing Thoughts
The story of this week is straightforward: mortgage rates remain elevated, and the effects are visible across every major affordability metric. The PABAI continues to signal structural strain for median‑income households, and the recalculated Q1 data shows how even modest rate movements reshape qualifying power, monthly payments, and the share of homes within reach. The TIP and RID visuals make the pattern clear: higher rates don’t just affect individual buyers—they reshape the long‑run financial burden carried across the entire region.
For buyers, the takeaway is that financing conditions remain tight as we move deeper into early summer. Winter continues to offer the best affordability window, but today’s 6.55% rate means households on the margin feel pressure sooner and more sharply than in prior years. The Purchasing Power table shows how much buying capacity has eroded since the YTD low, with common buyer budgets losing $30,000–$36,000 of reach. Combined with a Payment Delta that now sits more than $170 above February’s low, buyers face tighter qualifying ratios and fewer viable options. Even the Payment Milestones reinforce the same theme: at mid‑6% rates, interest dominates the early and middle years of repayment, delaying meaningful principal reduction.
For sellers, the implications are more subtle but no less real. The Q1 2026 detached market saw CDOM rise more than 11%, and the current rate backdrop suggests that upward pressure on market times may persist. A smaller pool of qualified buyers, reduced purchasing power, and higher monthly payments can translate into longer exposure—especially for homes priced aggressively or positioned in segments where affordability is already stretched. Pricing discipline, strategic concessions, and realistic expectations matter more in this environment than they did during the ultra‑low‑rate era.
As always, the Portland market adapts—sometimes quickly, sometimes reluctantly—but the direction of travel is clear. Higher rates are reshaping both sides of the transaction, and the early summer of 2026 is operating under some of the most constrained financing conditions we’ve seen this year.
Sources & Further Reading
All data presented in this weekly mortgage rate update is based on the Q1 2026 detached homes segment. The data is sourced directly from RMLS and has been subjected to rigorous cleaning and validation processes to ensure reliability for detached single-family residential analysis in the six-county Portland Region. The trends, comparisons, and commentary are the result of original appraisal expertise and independent analysis—not aggregated from secondary sources or news summaries.
- Freddie Mac Primary Mortgage Market Survey® (PMMS®): Dataset
- HUD Portland-Vancouver-Hillsboro, OR-WA MSA: Median Household Income
- Mortgage Rates & the Portland Region Housing Market: Portland Appraisal Blog
- Portland Region Housing Affordability Snapshot – Rates Return to 6.49% (July 9, 2026): Portland Appraisal Blog
- Portland Region Housing Affordability Snapshot – Rates Drop to 6.43% (July 2, 2026): Portland Appraisal Blog
- Portland Region Housing Affordability Snapshot – Rates Nudge Upwards to 6.49% (June 25, 2026): Portland Appraisal Blog
- Portland Region Housing Affordability Snapshot – Rates Dip to 6.47% (June 18, 2026): Portland Appraisal Blog
- Portland Region Housing Affordability Snapshot – Rates Climb to 6.52% (June 11, 2026): Portland Appraisal Blog
- Portland Region Housing Affordability Snapshot – Rates Dip to 6.48% (June 4, 2026): Portland Appraisal Blog
- Portland Region Housing Affordability Snapshot – Rates Rise to 6.53% (May 28, 2026): Portland Appraisal Blog
- The Portland Region – Six-County Market Area Overview: Portland Appraisal Blog
- RMLS Data Challenges: Portland Appraisal Blog
- Portland Affordability Index – PABAI: A Realistic Housing Qualification Metric for the Portland Region: Portland Appraisal Blog
- The Portland Region Q1 2026 Detached Homes Market Update: Portland Appraisal Blog
- The 2025 Portland Region Detached Homes Market in Review: Portland Appraisal Blog

Coda
Thanks for reading—I hope you found a useful insight or an unexpected nugget along the way. If you enjoyed the post, please consider subscribing for future updates.
Are you an agent in Portland who wonders why appraisers always do “x”?
A homeowner with questions about appraiser methodology?
If so, feel free to reach out—I enjoy connecting with market participants across Portland and the surrounding counties, and am always happy to help where I can.
And if you’re in need of appraisal services in Portland or anywhere in the Portland Region, we’d be glad to assist.
About the Author — Abdur Abdul‑Malik, SRA, ASA
Abdur Abdul‑Malik is the founder, author, and publisher of the Portland Appraisal Blog, where he produces original regional and neighborhood‑level housing analytics for the Portland Region. He is a certified residential appraiser serving Oregon and Washington, drawing on RMLS transaction data, public records, and custom segmentation models he has built.
He developed the Portland Appraisal Blog Affordability Index (PABAI), a payment‑based affordability metric built from actual RMLS sales. PABAI incorporates weekly updates based on the prevailing 30‑year fixed mortgage rate, providing a locally grounded measure of housing affordability across the region.
Learn more → PABAI explainer • mortgage rate series • full author bio


