

Photo: Abdur Abdul-Malik, Portland Appraisal Blog
The amount of income required to purchase a detached home in Troutdale declined modestly between 2024 and 2025. While average and median required incomes fell by roughly 4%, the share of detached-home sales classified as affordable under the Portland Appraisal Blog Affordability Index (PABAI) increased dramatically.
The table below compares key required-income metrics across both years.
| Metric | 2024 | 2025 | Change |
|---|---|---|---|
| Avg Required Income | $137,475 | $131,873 | -4.07% |
| Median Required Income | $134,148 | $128,256 | -4.39% |
| Affordable Sales | 7 | 43 | +36 homes |
| % Affordable | 6.25% | 34.96% | +28.71 pts |
Single-Family Detached Residential | 2024 vs. 2025
Data: RMLS | PortlandAppraisalBlog.com
How “affordable” is defined: PABAI calculates the income needed to buy each home using its actual reported price, taxes, HOA dues, and insurance estimate, financed at the Freddie Mac 30-year rate in effect at the time of sale. A home counts as affordable if that required income is at or below the HUD median family income for the Portland-Vancouver-Hillsboro MSA in effect at the time.
At first glance, the affordability gains appear out of proportion to the decline in required incomes. Average required income fell just 4.07%, yet affordable detached-home sales increased from 7 to 43.
Part of the explanation can be found in how ownership costs were allocated.
| Category | 2024 | 2025 | Change |
|---|---|---|---|
| Avg Principal & Interest Share | 82.47% | 82.05% | -0.42 pts |
| Avg Taxes Share | 12.01% | 12.17% | +0.16 pts |
| Avg HOA Share | 0.21% | 0.41% | +0.20 pts |
| Avg Insurance Share | 5.31% | 5.37% | +0.06 pts |
Shares are averaged across all detached sales; sales without HOA dues count as 0% HOA.
Single-Family Detached Residential | 2024 vs. 2025
Data: RMLS | PortlandAppraisalBlog.com
Mortgage principal and interest accounted for roughly 82% of the typical modeled housing payment in both years. While the P&I share declined by only 0.42 percentage points between 2024 and 2025, that small change proved meaningful because detached-home sales were heavily concentrated near the affordability threshold. In a market sitting at the boundary of affordability, even modest improvements in financing costs can move a significant number of homes from unaffordable to affordable.
Taxes and insurance remained relatively stable. HOA dues represented a larger share of modeled ownership costs in 2025, although part of that increase can be attributed to a greater number of HOA-governed homes selling in 2025 (35) than in 2024 (24).
The table above illustrates why mortgage rates matter. When more than four-fifths of a typical housing payment is attributable to financing costs, even modest improvements in mortgage financing conditions can materially affect affordability.
The chart below combines 2024 and 2025 detached-home sales to show where required incomes were concentrated.
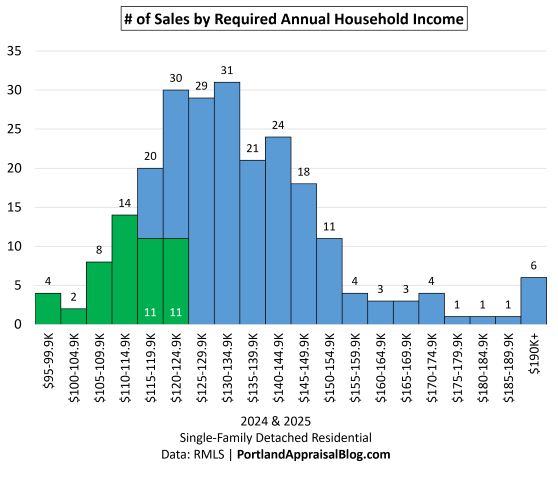
Most detached-home sales required between roughly $115,000 and $149,999 of annual household income. The green bars represent homes that met the PABAI affordability standard in effect at the time of sale.
The first four income bands were naturally affordable because they generally fell below the applicable HUD median family income thresholds throughout the study period. Additional affordable sales appeared in the $115,000-$119,999 and $120,000-$124,999 income bands, reflecting changes in affordability thresholds and financing conditions over time.
The table below summarizes the distribution and includes the percentage of sales in each band, making it easier to evaluate where the market was concentrated.
| Required Income | # of Sales | % of Sales | # Affordable |
|---|---|---|---|
| $95-99.9K | 4 | 1.70% | 4 |
| $100-104.9K | 2 | 0.85% | 2 |
| $105-109.9K | 8 | 3.40% | 8 |
| $110-114.9K | 14 | 5.96% | 14 |
| $115-119.9K | 20 | 8.51% | 11 |
| $120-124.9K | 30 | 12.77% | 11 |
| $125-129.9K | 29 | 12.34% | 0 |
| $130-134.9K | 31 | 13.19% | 0 |
| $135-139.9K | 21 | 8.94% | 0 |
| $140-144.9K | 24 | 10.21% | 0 |
| $145-149.9K | 18 | 7.66% | 0 |
| $150-154.9K | 11 | 4.68% | 0 |
| $155-159.9K | 4 | 1.70% | 0 |
| $160-164.9K | 3 | 1.28% | 0 |
| $165-169.9K | 3 | 1.28% | 0 |
| $170-174.9K | 4 | 1.70% | 0 |
| $175-179.9K | 1 | 0.43% | 0 |
| $180-184.9K | 1 | 0.43% | 0 |
| $185-189.9K | 1 | 0.43% | 0 |
| $190K+ | 6 | 2.55% | 0 |
| Sum | 235 | 100.00% | 50 |
Lower bound inclusive.
Single-Family Detached Residential | 2024 & 2025
Data: RMLS | PortlandAppraisalBlog.com
Nearly three-quarters (73.62%) of all detached-home sales required between $115,000 to $149,999 of annual household income. The single largest income band was $130,000 to $134,999, accounting for 13.19% of all sales.
The market was not dominated by homes requiring substantially more income than the affordability threshold. Instead, many sales clustered immediately around it. As mortgage rates modestly improved during much of the 2025 selling season, required incomes fell enough to bring more homes into the affordability zone. Affordability was also buoyed by a rising HUD median family income for the Portland-Vancouver-Hillsboro MSA: $114,400 in 2024, rising to $124,100 by April 2025 and holding there through year-end.
Rates & slightly higher income tipped the scale.
Related Studies
About PAB Insights
PAB Insights is a Portland Appraisal Blog (PAB) series providing concise, data-driven answers to individual housing-market questions using transaction-level research, local market knowledge, and proprietary models, such as the Portland Appraisal Blog Affordability Index (PABAI).
Sources & Further Reading
All data presented in this PAB Insight is sourced directly from RMLS and has been subjected to our rigorous cleaning and validation process to ensure reliability for detached single-family residential analysis in the six-county Portland Region. The trends, comparisons, and commentary are the result of original appraisal expertise and independent analysis—not aggregated from secondary sources or news summaries.
- RMLS Data Challenges: Portland Appraisal Blog
- The Portland Region – Six-County Market Area Overview: Portland Appraisal Blog
- Portland Affordability Index – PABAI: A Realistic Housing Qualification Metric for the Portland Region: Portland Appraisal Blog
- Mortgage Rates & the Portland Region Housing Market: Portland Appraisal Blog
- City of Troutdale Housing Market Snapshot – 2025: Portland Appraisal Blog
- PAB Insights: What Could Different Household Incomes Buy Among Troutdale’s Affordable Homes?: Portland Appraisal Blog

Coda
Thanks for reading—I hope you found a useful insight or an unexpected nugget along the way. If you enjoyed the post, please consider subscribing for future updates.
Are you an agent in Portland who wonders why appraisers always do “x”?
A homeowner with questions about appraiser methodology?
If so, feel free to reach out—I enjoy connecting with market participants across Portland and the surrounding counties, and am always happy to help where I can.
And if you’re in need of appraisal services in Troutdale or anywhere in the Portland Region, we’d be glad to assist.
About the Author — Abdur Abdul‑Malik, SRA, ASA
Abdur Abdul‑Malik is the founder, author, and publisher of the Portland Appraisal Blog, where he produces original regional and neighborhood‑level housing analytics for the Portland Region. He is a certified residential appraiser serving Oregon and Washington, drawing on RMLS transaction data, public records, and custom segmentation models he has built.
He developed the Portland Appraisal Blog Affordability Index (PABAI), a payment‑based affordability metric built from actual RMLS sales. PABAI incorporates weekly updates based on the prevailing 30‑year fixed mortgage rate, providing a locally grounded measure of housing affordability across the region.
Learn more → PABAI explainer • mortgage rate series • full author bio


