
Photo: Abdur Abdul-Malik, Portland Appraisal Blog
The preceding thirteen studies examined Troutdale’s detached-home market from multiple perspectives, including affordability, financing, property characteristics, ownership costs, marketing times, and pricing outcomes. Together, they reveal a housing market defined by a highly concentrated housing stock, improving affordability, and a pricing environment that generally communicated buyer preferences quickly and clearly.
The studies focused primarily on detached homes because detached housing overwhelmingly dominated Troutdale’s residential market, accounting for more than 93% of all residential sales activity during the study period. Attached homes and condominiums remained present, but transaction volume was comparatively limited.
One of the most useful ways to understand a housing market is to understand what buyers were most likely to encounter. While individual properties varied substantially, the data repeatedly pointed toward a common housing profile.
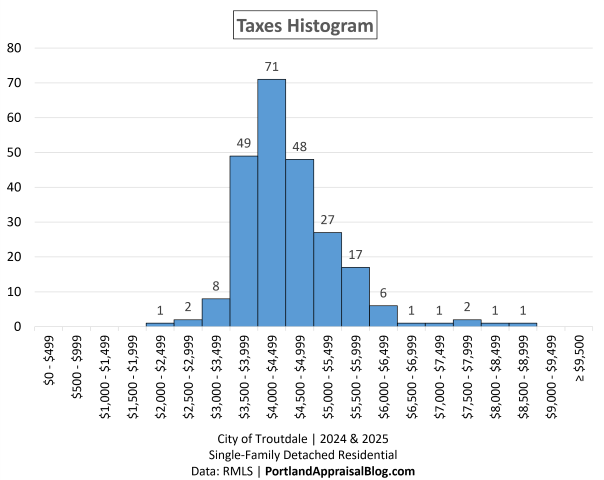
Nearly 80% of detached-home sales occurred between 1,200 and 2,099 square feet, 94.47% were built between 1970 and 2009, 95.32% sat on lots between 0.05 and 0.30 acres, 97.02% contained three or four bedrooms, and 81.70% contained two or two-and-a-half bathrooms. Most sales also reported annual property tax obligations between $3,500 and $4,999.
Taken together, these findings reveal a market dominated by traditional suburban housing. Buyers were most likely to encounter a three- or four-bedroom home with two or two-and-a-half bathrooms, built during one of Troutdale’s major development cycles and situated on a modest suburban lot.
The studies also reveal how Troutdale’s housing stock evolved over time. Homes generally became larger as construction moved into later decades, while lot sizes tended to shrink. One particularly interesting example appeared in the bathroom analysis. Two-bathroom homes averaged 1,446 square feet, while two-and-a-half-bathroom homes averaged 1,937 square feet, a difference of nearly 500 square feet. Those 2.5-bathroom homes were also newer on average, suggesting that what appears to be a minor difference in bathroom count often represented entry into a substantially different segment of the housing stock.
The income required to access Troutdale’s detached-home market also varied considerably.
| Metric | Value |
|---|---|
| Total Detached Sales | 235 |
| Affordable Detached Sales | 50 |
| % Affordable | 21.28% |
| Min Required Income (All Detached Sales) | $95,373 |
| Median Required Income (All Detached Sales) | $131,883 |
| Max Required Income (All Detached Sales) | $242,349 |
Single-Family Detached Residential | 2024 & 2025
Data: RMLS | PortlandAppraisalBlog.com
These figures illustrate the range of household incomes required to purchase homes in Troutdale’s detached-home market under prevailing conditions at the time of sale. Nearly three-quarters of detached-home sales required between approximately $115,000 and $150,000 of annual household income.
Several market indicators softened modestly during 2025. Average home size declined 3.52% and average sales price declined 3.01%. These changes appear related, as somewhat smaller homes composed a larger share of sales during 2025. Activity, however, remained healthy. Detached-home sales increased from 112 to 123 transactions, total dollar volume rose 6.51%, and median marketing time remained essentially unchanged at approximately two weeks. Rather than signaling a fundamentally different market, the data suggest that 2025 was largely the same Troutdale housing market operating with a slightly different mix of homes.
Buyer Insights
The most significant buyer story was the dramatic improvement in affordability during 2025.
Affordable detached-home sales increased from 7 in 2024 to 43 in 2025, while the affordable share of the market rose from 6.25% to 34.96%. Mortgage rates appear to have been the most important factor behind this change. Principal and interest represented roughly 82% of the modeled housing payment under the Portland Appraisal Blog Affordability Index (PABAI), meaning even modest improvements in financing conditions had a meaningful impact on affordability. Smaller homes, modestly lower sales prices, slightly lower property tax burdens, and increasing HUD median family income limits also contributed.
Importantly, PABAI evaluates affordability within the context that existed when a home sold, using prevailing mortgage rates, ownership costs, and the applicable HUD median family income threshold in effect at the time of sale. Viewed through that lens, 50 detached-home sales met affordability standards during the two-year study period.
The affordability studies also revealed a surprisingly uniform affordable housing stock. Among homes classified as affordable under PABAI, increasing income up to the applicable HUD median family income threshold expanded buyer choice far more than it expanded home size. Most affordable homes remained roughly 1,400 to 1,500 square feet on approximately 0.16 acres. The more meaningful differences appeared in property condition, with homes near the upper affordability boundary more often described as updated, remodeled, or turnkey.
For households seeking access to the Columbia River Gorge while maintaining reasonable proximity to Portland, Troutdale continued to offer an attractive affordability alternative within the broader metropolitan area. Improved affordability during 2025 expanded ownership opportunities without fundamentally altering the types of homes available to buyers.
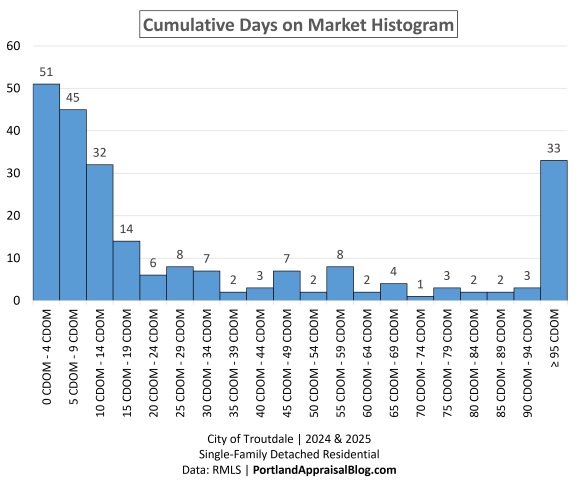
Buyers seeking to enter the Troutdale market, particularly among homes meeting affordability standards, still needed to move quickly. More than 54% of all detached-home sales found a buyer within 14 cumulative days on market, 60.43% sold within 19 days, and 29 of the 50 homes classified as affordable sold within the first 14 days. Affordable opportunities became more common, but they did not necessarily remain available for long.
Seller Insights
The CDOM and SP/OLP analyses revealed a market that generally provided feedback quickly.
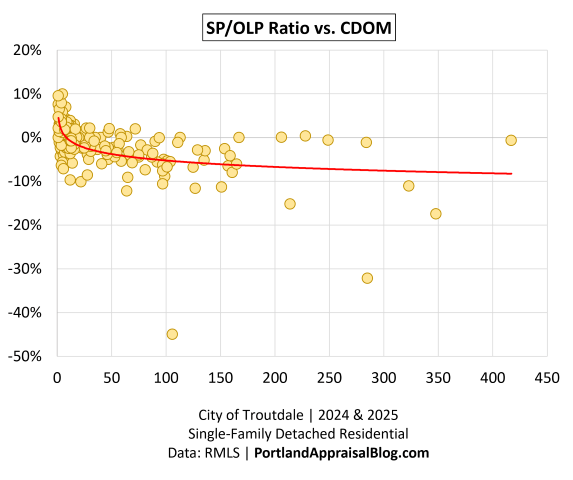
The median detached-home sale closed at exactly 100% of its original asking price, while 51.49% of all sales sold at or above original list price. At the same time, homes generating the strongest SP/OLP outcomes usually sold within only a few days, while weaker pricing outcomes became increasingly associated with longer marketing periods.
The evidence from this study period suggests that sellers whose homes remained on the market beyond roughly three weeks were often receiving important feedback regarding pricing, condition, presentation, or buyer appeal. During the study period, 60.43% of sales found a buyer within 19 days, meaning properties remaining on the market substantially longer than that were no longer competing with the typical outcome observed in Troutdale.
The pricing analysis also revealed an asymmetrical risk profile. Sellers who slightly underestimated the market occasionally benefited from competitive bidding and modest premiums above asking price. Sellers who substantially overestimated the market often encountered a much larger downside through extended marketing periods and eventual price reductions. The potential reward for underpricing was modest; the potential penalty for overpricing was considerably larger.

Photo: Abdur Abdul-Malik, Portland Appraisal Blog
The Big Picture
Taken together, these thirteen studies reveal a housing market characterized by remarkable consistency.
Troutdale’s detached-home market was dominated by a highly concentrated stock of traditional suburban homes built during several major development cycles spanning the 1970s through the 2000s. The market softened modestly during 2025, largely due to compositional effects, yet transaction volume increased, affordability improved substantially, and buyer demand remained strong enough that most homes continued to attract buyers relatively quickly.
For buyers, the study period demonstrated how sensitive affordability can be to financing conditions in a market clustered near the affordability threshold. For sellers, the findings highlighted the importance of pricing discipline in a market that typically communicated buyer preferences quickly and clearly.
For households seeking established suburban neighborhoods, access to the Columbia River Gorge, and reasonable proximity to Portland, Troutdale continued to occupy a distinctive position within the Portland-region housing landscape. The city offered family-friendly housing options in a market where the typical required income remained within reach of many dual-income households.
About PAB Insights
PAB Insights is a Portland Appraisal Blog (PAB) series providing concise, data-driven answers to individual housing-market questions using transaction-level research, local market knowledge, and proprietary models, such as the Portland Appraisal Blog Affordability Index (PABAI).
Sources & Further Reading
All data presented in this PAB Insight is sourced directly from RMLS and has been subjected to a rigorous cleaning and validation process to ensure reliability for detached single-family residential analysis in the six-county Portland Region. The trends, comparisons, and commentary are the result of original appraisal expertise and independent analysis—not aggregated from secondary sources or news summaries.
- RMLS Data Challenges: Portland Appraisal Blog
- The Portland Region – Six-County Market Area Overview: Portland Appraisal Blog
- Portland Affordability Index – PABAI: A Realistic Housing Qualification Metric for the Portland Region: Portland Appraisal Blog
- HUD Portland-Vancouver-Hillsboro, OR-WA MSA: Median Family Income
- City of Troutdale Housing Market Snapshot – 2025: Portland Appraisal Blog
- PAB Insights: What Could Different Household Incomes Buy Among Troutdale’s Affordable Homes?: Portland Appraisal Blog
- PAB Insights: What Income Was Required to Buy a Home in Troutdale (2024-2025)?: Portland Appraisal Blog
- PAB Insights: Which Home Sizes Sold Most Often in Troutdale (2024-2025)?: Portland Appraisal Blog
- PAB Insights: When Were Troutdale’s Homes Built (2024-2025)?: Portland Appraisal Blog
- PAB Insights: What Lot Sizes Defined the Troutdale Market (2024-2025)?: Portland Appraisal Blog
- PAB Insights: Which Bedroom Counts Dominated the Troutdale Market (2024-2025)?: Portland Appraisal Blog
- PAB Insights: Which Bathroom Configurations Sold Most Often in Troutdale (2024-2025)?: Portland Appraisal Blog
- PAB Insights: How Did Buyers Finance Homes in Troutdale (2024-2025)?: Portland Appraisal Blog
- PAB Insights: When Did Homes Sell in Troutdale (2024-2025)?: Portland Appraisal Blog
- PAB Insights: How Long Did It Take Homes to Sell in Troutdale (2024-2025)?: Portland Appraisal Blog
- PAB Insights: Did Troutdale Sellers Get Their Asking Price (2024-2025)?: Portland Appraisal Blog
- PAB Insights: How Much Property Tax Did Troutdale Homeowners Pay (2024-2025)?: Portland Appraisal Blog

Coda
Thanks for reading—I hope you found a useful insight or an unexpected nugget along the way. If you enjoyed the post, please consider subscribing for future updates.
Are you an agent in Portland who wonders why appraisers always do “x”?
A homeowner with questions about appraiser methodology?
If so, feel free to reach out—I enjoy connecting with market participants across Portland and the surrounding counties, and am always happy to help where I can.
And if you’re in need of appraisal services in Troutdale or anywhere in the Portland Region, we’d be glad to assist.
About the Author — Abdur Abdul‑Malik, SRA, ASA
Abdur Abdul‑Malik is the founder, author, and publisher of the Portland Appraisal Blog, where he produces original regional and neighborhood‑level housing analytics for the Portland Region. He is a certified residential appraiser serving Oregon and Washington, drawing on RMLS transaction data, public records, and custom segmentation models he has built.
He developed the Portland Appraisal Blog Affordability Index (PABAI), a payment‑based affordability metric built from actual RMLS sales. PABAI incorporates weekly updates based on the prevailing 30‑year fixed mortgage rate, providing a locally grounded measure of housing affordability across the region.
Learn more → PABAI explainer • mortgage rate series • full author bio