

Photo: Abdur Abdul-Malik, Portland Appraisal Blog
Detached-home sales in Troutdale spanned a wide range of sizes during 2024 and 2025. While sales ranged from under 1,000 square feet to more than 5,000 square feet, most buyers purchased homes within a much narrower range.
The table below compares key home-size metrics across both years.
| Category | 2024 | 2025 | Change |
|---|---|---|---|
| Average Total SF | 1,768 | 1,706 | -62 SF |
| Median Total SF | 1,727 | 1,614 | -113 SF |
| Smallest Sale | 1,089 | 980 | -109 SF |
| Largest Sale | 2,992 | 5,100 | +2,108 SF |
| Total # of Sales | 112 | 123 | +11 homes |
Data: RMLS | PortlandAppraisalBlog.com
Smaller detached homes sold on average in 2025 than in 2024. Average home size declined from 1,768 SF to 1,706 SF, while median size fell from 1,727 SF to 1,614 SF. At the same time, the largest detached-home sale increased from 2,992 SF to 5,100 SF, illustrating the presence of a small upper-end market.
The chart below shows where detached-home sales were concentrated by total square footage during 2024 and 2025.
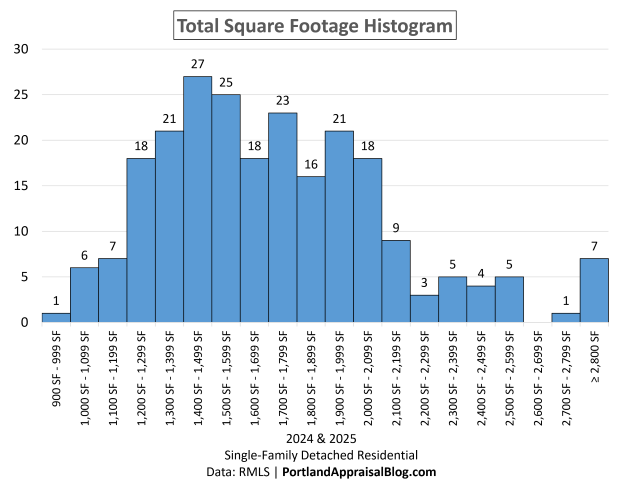
Detached homes smaller than 1,200 SF saw relatively few transactions. The number of sales increased noticeably beginning in the 1,200-1,299 SF range and remained strong through much of the market’s mid-sized ranges, reaching a peak in the 1,400-1,499 SF range, which recorded 27 sales. Other notable concentrations occurred in the 1,500-1,599 SF range (25 sales), the 1,700-1,799 SF range (23 sales), and the 1,900-1,999 SF range (21 sales).
The final size band (≥2,800 SF) serves as a catch-all category for the market’s thin upper tail. Larger detached homes continued to sell throughout the study period, but transaction volume declined substantially beyond roughly 2,100 SF.
The table below summarizes each size band and includes average sale price, average living area, average year built, and average lot size.
| SF Range | Sales | Avg. Close $ | Avg TSF | Avg Yr Blt | Avg Acres |
|---|---|---|---|---|---|
| 900 SF – 999 SF | 1 | $422,500 | 1,060 | 1979 | 0.130 |
| 1,000 SF – 1,099 SF | 6 | $424,167 | 1,074 | 1981 | 0.228 |
| 1,100 SF – 1,199 SF | 7 | $451,286 | 1,146 | 1979 | 0.166 |
| 1,200 SF – 1,299 SF | 18 | $457,244 | 1,251 | 1980 | 0.181 |
| 1,300 SF – 1,399 SF | 21 | $467,995 | 1,351 | 1984 | 0.198 |
| 1,400 SF – 1,499 SF | 27 | $481,009 | 1,443 | 1986 | 0.319 |
| 1,500 SF – 1,599 SF | 25 | $473,312 | 1,555 | 1989 | 0.172 |
| 1,600 SF – 1,699 SF | 18 | $485,436 | 1,641 | 1990 | 0.181 |
| 1,700 SF – 1,799 SF | 23 | $479,465 | 1,752 | 1988 | 0.177 |
| 1,800 SF – 1,899 SF | 16 | $516,053 | 1,851 | 1991 | 0.235 |
| 1,900 SF – 1,999 SF | 21 | $530,940 | 1,947 | 1994 | 0.188 |
| 2,000 SF – 2,099 SF | 18 | $530,242 | 2,042 | 1994 | 0.188 |
| 2,100 SF – 2,199 SF | 9 | $536,222 | 2,156 | 1997 | 0.143 |
| 2,200 SF – 2,299 SF | 3 | $559,300 | 2,240 | 1985 | 0.233 |
| 2,300 SF – 2,399 SF | 5 | $582,600 | 2,333 | 2002 | 0.154 |
| 2,400 SF – 2,499 SF | 4 | $568,750 | 2,434 | 2001 | 0.160 |
| 2,500 SF – 2,599 SF | 5 | $560,780 | 2,541 | 1997 | 0.164 |
| 2,600 SF – 2,699 SF | 0 | — | — | — | — |
| 2,700 SF – 2,799 SF | 1 | $705,000 | 2,778 | 1990 | 0.620 |
| ≥ 2,800 SF | 7 | $743,412 | 3,367 | 1986 | 0.580 |
| Total | 235 |
Data: RMLS | PortlandAppraisalBlog.com
The market was highly concentrated. Homes between 1,200 SF and 2,099 SF accounted for 187 of 235 sales, or 79.57% of all detached-home transactions during the study period.
Within this range, average sale prices increased from approximately $457,000 to a little over $530,000 as home size increased. Most homes in the market’s most active size ranges were built during the 1980s and 1990s, reflecting the era that helped define much of Troutdale’s detached-housing stock.
Despite substantial differences in living area, average lot sizes remained relatively consistent throughout much of the market’s core size ranges.
Troutdale’s detached-home market was highly concentrated between 1,200 SF and 2,099 SF.
Related Studies
About PAB Insights
PAB Insights is a Portland Appraisal Blog (PAB) series providing concise, data-driven answers to individual housing-market questions using transaction-level research, local market knowledge, and proprietary models, such as the Portland Appraisal Blog Affordability Index (PABAI).
Sources & Further Reading
All data presented in this PAB Insight is sourced directly from RMLS and has been subjected to our rigorous cleaning and validation process to ensure reliability for detached single-family residential analysis in the six-county Portland Region. The trends, comparisons, and commentary are the result of original appraisal expertise and independent analysis—not aggregated from secondary sources or news summaries.
- RMLS Data Challenges: Portland Appraisal Blog
- The Portland Region – Six-County Market Area Overview: Portland Appraisal Blog
- City of Troutdale Housing Market Snapshot – 2025: Portland Appraisal Blog
- PAB Insights: What Could Different Household Incomes Buy Among Troutdale’s Affordable Homes?: Portland Appraisal Blog
- PAB Insights: What Income Was Required to Buy a Home in Troutdale (2024-2025)?: Portland Appraisal Blog

Coda
Thanks for reading—I hope you found a useful insight or an unexpected nugget along the way. If you enjoyed the post, please consider subscribing for future updates.
Are you an agent in Portland who wonders why appraisers always do “x”?
A homeowner with questions about appraiser methodology?
If so, feel free to reach out—I enjoy connecting with market participants across Portland and the surrounding counties, and am always happy to help where I can.
And if you’re in need of appraisal services in Troutdale or anywhere in the Portland Region, we’d be glad to assist.
About the Author — Abdur Abdul‑Malik, SRA, ASA
Abdur Abdul‑Malik is the founder, author, and publisher of the Portland Appraisal Blog, where he produces original regional and neighborhood‑level housing analytics for the Portland Region. He is a certified residential appraiser serving Oregon and Washington, drawing on RMLS transaction data, public records, and custom segmentation models he has built.
He developed the Portland Appraisal Blog Affordability Index (PABAI), a payment‑based affordability metric built from actual RMLS sales. PABAI incorporates weekly updates based on the prevailing 30‑year fixed mortgage rate, providing a locally grounded measure of housing affordability across the region.
Learn more → PABAI explainer • mortgage rate series • full author bio


