

Photo: Abdur Abdul-Malik, Portland Appraisal Blog
Cumulative Days on Market (CDOM) measures the total number of days a property was exposed to the market before entering a pending status. Unlike standard Days on Market (DOM), CDOM may accumulate exposure across multiple listings, making it a useful measure of total marketing time.
Understanding how quickly homes sell can provide insight into market absorption, buyer demand, and seller response to market feedback. While some properties attract buyers almost immediately, others remain on the market for months before eventually finding a buyer.
The table below compares how long detached homes took to sell in Troutdale during 2024 and 2025.
| Category | 2024 | 2025 | Change |
|---|---|---|---|
| Average CDOM | 39.07 | 42.25 | +3.18 days |
| Median CDOM | 12.50 | 13.00 | +0.5 days |
| Highest CDOM | 417 | 285 | -132 days |
| Total # of Sales | 112 | 123 | +11 homes |
Single-Family Detached Residential | 2024 vs. 2025
Data: RMLS | PortlandAppraisalBlog.com
Marketing times remained remarkably stable between the two years. Average CDOM increased from 39.07 days in 2024 to 42.25 days in 2025, while median CDOM increased only 0.5 days, from 12.5 to 13.0 days. Although a small number of long-marketing properties influenced averages, the typical detached home sold in approximately two weeks during both years.
The chart below shows where detached-home sales were concentrated by CDOM bracket during 2024 and 2025.
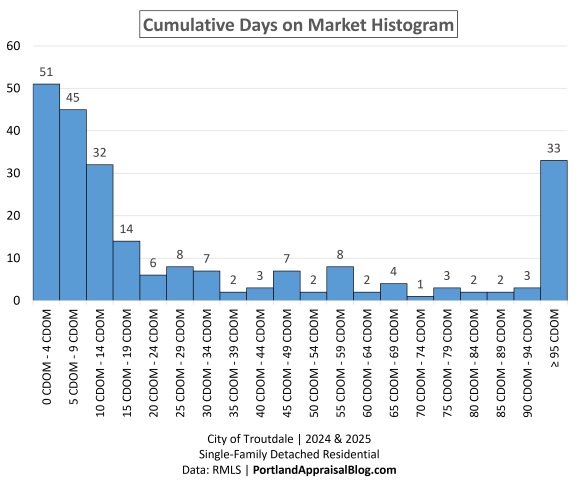
The histogram reveals a strongly front-loaded market. The largest concentrations of sales occurred during the first three CDOM ranges, with 51 homes selling within 4 days, 45 selling between 5 and 9 days, and 32 selling between 10 and 14 days.
After the first two weeks, sales activity declined sharply and remained relatively modest across most remaining ranges. While a number of properties stayed on the market substantially longer, the overall distribution demonstrates that buyer activity was heavily concentrated during the earliest marketing periods.
The final category combines all sales that had 95 cumulative days on market or more. Rather than representing a separate cluster of activity, this category contains a long right tail of properties extending to a maximum of 417 CDOM.
The table below summarizes cumulative marketing time and includes the number of sales as well as average close price, home size, construction era, average CDOM, and the number affordable.
| CDOM Range | Sales | Avg Close Price | Avg Total SF | Avg Year Built | Avg CDOM | # Afford. |
|---|---|---|---|---|---|---|
| 0 – 4 CDOM | 51 | $487,926 | 1,569 | 1988 | 3.12 | 12 |
| 5 – 9 CDOM | 45 | $502,898 | 1,730 | 1986 | 6.42 | 8 |
| 10 – 14 CDOM | 32 | $495,398 | 1,804 | 1985 | 12.25 | 9 |
| 15 – 19 CDOM | 14 | $490,843 | 1,611 | 1990 | 16.50 | 2 |
| 20 – 24 CDOM | 6 | $466,908 | 1,503 | 1991 | 22.33 | 3 |
| 25 – 29 CDOM | 8 | $503,238 | 1,714 | 1982 | 27.00 | 2 |
| 30 – 34 CDOM | 7 | $492,569 | 1,740 | 1993 | 31.00 | 2 |
| 35 – 39 CDOM | 2 | $450,000 | 1,480 | 1982 | 36.00 | 2 |
| 40 – 44 CDOM | 3 | $503,000 | 1,821 | 1985 | 41.67 | 0 |
| 45 – 49 CDOM | 7 | $494,271 | 1,767 | 1993 | 46.57 | 2 |
| 50 – 54 CDOM | 2 | $574,000 | 2,396 | 1989 | 52.50 | 0 |
| 55 – 59 CDOM | 8 | $514,100 | 1,899 | 1995 | 57.25 | 1 |
| 60 – 64 CDOM | 2 | $415,475 | 1,357 | 1991 | 64.00 | 2 |
| 65 – 69 CDOM | 4 | $540,500 | 1,950 | 1991 | 66.75 | 0 |
| 70 – 74 CDOM | 1 | $688,000 | 2,351 | 2020 | 72.00 | 0 |
| 75 – 79 CDOM | 3 | $568,000 | 2,035 | 1999 | 75.67 | 0 |
| 80 – 84 CDOM | 2 | $504,450 | 1,955 | 2002 | 82.00 | 0 |
| 85 – 89 CDOM | 2 | $477,000 | 1,412 | 1991 | 87.50 | 1 |
| 90 – 94 CDOM | 3 | $538,167 | 1,922 | 1994 | 92.00 | 0 |
| ≥ 95 CDOM | 33 | $530,892 | 1,895 | 1990 | 167.88 | 4 |
| Total/ Avg | 235 | $502,664 | 1,735 | 1989 | 40.74 | 50 |
Single-Family Detached Residential | 2024 & 2025
Data: RMLS | PortlandAppraisalBlog.com
Note: The Total/Avg row reports total sales and total affordable homes. All other columns represent averages for the study period.
How affordability is defined: The Portland Appraisal Blog Affordability Index (PABAI) was used to evaluate affordability during the study period. PABAI calculates the income needed to buy each home using its actual reported price, taxes, HOA dues, and an insurance estimate, financed at the Freddie Mac 30-year rate in effect at the time of sale. A home is considered affordable if the required income does not exceed the HUD median family income for the Portland-Vancouver-Hillsboro MSA in effect at the time of sale.
The table reinforces the pattern shown in the histogram. More than half of all detached-home sales (54.47%) sold within 14 cumulative days on market, while 60.43% sold within 19 days. By contrast, 33 sales, or 14.04% of the market, required 95 or more cumulative days on market.
Affordable homes also tended to sell relatively quickly. A total of 29 of the 50 homes classified as affordable under PABAI sold within 14 cumulative days on market, representing 58% of all affordable-home sales during the study period.
The scatter plot below illustrates the relationship between cumulative days on market and sale-price-to-original-list-price (SP/OLP) ratios.
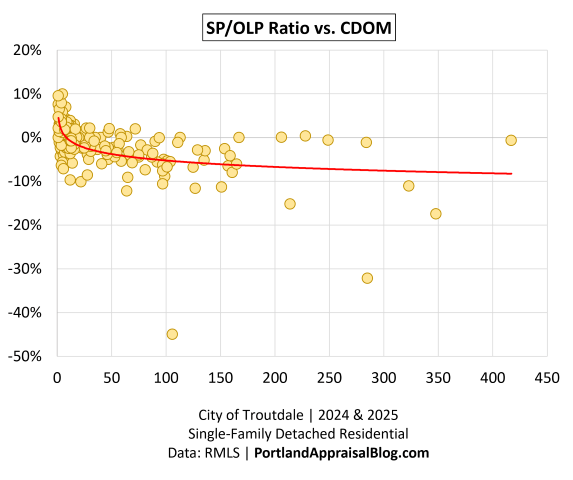
Investigation of several homes requiring more than 95 cumulative days on market revealed a recurring pattern of delayed or repeated price reductions before sale. While the properties themselves varied, many ultimately went pending only after sellers adjusted to market feedback.
Although several sellers ultimately achieved prices near their original asking prices after extended marketing periods, the broader pattern suggests increasing pricing pressure as marketing times lengthened. Homes attracting buyers quickly were generally more likely to achieve stronger SP/OLP outcomes, while longer-marketing properties were more frequently associated with discounts from original asking prices.
Extended marketing periods do not necessarily indicate an undesirable property. However, prolonged exposure often involves additional carrying costs, ongoing maintenance obligations, and opportunity costs. As a result, remaining on the market for many months did not necessarily translate into superior overall outcomes, even when a seller eventually achieved a favorable sale price.
More than half of Troutdale’s detached-home sales went pending within 14 cumulative days on market during 2024–2025, while the median marketing time was approximately two weeks. Investigation of properties with substantially longer marketing periods often revealed one or more price adjustments before sale.
Related Studies
About PAB Insights
PAB Insights is a Portland Appraisal Blog (PAB) series providing concise, data-driven answers to individual housing-market questions using transaction-level research, local market knowledge, and proprietary models, such as the Portland Appraisal Blog Affordability Index (PABAI).
Sources & Further Reading
All data presented in this PAB Insight is sourced directly from RMLS and has been subjected to a rigorous cleaning and validation process to ensure reliability for detached single-family residential analysis in the six-county Portland Region. The trends, comparisons, and commentary are the result of original appraisal expertise and independent analysis—not aggregated from secondary sources or news summaries.
- RMLS Data Challenges: Portland Appraisal Blog
- The Portland Region – Six-County Market Area Overview: Portland Appraisal Blog
- Portland Affordability Index – PABAI: A Realistic Housing Qualification Metric for the Portland Region: Portland Appraisal Blog
- HUD Portland-Vancouver-Hillsboro, OR-WA MSA: Median Family Income
- City of Troutdale Housing Market Snapshot – 2025: Portland Appraisal Blog
- PAB Insights: What Could Different Household Incomes Buy Among Troutdale’s Affordable Homes?: Portland Appraisal Blog
- PAB Insights: What Income Was Required to Buy a Home in Troutdale (2024-2025)?: Portland Appraisal Blog
- PAB Insights: Which Home Sizes Sold Most Often in Troutdale (2024-2025)?: Portland Appraisal Blog
- PAB Insights: When Were Troutdale’s Homes Built (2024-2025)?: Portland Appraisal Blog
- PAB Insights: What Lot Sizes Defined the Troutdale Market (2024-2025)?: Portland Appraisal Blog
- PAB Insights: Which Bedroom Counts Dominated the Troutdale Market (2024-2025)?: Portland Appraisal Blog
- PAB Insights: Which Bathroom Configurations Sold Most Often in Troutdale (2024-2025)?: Portland Appraisal Blog
- PAB Insights: How Did Buyers Finance Homes in Troutdale (2024-2025)?: Portland Appraisal Blog
- PAB Insights: When Did Homes Sell in Troutdale (2024-2025)?: Portland Appraisal Blog

Coda
Thanks for reading—I hope you found a useful insight or an unexpected nugget along the way. If you enjoyed the post, please consider subscribing for future updates.
Are you an agent in Portland who wonders why appraisers always do “x”?
A homeowner with questions about appraiser methodology?
If so, feel free to reach out—I enjoy connecting with market participants across Portland and the surrounding counties, and am always happy to help where I can.
And if you’re in need of appraisal services in Troutdale or anywhere in the Portland Region, we’d be glad to assist.
About the Author — Abdur Abdul‑Malik, SRA, ASA
Abdur Abdul‑Malik is the founder, author, and publisher of the Portland Appraisal Blog, where he produces original regional and neighborhood‑level housing analytics for the Portland Region. He is a certified residential appraiser serving Oregon and Washington, drawing on RMLS transaction data, public records, and custom segmentation models he has built.
He developed the Portland Appraisal Blog Affordability Index (PABAI), a payment‑based affordability metric built from actual RMLS sales. PABAI incorporates weekly updates based on the prevailing 30‑year fixed mortgage rate, providing a locally grounded measure of housing affordability across the region.
Learn more → PABAI explainer • mortgage rate series • full author bio


