
Photo: Abdur Abdul-Malik, Portland Appraisal Blog
Sales Price to Original List Price (SP/OLP) measures the relationship between a home’s final sales price and its original asking price. Ratios above 100% indicate a home sold for more than its original list price, while ratios below 100% indicate it sold for less.
SP/OLP can provide insight into pricing effectiveness and market response. While some homes generate strong buyer competition and sell above asking price, others require price adjustments before ultimately finding a buyer.
The table below compares SP/OLP performance for detached-home sales occurring in Troutdale during 2024 and 2025.
| Category | 2024 | 2025 | Change |
|---|---|---|---|
| Average SP/OLP | 99.27% | 98.09% | -1.18 pts |
| Median SP/OLP | 100.00% | 100.00% | No Change |
| Highest SP/OLP | 109.93% | 106.47% | -3.46 pts |
| Lowest SP/OLP | 82.55% | 55.00% | -27.55 pts |
| Total # of Sales | 112 | 123 | +11 homes |
Single-Family Detached Residential | 2024 vs. 2025
Data: RMLS | PortlandAppraisalBlog.com
The typical Troutdale home sold at exactly 100% of its original asking price during both years. Average SP/OLP declined modestly from 99.27% in 2024 to 98.09% in 2025, a change that was directionally consistent with several other Troutdale market indicators, including modestly lower sales price and slightly longer marketing times during 2025.
The lowest SP/OLP sale (55%) involved an atypical mixed-use riverfront property marketed primarily for its land and development potential rather than its modest residential improvements.
The table below summarizes detached-home sales relative to original asking price.
| Description | Definition | Count | % of Total Sales |
|---|---|---|---|
| Sold at OLP | SP = OLP | 35 | 14.89% |
| Sold Above OLP | SP > OLP | 86 | 36.60% |
| Sold Below OLP | SP < OLP | 114 | 48.51% |
| Sold at or above OLP | SP ≥ OLP | 121 | 51.49% |
Single-Family Detached Residential | 2024 & 2025
Data: RMLS | PortlandAppraisalBlog.com
The results were remarkably balanced. A total of 121 sales, or 51.49% of the market, sold at or above original asking price, while 114 sales, or 48.51%, sold below original asking price. Additionally, 35 homes sold at exactly their original asking prices.
Taken together, these figures suggest that Troutdale sellers were generally successful at achieving their original list price. However, the narrow margin between homes selling above and below original asking price also indicates that pricing accuracy remained important. A market where 51.49% of sales achieved or exceeded original asking price and 48.51% sold below it offered relatively little margin for pricing errors.
The table below summarizes detached-home sales by SP/OLP range and includes sales volume, average sales price, home size, construction era, cumulative days on market (CDOM), and average SP/OLP for each category.
| SP/OLP Range | Sales | Avg Close Price | Avg Total SF | Avg Year Built | Avg CDOM | Avg SP/OLP |
|---|---|---|---|---|---|---|
| < 82.0% | 2 | $680,000 | 1,597 | 1944 | 196 | 61.40% |
| 82.0% – 83.9% | 1 | $705,000 | 2,778 | 1990 | 348 | 82.55% |
| 84.0% – 85.9% | 1 | $585,000 | 1,910 | 1971 | 214 | 84.79% |
| 86.0% – 87.9% | 1 | $395,000 | 1,254 | 1992 | 64 | 87.80% |
| 88.0% – 89.9% | 5 | $494,480 | 2,043 | 1997 | 144 | 89.03% |
| 90.0% – 91.9% | 4 | $449,750 | 1,626 | 1959 | 51 | 90.91% |
| 92.0% – 93.9% | 11 | $474,582 | 1,647 | 1992 | 94 | 93.18% |
| 94.0% – 95.9% | 21 | $546,052 | 1,929 | 1992 | 68 | 94.98% |
| 96.0% – 97.9% | 34 | $493,800 | 1,749 | 1991 | 41 | 97.09% |
| 98.0% – 99.9% | 34 | $517,326 | 1,872 | 1992 | 51 | 98.74% |
| 100.0% – 101.9% | 75 | $503,968 | 1,724 | 1989 | 23 | 100.51% |
| 102.0% – 103.9% | 31 | $468,645 | 1,514 | 1984 | 9 | 102.72% |
| 104.0% – 105.9% | 6 | $484,250 | 1,654 | 1991 | 5 | 104.86% |
| 106.0% – 107.9% | 7 | $513,000 | 1,631 | 1985 | 4 | 106.79% |
| 108.0% – 109.9% | 2 | $460,850 | 1,328 | 1989 | 3 | 109.71% |
| ≥ 110.0% | 0 | — | — | — | — | — |
| Total/ Avg | 235 | $502,664 | 1,735 | 1989 | 40.74 | 98.65% |
Single-Family Detached Residential | 2024 & 2025
Data: RMLS | PortlandAppraisalBlog.com
Most sales occurred within a relatively narrow range around original asking price. A total of 174 sales, or 74.04% of the market, sold between 96.0% and 103.9% of original asking price. The largest cohort consisted of 75 sales occurring between 100.0% and 101.9% of original asking price, representing 31.91% of all detached-home sales.
The table also reveals a strong relationship between SP/OLP outcomes and marketing times. Homes achieving the strongest pricing outcomes generally sold quickly, suggesting their asking prices aligned closely with prevailing market expectations. By contrast, weaker SP/OLP outcomes were increasingly associated with extended marketing periods. Homes selling between 108.0% and 109.9% of original asking price averaged just 3 days on market, while many of the lowest SP/OLP cohorts remained exposed to the market for several months.
As discussed in the previous CDOM study, more than half of Troutdale’s detached-home sales went pending within 14 cumulative days on market. The scatter plot below examines the opposite side of that same question by comparing marketing time and pricing outcomes.
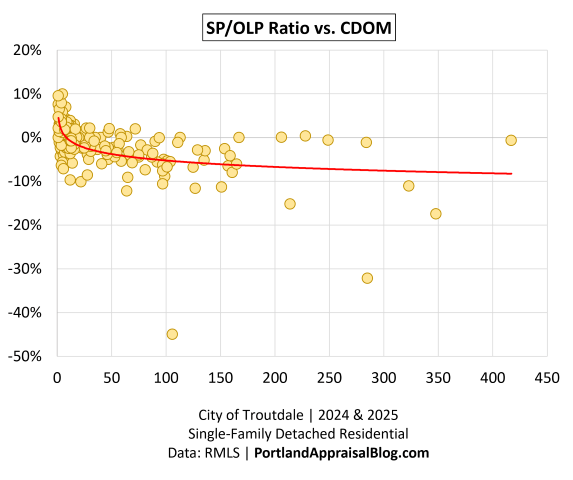
The Troutdale market appears to have been highly responsive to pricing. Homes priced in line with market expectations frequently generated immediate buyer interest and achieved stronger SP/OLP outcomes. By contrast, properties remaining on the market for extended periods rarely improved upon their original pricing expectations. Instead, many ultimately sold at increasing discounts from original asking price, reflecting clear market rejection of the seller’s initial pricing.
The relationship was also asymmetrical. Sellers who priced slightly below what the market was willing to pay sometimes benefited from competitive bidding and modest premiums above asking price. However, the potential downside associated with missing the market was substantially larger than the available upside. The scatter plot shows relatively limited gains above original asking price, while several long-marketing properties ultimately sold at significant discounts.
The typical Troutdale detached home sold at exactly 100% of original asking price during 2024-2025, demonstrating a market that was highly responsive to pricing. Homes aligned with prevailing market expectations generally sold quickly and achieved stronger outcomes, while optimistic pricing strategies often resulted in extended marketing periods and eventual capitulation.
Related Studies
About PAB Insights
PAB Insights is a Portland Appraisal Blog (PAB) series providing concise, data-driven answers to individual housing-market questions using transaction-level research, local market knowledge, and proprietary models, such as the Portland Appraisal Blog Affordability Index (PABAI).
Sources & Further Reading
All data presented in this PAB Insight is sourced directly from RMLS and has been subjected to a rigorous cleaning and validation process to ensure reliability for detached single-family residential analysis in the six-county Portland Region. The trends, comparisons, and commentary are the result of original appraisal expertise and independent analysis—not aggregated from secondary sources or news summaries.
- RMLS Data Challenges: Portland Appraisal Blog
- The Portland Region – Six-County Market Area Overview: Portland Appraisal Blog
- Portland Affordability Index – PABAI: A Realistic Housing Qualification Metric for the Portland Region: Portland Appraisal Blog
- HUD Portland-Vancouver-Hillsboro, OR-WA MSA: Median Family Income
- City of Troutdale Housing Market Snapshot – 2025: Portland Appraisal Blog
- PAB Insights: What Could Different Household Incomes Buy Among Troutdale’s Affordable Homes?: Portland Appraisal Blog
- PAB Insights: What Income Was Required to Buy a Home in Troutdale (2024-2025)?: Portland Appraisal Blog
- PAB Insights: Which Home Sizes Sold Most Often in Troutdale (2024-2025)?: Portland Appraisal Blog
- PAB Insights: When Were Troutdale’s Homes Built (2024-2025)?: Portland Appraisal Blog
- PAB Insights: What Lot Sizes Defined the Troutdale Market (2024-2025)?: Portland Appraisal Blog
- PAB Insights: Which Bedroom Counts Dominated the Troutdale Market (2024-2025)?: Portland Appraisal Blog
- PAB Insights: Which Bathroom Configurations Sold Most Often in Troutdale (2024-2025)?: Portland Appraisal Blog
- PAB Insights: How Did Buyers Finance Homes in Troutdale (2024-2025)?: Portland Appraisal Blog
- PAB Insights: When Did Homes Sell in Troutdale (2024-2025)?: Portland Appraisal Blog
- PAB Insights: How Long Did It Take Homes to Sell in Troutdale (2024-2025)?: Portland Appraisal Blog

Coda
Thanks for reading—I hope you found a useful insight or an unexpected nugget along the way. If you enjoyed the post, please consider subscribing for future updates.
Are you an agent in Portland who wonders why appraisers always do “x”?
A homeowner with questions about appraiser methodology?
If so, feel free to reach out—I enjoy connecting with market participants across Portland and the surrounding counties, and am always happy to help where I can.
And if you’re in need of appraisal services in Troutdale or anywhere in the Portland Region, we’d be glad to assist.
About the Author — Abdur Abdul‑Malik, SRA, ASA
Abdur Abdul‑Malik is the founder, author, and publisher of the Portland Appraisal Blog, where he produces original regional and neighborhood‑level housing analytics for the Portland Region. He is a certified residential appraiser serving Oregon and Washington, drawing on RMLS transaction data, public records, and custom segmentation models he has built.
He developed the Portland Appraisal Blog Affordability Index (PABAI), a payment‑based affordability metric built from actual RMLS sales. PABAI incorporates weekly updates based on the prevailing 30‑year fixed mortgage rate, providing a locally grounded measure of housing affordability across the region.
Learn more → PABAI explainer • mortgage rate series • full author bio


