Detached-home sales in Troutdale were heavily concentrated on modest suburban lots. During 2024-2025, 95.32% of all detached-home sales occurred on lots larger than 0.05 acres but smaller than 0.30 acres, with the largest concentration occurring between 0.150 and 0.174 acres.
Troutdale city seal—“Gateway to the Gorge.” Photo: Abdur Abdul-Malik, Portland Appraisal Blog
Detached-home sales in Troutdale were heavily concentrated on modest suburban lots during 2024 and 2025. While site sizes ranged from 0.06 acres to 3.95 acres, most detached-home sales occurred on lots of approximately 0.15 acres and less than 0.30 acres.
The table below compares key lot-size metrics across both years.
Category
2024
2025
Change
Average Lot Size
0.2160
0.2121
-1.77%
Median Lot Size
0.1800
0.1700
-5.55%
Largest Lot Size
2.3700
3.9500
+1.58 Acres
Smallest Lot Size
0.0600
0.0600
0.00%
Total # of Sales
112
123
+11 homes
City of Troutdale Lot Size Comparisons Single-Family Detached Residential | 2024 vs. 2025 Data: RMLS |PortlandAppraisalBlog.com
Note: Lot sizes are reported by listing agents in RMLS and may be approximate. These figures are best used to identify broad market patterns rather than determine precise site areas.
The typical detached-home lot sold in 2025 was slightly smaller than in 2024. Average lot size declined from 0.2160 acres to 0.2121 acres, while median lot size declined from 0.1800 acres to 0.1700 acres. Converted to approximate square-foot equivalents, average lot sizes were approximately 9,200-9,400 square feet, while median lot sizes ranged from roughly 7,400-7,800 square feet.
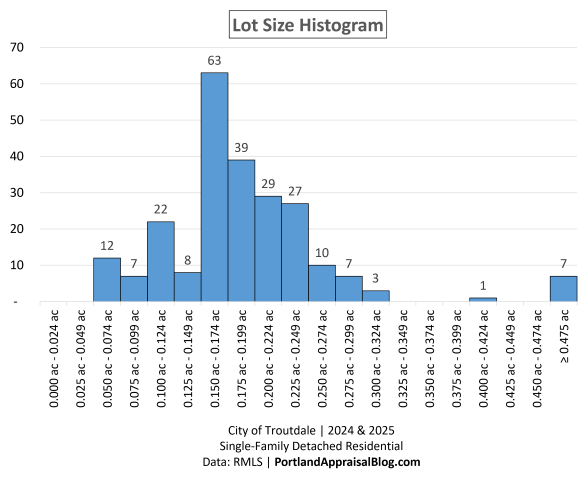
The histogram below shows where detached-home sales were concentrated by lot size during 2024 and 2025.
Lot sizes were highly concentrated within a relatively narrow range. The largest concentration occurred between 0.150 and 0.174 acres (63 sales), followed by 0.175-0.199 acres (39 sales), 0.200-0.224 acres (29 sales), and 0.225-0.249 acres (27 sales). Together, these four adjacent ranges accounted for 158 of 235 sales.
Relatively few detached-home sales occurred on large lots. Sales activity declined steadily beyond 0.25 acres, while acreage properties represented only a small portion of the market.
The table below summarizes each lot-size band and includes the number of sales as well as average sales price, home size, construction era, and lot size.
Lot Size Range
Sales
Avg Close Price
Avg Total SF
Avg Year Built
Avg Acres
0.000 ac – 0.024 ac
0
—
—
—
—
0.025 ac – 0.049 ac
0
—
—
—
—
0.050 ac – 0.074 ac
12
$457,496
1,748
2006
0.0642
0.075 ac – 0.099 ac
7
$479,000
1,862
2009
0.0871
0.100 ac – 0.124 ac
22
$484,859
1,748
1996
0.1150
0.125 ac – 0.149 ac
8
$478,300
1,421
1994
0.1322
0.150 ac – 0.174 ac
63
$500,154
1,698
1990
0.1630
0.175 ac – 0.199 ac
39
$485,415
1,621
1984
0.1838
0.200 ac – 0.224 ac
29
$517,917
1,757
1988
0.2110
0.225 ac – 0.249 ac
27
$507,354
1,793
1984
0.2333
0.250 ac – 0.274 ac
10
$507,694
1,925
1982
0.2560
0.275 ac – 0.299 ac
7
$524,257
1,752
1987
0.2853
0.300 ac – 0.324 ac
3
$502,667
1,432
1977
0.3167
0.325 ac – 0.349 ac
0
—
—
—
—
0.350 ac – 0.374 ac
0
—
—
—
—
0.375 ac – 0.399 ac
0
—
—
—
—
0.400 ac – 0.424 ac
1
$447,000
1,078
1988
0.4200
0.425 ac – 0.449 ac
0
—
—
—
—
0.450 ac – 0.474 ac
0
—
—
—
—
≥ 0.475 ac
7
$704,143
2,502
1960
1.3614
Total/Average
235
$502,664
1,735
1989
0.2140
City of Troutdale Home Sales by Lot-Size Band Single-Family Detached Residential | 2024 & 2025 Data: RMLS |PortlandAppraisalBlog.com
The market was highly concentrated. Lots between 0.050 and 0.299 acres accounted for 224 of 235 sales, or 95.32% of all detached-home transactions during the study period.
Sale prices generally increased as lot sizes increased, although transaction counts became sparse beyond approximately 0.30 acres. The largest-lot cohort averaged more than $700,000, 2,502 square feet, and 1.36 acres, but included only seven sales.
Smaller lots also tended to be associated with newer development. The smallest detached-home lots in the study averaged just 0.064 acres and were built around 2006, while larger-lot homes generally reflected older construction periods. This pattern aligns with a common subdivision-development trend in which newer homes are built on increasingly smaller sites.
Troutdale’s detached-home market was overwhelmingly concentrated on lots between approximately 0.05 and less than 0.30 acres.
PAB Insights is a Portland Appraisal Blog (PAB) series providing concise, data-driven answers to individual housing-market questions using transaction-level research, local market knowledge, and proprietary models, such as the Portland Appraisal Blog Affordability Index (PABAI).
Sources & Further Reading
All data presented in this PAB Insight is sourced directly from RMLS and has been subjected to our rigorous cleaning and validation process to ensure reliability for detached single-family residential analysis in the six-county Portland Region. The trends, comparisons, and commentary are the result of original appraisal expertise and independent analysis—not aggregated from secondary sources or news summaries.
Thanks for reading—I hope you found a useful insight or an unexpected nugget along the way. If you enjoyed the post, please consider subscribing for future updates.
Are you an agent in Portland who wonders why appraisers always do “x”?
A homeowner with questions about appraiser methodology?
If so, feel free to reach out—I enjoy connecting with market participants across Portland and the surrounding counties, and am always happy to help where I can.
And if you’re in need of appraisal services in Troutdale or anywhere in the Portland Region, we’d be glad to assist.
About the Author — Abdur Abdul‑Malik, SRA, ASA
Abdur Abdul‑Malik is the founder, author, and publisher of the Portland Appraisal Blog, where he produces original regional and neighborhood‑level housing analytics for the Portland Region. He is a certified residential appraiser serving Oregon and Washington, drawing on RMLS transaction data, public records, and custom segmentation models he has built.
He developed the Portland Appraisal Blog Affordability Index (PABAI), a payment‑based affordability metric built from actual RMLS sales. PABAI incorporates weekly updates based on the prevailing 30‑year fixed mortgage rate, providing a locally grounded measure of housing affordability across the region.
Detached-home sales in Troutdale were heavily concentrated among homes built from the 1970s onward. During 2024-2025, 94.47% of all detached-home sales involved homes built between 1970 and 2009, with the largest concentrations occurring among homes built in the late 1970s and early 1990s.
Troutdale arch sign. Photo: Abdur Abdul-Malik, Portland Appraisal Blog
Detached-home sales in Troutdale spanned construction dates from the late 1800s to the 2020s during 2024 and 2025. Although Troutdale was incorporated in 1907, the overwhelming majority of detached homes sold during the study period were built from the 1970s onward.
The table below compares key year-built metrics across both years.
Category
2024
2025
Change
Average Year Built
1990
1988
-2 Years
Median Year Built
1992
1990
-2 Years
Oldest Home
1944
1893
-51 Years
Newest Home
2022
2020
-2 Years
Total # of Sales
112
123
+11 homes
City of Troutdale Year Built Comparisons Single-Family Detached Residential | 2024 vs. 2025 Data: RMLS |PortlandAppraisalBlog.com
The typical detached home sold in 2025 was slightly older than in 2024. Average year built declined from 1990 to 1988, while median year built declined from 1992 to 1990. Across the two-year study period, the oldest home sold was built in 1893, while the newest was built in 2022.
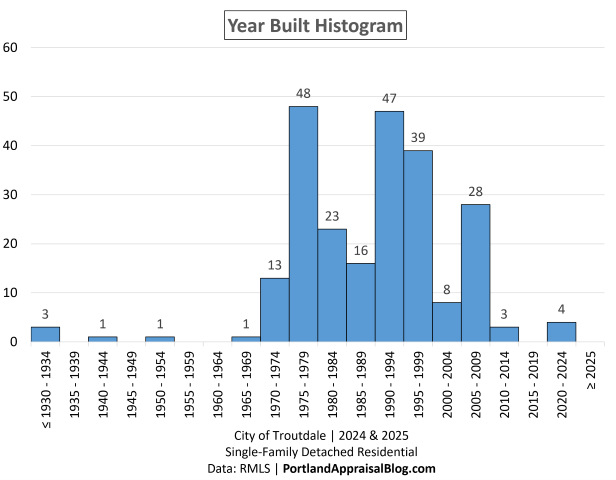
The chart below shows where detached-home sales were concentrated by construction era during 2024 and 2025.
Detached-home sales involving homes built before 1970 were relatively uncommon. The number of sales increased sharply beginning in the 1970s and remained elevated through much of the late-20th-century and early-21st-century housing stock.
The largest concentrations occurred among homes built in 1975-1979 (48 sales), 1990-1994 (47 sales), 1995-1999 (39 sales), and 2005-2009 (28 sales). Rather than reflecting steady construction over time, the distribution suggests Troutdale’s detached-housing stock developed through a series of major building cycles.
Construction activity was noticeably lighter during the 2010s, and the newest home sold during the study period was built in 2022.
The table below summarizes each construction-era band and includes average sales price, home size, year built, and lot size.
Year Built Range
Sales
Avg Close Price
Avg Total SF
Avg Year Built
Avg Acres
≤ 1934
3
$678,333
2,694
1902
1.523
1935 – 1939
0
—
—
—
—
1940 – 1944
1
$396,060
1,228
1944
0.250
1945 – 1949
0
—
—
—
—
1950 – 1954
1
$420,000
1,226
1952
0.180
1955 – 1959
0
—
—
—
—
1960 – 1964
0
—
—
—
—
1965 – 1969
1
$480,000
1,112
1969
0.190
1970 – 1974
13
$506,077
1,711
1973
0.405
1975 – 1979
48
$479,452
1,615
1977
0.203
1980 – 1984
23
$455,963
1,434
1982
0.213
1985 – 1989
16
$491,494
1,539
1988
0.282
1990 – 1994
47
$509,252
1,693
1993
0.189
1995 – 1999
39
$515,427
1,841
1996
0.167
2000 – 2004
8
$564,500
2,049
2002
0.170
2005 – 2009
28
$509,065
2,021
2006
0.103
2010 – 2014
3
$593,300
1,873
2013
0.193
2015 – 2019
0
—
—
—
—
2020 – 2024
4
$566,250
2,202
2021
0.110
≥ 2025
0
—
—
—
—
Total/Avg
235
$502,664
1,735
1989
0.214
City of Troutdale Home Sales by Year-Built Band Single-Family Detached Residential | 2024 & 2025 Data: RMLS |PortlandAppraisalBlog.com
The market was highly concentrated. Homes built between 1970 and 2009 accounted for 222 of 235 sales, or 94.47% of all detached-home transactions during the study period.
Within these construction eras, average home sizes generally increased over time. Homes built during the 1970s averaged approximately 1,600-1,700 square feet, while homes built after 2000 commonly exceeded 2,000 square feet.
Lot sizes generally moved in the opposite direction. As newer subdivisions were developed, homes tended to become larger while the average site size became smaller, a common pattern as builders sought to maximize the number of homes within a subdivision.
Troutdale’s sales over the study period with an average year built of 1989 reflect the center of several major development waves rather than a single dominant construction period. The strongest concentrations occurred in the late 1970s and again from the early 1990s through the 2000s.
Troutdale’s detached-home market was overwhelmingly concentrated in homes built between 1970 and 2009.
PAB Insights is a Portland Appraisal Blog (PAB) series providing concise, data-driven answers to individual housing-market questions using transaction-level research, local market knowledge, and proprietary models, such as the Portland Appraisal Blog Affordability Index (PABAI).
Sources & Further Reading
All data presented in this PAB Insight is sourced directly from RMLS and has been subjected to our rigorous cleaning and validation process to ensure reliability for detached single-family residential analysis in the six-county Portland Region. The trends, comparisons, and commentary are the result of original appraisal expertise and independent analysis—not aggregated from secondary sources or news summaries.
PAB Insights: What Could Different Household Incomes Buy Among Troutdale’s Affordable Homes?: Portland Appraisal Blog
PAB Insights: What Income Was Required to Buy a Home in Troutdale (2024-2025)?: Portland Appraisal Blog
PAB Insights: Which Home Sizes Sold Most Often in Troutdale (2024-2025)?: Portland Appraisal Blog
Coda
Thanks for reading—I hope you found a useful insight or an unexpected nugget along the way. If you enjoyed the post, please consider subscribing for future updates.
Are you an agent in Portland who wonders why appraisers always do “x”?
A homeowner with questions about appraiser methodology?
If so, feel free to reach out—I enjoy connecting with market participants across Portland and the surrounding counties, and am always happy to help where I can.
And if you’re in need of appraisal services in Troutdale or anywhere in the Portland Region, we’d be glad to assist.
About the Author — Abdur Abdul‑Malik, SRA, ASA
Abdur Abdul‑Malik is the founder, author, and publisher of the Portland Appraisal Blog, where he produces original regional and neighborhood‑level housing analytics for the Portland Region. He is a certified residential appraiser serving Oregon and Washington, drawing on RMLS transaction data, public records, and custom segmentation models he has built.
He developed the Portland Appraisal Blog Affordability Index (PABAI), a payment‑based affordability metric built from actual RMLS sales. PABAI incorporates weekly updates based on the prevailing 30‑year fixed mortgage rate, providing a locally grounded measure of housing affordability across the region.
Detached-home sales in Troutdale were highly concentrated, with 79.57% of all sales occurring between 1,200 SF and 2,099 SF during 2024-2025. Average home size declined by 62 SF, while median home size fell by 113 SF.
Troutdale city seal—“Gateway to the Gorge.” Photo: Abdur Abdul-Malik, Portland Appraisal Blog
Detached-home sales in Troutdale spanned a wide range of sizes during 2024 and 2025. While sales ranged from under 1,000 square feet to more than 5,000 square feet, most buyers purchased homes within a much narrower range, with homes 1,400-1,499 SF the most dominant bracket.
The table below compares key home-size metrics across both years.
Category
2024
2025
Change
Average Total SF
1,768
1,706
-62 SF
Median Total SF
1,727
1,614
-113 SF
Smallest Sale
1,089
980
-109 SF
Largest Sale
2,992
5,100
+2,108 SF
Total # of Sales
112
123
+11 homes
City of Troutdale Total Square Footage Comparisons Single-Family Detached Residential | 2024 vs. 2025 Data: RMLS |PortlandAppraisalBlog.com
Smaller detached homes sold on average in 2025 than in 2024. Average home size declined from 1,768 SF to 1,706 SF, while median size fell from 1,727 SF to 1,614 SF. At the same time, the largest detached-home sale increased from 2,992 SF to 5,100 SF, illustrating the presence of a small upper-end market.
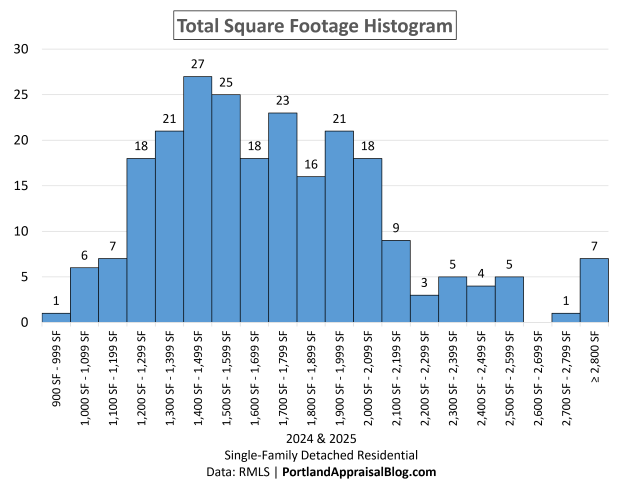
The chart below shows where detached-home sales were concentrated by total square footage during 2024 and 2025.
Detached homes smaller than 1,200 SF saw relatively few transactions. The number of sales increased noticeably beginning in the 1,200-1,299 SF & 1,300-1,399 ranges and remained strong through much of the market’s mid-sized ranges, reaching a peak in the 1,400-1,499 SF range, which recorded 27 sales. Other notable concentrations occurred in the 1,500-1,599 SF range (25 sales), the 1,700-1,799 SF range (23 sales), and the 1,900-1,999 SF range (21 sales).
The final size band (≥2,800 SF) serves as a catch-all category for the market’s thin upper tail. Larger detached homes continued to sell throughout the study period, but transaction volume declined substantially beyond roughly 2,100 SF.
The table below summarizes each size band and includes average sales price, average living area, average year built, and average lot size.
SF Range
Sales
Avg Close Price
Avg Total SF
Avg Year Built
Avg Acres
900 SF – 999 SF
1
$422,500
980
1979
0.130
1,000 SF – 1,099 SF
6
$424,167
1,074
1981
0.228
1,100 SF – 1,199 SF
7
$451,286
1,146
1979
0.166
1,200 SF – 1,299 SF
18
$457,244
1,251
1980
0.181
1,300 SF – 1,399 SF
21
$467,995
1,351
1984
0.198
1,400 SF – 1,499 SF
27
$481,009
1,443
1986
0.319
1,500 SF – 1,599 SF
25
$473,312
1,555
1989
0.172
1,600 SF – 1,699 SF
18
$485,436
1,641
1990
0.181
1,700 SF – 1,799 SF
23
$479,465
1,752
1988
0.177
1,800 SF – 1,899 SF
16
$516,053
1,851
1991
0.235
1,900 SF – 1,999 SF
21
$530,940
1,947
1994
0.188
2,000 SF – 2,099 SF
18
$530,242
2,042
1994
0.188
2,100 SF – 2,199 SF
9
$536,222
2,156
1997
0.143
2,200 SF – 2,299 SF
3
$559,300
2,240
1985
0.233
2,300 SF – 2,399 SF
5
$582,600
2,333
2002
0.154
2,400 SF – 2,499 SF
4
$568,750
2,434
2001
0.160
2,500 SF – 2,599 SF
5
$560,780
2,541
1997
0.164
2,600 SF – 2,699 SF
0
—
—
—
—
2,700 SF – 2,799 SF
1
$705,000
2,778
1990
0.620
≥ 2,800 SF
7
$743,412
3,367
1986
0.580
Total/Avg
235
$502,664
1,735
1989
0.214
City of Troutdale Home Sales by Size Band Single-Family Detached Residential | 2024 & 2025 Data: RMLS |PortlandAppraisalBlog.com
The market was highly concentrated. Homes between 1,200 SF and 2,099 SF accounted for 187 of 235 sales, or 79.57% of all detached-home transactions during the study period.
Within this range, average sales price increased from approximately $457,000 to a little over $530,000 as home size increased. Most homes in the market’s most active size ranges were built during the 1980s and 1990s, reflecting the era that helped define much of Troutdale’s detached-housing stock.
Despite substantial differences in living area, average lot sizes remained relatively consistent throughout much of the market’s core size ranges.
Troutdale’s detached-home market was highly concentrated between 1,200 SF and 2,099 SF.
PAB Insights is a Portland Appraisal Blog (PAB) series providing concise, data-driven answers to individual housing-market questions using transaction-level research, local market knowledge, and proprietary models, such as the Portland Appraisal Blog Affordability Index (PABAI).
Sources & Further Reading
All data presented in this PAB Insight is sourced directly from RMLS and has been subjected to our rigorous cleaning and validation process to ensure reliability for detached single-family residential analysis in the six-county Portland Region. The trends, comparisons, and commentary are the result of original appraisal expertise and independent analysis—not aggregated from secondary sources or news summaries.
PAB Insights: What Could Different Household Incomes Buy Among Troutdale’s Affordable Homes?: Portland Appraisal Blog
PAB Insights: What Income Was Required to Buy a Home in Troutdale (2024-2025)?: Portland Appraisal Blog
Coda
Thanks for reading—I hope you found a useful insight or an unexpected nugget along the way. If you enjoyed the post, please consider subscribing for future updates.
Are you an agent in Portland who wonders why appraisers always do “x”?
A homeowner with questions about appraiser methodology?
If so, feel free to reach out—I enjoy connecting with market participants across Portland and the surrounding counties, and am always happy to help where I can.
And if you’re in need of appraisal services in Troutdale or anywhere in the Portland Region, we’d be glad to assist.
About the Author — Abdur Abdul‑Malik, SRA, ASA
Abdur Abdul‑Malik is the founder, author, and publisher of the Portland Appraisal Blog, where he produces original regional and neighborhood‑level housing analytics for the Portland Region. He is a certified residential appraiser serving Oregon and Washington, drawing on RMLS transaction data, public records, and custom segmentation models he has built.
He developed the Portland Appraisal Blog Affordability Index (PABAI), a payment‑based affordability metric built from actual RMLS sales. PABAI incorporates weekly updates based on the prevailing 30‑year fixed mortgage rate, providing a locally grounded measure of housing affordability across the region.
Average required income for Troutdale detached homes declined from $137,475 in 2024 to $131,873 in 2025. While required incomes fell only modestly, affordable detached-home sales increased dramatically as many homes sat near the affordability threshold. Rates tipped the scale.
Troutdale arch sign. Photo: Abdur Abdul-Malik, Portland Appraisal Blog
The amount of income required to purchase a detached home in Troutdale declined modestly between 2024 and 2025. While average and median required incomes fell by roughly 4%, the share of detached-home sales classified as affordable under the Portland Appraisal Blog Affordability Index (PABAI) increased dramatically.
The table below compares key required-income metrics across both years.
Metric
2024
2025
Change
Avg Required Income
$137,475
$131,873
-4.07%
Median Required Income
$134,148
$128,256
-4.39%
Affordable Sales
7
43
+36 homes
% Affordable
6.25%
34.96%
+28.71 pts
Detached-home affordability overview, Troutdale city limits. Affordable homes determined using PABAI. Single-Family Detached Residential | 2024 vs. 2025 Data: RMLS |PortlandAppraisalBlog.com
How “affordable” is defined: PABAI calculates the income needed to buy each home using its actual reported price, taxes, HOA dues, and insurance estimate, financed at the Freddie Mac 30-year rate in effect at the time of sale. A home counts as affordable if that required income is at or below the HUD median family income for the Portland-Vancouver-Hillsboro MSA in effect at the time.
At first glance, the affordability gains appear out of proportion to the decline in required incomes. Average required income fell just 4.07%, yet affordable detached-home sales increased from 7 to 43.
Part of the explanation can be found in how ownership costs were allocated.
Category
2024
2025
Change
Avg Principal & Interest Share
82.47%
82.05%
-0.42 pts
Avg Taxes Share
12.01%
12.17%
+0.16 pts
Avg HOA Share
0.21%
0.41%
+0.20 pts
Avg Insurance Share
5.31%
5.37%
+0.06 pts
Average share of housing payments attributable to principal & interest, property taxes, HOA dues, and insurance as modeled under the PABAI framework. Shares are averaged across all detached sales; sales without HOA dues count as 0% HOA. Single-Family Detached Residential | 2024 vs. 2025 Data: RMLS |PortlandAppraisalBlog.com
Mortgage principal and interest accounted for roughly 82% of the typical modeled housing payment in both years. While the P&I share declined by only 0.42 percentage points between 2024 and 2025, that small change proved meaningful because detached-home sales were heavily concentrated near the affordability threshold. In a market sitting at the boundary of affordability, even modest improvements in financing costs can move a significant number of homes from unaffordable to affordable.
Taxes and insurance remained relatively stable. HOA dues represented a larger share of modeled ownership costs in 2025, although part of that increase can be attributed to a greater number of HOA-governed homes selling in 2025 (35) than in 2024 (24).
The table above illustrates why mortgage rates matter. When more than four-fifths of a typical housing payment is attributable to financing costs, even modest improvements in mortgage financing conditions can materially affect affordability.
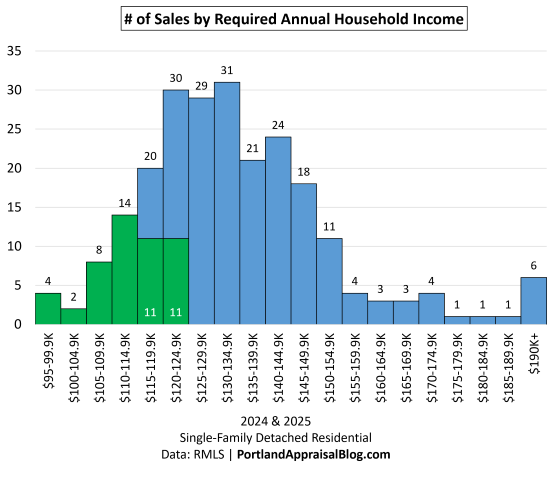
The chart below combines 2024 and 2025 detached-home sales to show where required incomes were concentrated.
Most detached-home sales required between roughly $115,000 and $149,999 of annual household income. The green bars represent homes that met the PABAI affordability standard in effect at the time of sale.
The first four income bands were naturally affordable because they generally fell below the applicable HUD median family income thresholds throughout the study period. Additional affordable sales appeared in the $115,000-$119,999 and $120,000-$124,999 income bands, reflecting changes in affordability thresholds and financing conditions over time.
The table below summarizes the distribution and includes the percentage of sales in each band, making it easier to evaluate where the market was concentrated.
Required Income
# of Sales
% of Sales
# Affordable
$95-99.9K
4
1.70%
4
$100-104.9K
2
0.85%
2
$105-109.9K
8
3.40%
8
$110-114.9K
14
5.96%
14
$115-119.9K
20
8.51%
11
$120-124.9K
30
12.77%
11
$125-129.9K
29
12.34%
0
$130-134.9K
31
13.19%
0
$135-139.9K
21
8.94%
0
$140-144.9K
24
10.21%
0
$145-149.9K
18
7.66%
0
$150-154.9K
11
4.68%
0
$155-159.9K
4
1.70%
0
$160-164.9K
3
1.28%
0
$165-169.9K
3
1.28%
0
$170-174.9K
4
1.70%
0
$175-179.9K
1
0.43%
0
$180-184.9K
1
0.43%
0
$185-189.9K
1
0.43%
0
$190K+
6
2.55%
0
Sum
235
100.00%
50
Detached-home sales by required income band (2024-2025), including the share of sales and number classified as affordable under PABAI. Lower bound inclusive. Single-Family Detached Residential | 2024 & 2025 Data: RMLS |PortlandAppraisalBlog.com
Nearly three-quarters (73.62%) of all detached-home sales required between $115,000 to $149,999 of annual household income. The single largest income band was $130,000 to $134,999, accounting for 13.19% of all sales.
The market was not dominated by homes requiring substantially more income than the affordability threshold. Instead, many sales clustered immediately around it. As mortgage rates modestly improved during much of the 2025 selling season, required incomes fell enough to bring more homes into the affordability zone. Affordability was also buoyed by a rising HUD median family income for the Portland-Vancouver-Hillsboro MSA: $114,400 in 2024, rising to $124,100 by April 2025 and holding there through year-end.
PAB Insights is a Portland Appraisal Blog (PAB) series providing concise, data-driven answers to individual housing-market questions using transaction-level research, local market knowledge, and proprietary models, such as the Portland Appraisal Blog Affordability Index (PABAI).
Sources & Further Reading
All data presented in this PAB Insight is sourced directly from RMLS and has been subjected to our rigorous cleaning and validation process to ensure reliability for detached single-family residential analysis in the six-county Portland Region. The trends, comparisons, and commentary are the result of original appraisal expertise and independent analysis—not aggregated from secondary sources or news summaries.
PAB Insights: What Could Different Household Incomes Buy Among Troutdale’s Affordable Homes?: Portland Appraisal Blog
Coda
Thanks for reading—I hope you found a useful insight or an unexpected nugget along the way. If you enjoyed the post, please consider subscribing for future updates.
Are you an agent in Portland who wonders why appraisers always do “x”?
A homeowner with questions about appraiser methodology?
If so, feel free to reach out—I enjoy connecting with market participants across Portland and the surrounding counties, and am always happy to help where I can.
And if you’re in need of appraisal services in Troutdale or anywhere in the Portland Region, we’d be glad to assist.
About the Author — Abdur Abdul‑Malik, SRA, ASA
Abdur Abdul‑Malik is the founder, author, and publisher of the Portland Appraisal Blog, where he produces original regional and neighborhood‑level housing analytics for the Portland Region. He is a certified residential appraiser serving Oregon and Washington, drawing on RMLS transaction data, public records, and custom segmentation models he has built.
He developed the Portland Appraisal Blog Affordability Index (PABAI), a payment‑based affordability metric built from actual RMLS sales. PABAI incorporates weekly updates based on the prevailing 30‑year fixed mortgage rate, providing a locally grounded measure of housing affordability across the region.
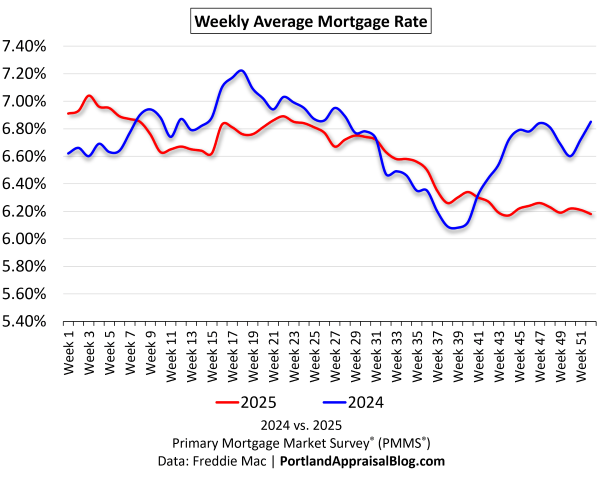
Troutdale’s 2025 housing market generated more than $64 million in residential sales, with detached homes accounting for over 93% of all transactions. Affordability rose sharply; 35% of detached sales were affordable, up from 6%. This was due to softer prices and more favorable mortgage interest rates during peak selling season in 2025 compared with 2024.
Troutdale’s “Gateway to the Gorge” arch welcomes visitors to the city’s historic downtown district near the western entrance to the Columbia River Gorge. Photo: Abdur Abdul-Malik, Portland Appraisal Blog
About This Snapshot
This snapshot summarizes residential sales occurring within the official City of Troutdale limits during calendar year 2025 (with some comparisons to calendar year 2024). Included property types are detached homes, attached homes, condominiums, and manufactured homes on owned land. Data are sourced from RMLS and have undergone our standard cleaning and validation process. Manufactured homes located in leased-space parks are not included. For additional information regarding data cleaning procedures and common MLS data challenges, see the dedicated page: RMLS Data Accuracy Challenges.
Tables in this snapshot cover important metrics such as:
Sales price to original list price: SP/OLP
Price per square foot (total square footage): PPSF (TSF)
Cumulative days on market: CDOM
Average lot size in acres: ac
Market Overview
Located in eastern Multnomah County, Troutdale is a community in the Portland Region best known as the “Gateway to the Gorge.” Situated near the western entrance to the Columbia River Gorge, the city offers convenient access to outdoor recreation while remaining connected to the broader Portland metropolitan area.
Citywide Residential Market Snapshot
The following table summarizes residential sales occurring within Troutdale city limits during calendar year 2025. Included property types are detached homes, attached homes, condominiums, and manufactured homes on owned land. Together, these four segments provide a high-level overview of Troutdale’s owner-occupied residential market.
Category
Detached
Attached
Condo
Manuf.
Total Dollar Volume
$60,926,158
$2,652,800
$665,000
$0
Average Price
$495,335
$378,971
$332,500
—
Average PPSF (Total SF)
$302.51
$250.99
$226.84
—
Average Total SF
1,706
1,530
1,467
—
Average Lot Size (ac)
0.2160
0.0614
N/A
—
Average Age (Yrs)
37.38
17.00
21.50
—
Average CDOM
42.25
92.14
73.50
—
Total # of Sales
123
7
2
0
% of Market
93.18%
5.30%
1.52%
0.00%
Highest Sale
$840,000
$440,000
$350,000
—
Lowest Sale
$360,000
$332,800
$315,000
—
# Affordable
43
6
2
—
% Affordable
34.96%
85.71%
100.00%
—
January 2025 – December 2025 (132 total residential sales). Data: RMLS | PortlandAppraisalBlog.com
Detached homes accounted for the overwhelming majority of residential sales activity in Troutdale during 2025. Total residential dollar volume across all tracked housing segments reached approximately $64.2 million, with detached homes representing more than 93% of all sales and nearly 95% of total dollar volume. Attached homes and condominiums represented a relatively small share of the market, while no manufactured homes on owned land sold during the year. The following sections examine each segment in greater detail.
Detached Homes
Detached homes represent the largest and most active residential housing segment in Troutdale. Because detached properties accounted for more than 9 out of 10 sales during 2025, this segment provides the clearest view of local market conditions.
Detached Homes Market Statistics
The following table compares detached-home sales activity occurring within Troutdale city limits during 2024 and 2025. Metrics include sales volume, pricing, property characteristics, marketing times, and affordability.
Category
2024
2025
Change
Total $ Volume
$57,199,850
$60,926,158
+6.51%
Average Price
$510,713
$495,335
-3.01%
Median Price
$501,500
$479,000
-4.49%
Avg SP/OLP
99.27%
98.09%
-1.18 pts
Avg PPSF (TSF)
$298.54
$302.51
+1.33%
Avg HOA Dues
$30.80
$44.72
+45.20%
Avg Total SF
1,768
1,706
-3.52%
Avg Lot Size (ac)
0.2160
0.2121
-1.77%
Avg Age (Yrs)
35.32
37.38
+5.83%
Avg CDOM
39.07
42.25
+8.14%
Total # of Sales
112
123
+9.82%
# of New Constr.
0
0
—
# Affordable
7
43
+36 homes
% Affordable
6.25%
34.96%
+28.71 pts
Note: The calculated average HOA dues is for sales reporting nonzero HOA dues (24 sales for 2024 & 35 sales for 2025). All other metrics use the full dataset for each year. Single-Family Detached Residential | 2024 & 2025 Data: RMLS | PortlandAppraisalBlog.com
Detached-home sales activity increased during 2025, with total sales rising from 112 to 123 and total dollar volume increasing 6.51% to approximately $60.9 million. Despite stronger sales activity, both average and median sales price declined modestly, while average days on market increased just 3 days, from 39 to 42 days. Buyers also gained slightly more negotiating leverage, with the average sale-to-original-list-price ratio declining from 99.27% to 98.09%.
The typical detached home sold during 2025 was somewhat smaller and slightly older than in 2024, while average price per square foot increased modestly. No new detached-home construction sales were recorded in either year, reinforcing Troutdale’s role as a largely resale-driven housing market. HOA participation remained a minority characteristic of the detached market, though the share of detached-home sales reporting HOA dues increased from approximately 21% in 2024 to 29% in 2025.
Detached Homes Sales by Price Range
The following table summarizes detached-home sales occurring within Troutdale city limits during 2025 by price range. In addition to sales volume, the table highlights the typical size and age of homes sold within each price band.
Troutdale’s detached-home market was concentrated in the middle price ranges during 2025. More than 89% of detached-home sales occurred between $400,000 and $599,999, with the $400,000-$499,999 range alone accounting for 71 of 123 sales. As sale prices increased, average home size generally increased as well, from approximately 1,500 square feet in the $400,000-$499,999 range to more than 3,200 square feet in the $700,000+ ranges.
While most sales occurred in homes built during the 1980s and 1990s, the two highest-priced detached-home sales were very different properties. One involved a nearly four-acre mixed-use development site along the Sandy River with an older home contributing little to overall value, while the other was a large historic residence with more than 5,000 square feet of living area and an accessory dwelling unit. These sales illustrate how Troutdale’s highest-priced properties can derive value from factors such as land, development potential, size, and unique property characteristics rather than age alone.
Detached Homes Affordability
The following table summarizes detached-home affordability in Troutdale during 2024 and 2025 using PABAI. In addition to the number and percentage of affordable sales, the table reports the highest affordable sale, the average sales price of affordable homes, and the average household income required to purchase those homes under prevailing market conditions at the time of sale.
Category
2024
2025
Change
Affordable Sales
7
43
+36 homes
% Affordable
6.25%
34.96%
+28.71 pts
Highest Affordable Sale
$445,000
$474,900
+6.72%
Avg Price
$409,080
$431,612
+5.51%
Avg Required Income
$108,737
$114,232
+$5,494.37
Affordable sales are determined using the Portland Appraisal Blog Affordability Index (PABAI), which evaluates each detached-home sale using prevailing mortgage rates, household income assumptions, taxes, insurance, and financing costs at the time of sale.
Detached-home affordability improved substantially during 2025. The number of affordable detached-home sales increased from 7 to 43, while the share of affordable sales increased from 6.25% to 34.96% of the market. The highest affordable detached-home sale increased from $445,000 in 2024 to $474,900 in 2025.
As shown above, mortgage rates were generally higher throughout much of 2024 than 2025. Combined with modest declines in detached-home prices, lower financing costs expanded the number of homes meeting the affordability standard even though the highest affordable detached-home sale changed very little.
The average affordable detached home sold for $431,612 during 2025 and required an estimated household income of approximately $114,232. While affordability remained far from universal, Troutdale offered substantially more attainable detached-home ownership opportunities in 2025 than in the prior year.
Attached Homes
Attached homes represent a small but distinct segment of Troutdale’s housing market. While sales activity is limited compared with detached homes, attached housing can provide an ownership alternative for buyers seeking lower-maintenance living or a smaller land component.
Attached Homes Market Statistics
The following table compares attached-home sales activity occurring within Troutdale city limits during 2024 and 2025. Due to the limited number of sales, the results are best viewed as descriptive measures of market activity rather than indicators of broader market trends.
Category
2024
2025
Change
Total $ Volume
$2,662,500
$2,652,800
-0.36%
Average Price
$443,750
$378,971
-14.60%
Median Price
$420,000
$390,000
-7.14%
Avg SP/OLP
96.36%
88.63%
-7.74 pts
Avg PPSF (TSF)
$289.56
$250.99
-13.32%
Avg HOA Dues
$159.00
$224.25
+41.04%
Avg Total SF
1,528
1,530
+0.19%
Avg Lot Size (ac)
0.0350
0.0614
+75.51%
Avg Age (Yrs)
6.67
17.00
+155.00%
Avg CDOM
47.50
92.14
+93.98%
Total # of Sales
6
7
+16.67%
# of New Constr.
2
0
-100.00%
# Affordable
4
6
+ 2 homes
% Affordable
66.67%
85.71%
+19.04 pts
Note: The calculated average HOA dues is for sales reporting nonzero HOA dues (1 sale for 2024 & 4 sales for 2025). All other metrics use the full dataset for each year. Single-Family Attached Residential | 2024 & 2025 Data: RMLS | PortlandAppraisalBlog.com
Attached-home sales represented a small portion of Troutdale’s residential market in both years, with only seven sales recorded during 2025. Despite the limited number of transactions, attached homes consistently contributed approximately $2.65 million in annual residential dollar volume during both 2024 and 2025.
Pricing measures, including average sales price, price per square foot, and sale-to-list-price ratio, were all lower in 2025 than in 2024. Because the attached-home market consists of a very small number of transactions, year-to-year changes are often skewed by compositional differences among the sales.
Attached Homes Affordability
The following table summarizes attached-home affordability in Troutdale during 2024 and 2025 using PABAI.
Category
2024
2025
Change
Affordable Sales
4
6
+2 homes
% Affordable
66.67%
85.71%
+19.04 pts
Highest Affordable Sale
$420,000
$405,000
-3.57%
Avg Price
$406,250
$368,800
-9.22%
Avg Required Income
$111,482
$104,015
-$7,466.98
Affordable sales are determined using the Portland Appraisal Blog Affordability Index (PABAI), which evaluates each attached-home sale using prevailing mortgage rates, household income assumptions, taxes, insurance, and financing costs at the time of sale.
Attached homes remained one of Troutdale’s most affordable ownership options during both years analyzed. Six of seven attached-home sales met the PABAI affordability standard during 2025, compared with four of six sales during 2024. The average required household income fell from approximately $111,000 to $104,000; largely due to lower average sales prices in 2025 compared to the previous year.
Because the attached-home market consists of only a handful of transactions each year, affordability results should be interpreted cautiously. Nevertheless, the segment consistently provided ownership opportunities at lower price points than the detached-home market, with a large majority of sales meeting the affordability standard in both years.
Condominiums
Condominiums represent a very small segment of Troutdale’s residential market. Like attached homes, due to the limited number of sales, the results are best viewed as descriptive measures of market activity rather than indicators of broader market trends.
Condominium Housing Market Statistics
The following table compares condominium sales activity occurring within Troutdale city limits during 2024 and 2025.
Category
2024
2025
Change
Total $ Volume
$1,804,900
$665,000
-63.16%
Average Price
$360,980
$332,500
-7.89%
Median Price
$347,000
$332,500
-4.18%
Avg SP/OLP
95.68%
95.65%
-0.03 pts
Avg PPSF (TSF)
$223.12
$226.84
+1.67%
Avg HOA Dues
$357.60
$415.00
+16.05%
Avg Total SF
1,634
1,467
-10.20%
Avg Age (Yrs)
21.80
21.50
-1.38%
Avg CDOM
55.20
73.50
+33.15%
Total # of Sales
5
2
-60.00%
# of New Constr.
0
0
—
# Affordable
4
2
-2 homes
% Affordable
80.00%
100.00%
+20.00 pts
Note: All metrics use the full dataset for each year (including HOA dues). Condominium Residential | 2024 & 2025 Data: RMLS | PortlandAppraisalBlog.com
Condominium sales activity remained limited during both years, with only five sales recorded in 2024 and two sales recorded in 2025. While Troutdale contains several condominium communities, recent sales activity was concentrated in a small number of developments. Most of the condominium sales occurring during the period analyzed were located within the Edgefield Meadows community, a townhome-style condominium development.
Pricing remained relatively stable despite the limited number of transactions. Average price per square foot changed very little between years. All condominium sales reported HOA dues, with average monthly dues increasing from approximately $358 to $415. Because the condominium market consists of only a handful of transactions each year, changes in individual metrics strongly reflect the mix of unit sales.
Condominium Housing Affordability
The following table summarizes condominium affordability in Troutdale during 2024 and 2025 using PABAI.
Category
2024
2025
Change
Affordable Sales
4
2
-2 homes
% Affordable
80.00%
100.00%
+20.00 pts
Highest Affordable Sale
$394,000
$350,000
-11.17%
Avg Price
$346,225
$332,500
-3.96%
Avg Required Income
$106,279
$107,724
+$1,445.28
Affordable sales are determined using the Portland Appraisal Blog Affordability Index (PABAI), which evaluates each condominium sale using prevailing mortgage rates, household income assumptions, taxes, insurance, and financing costs at the time of sale.
Condominium affordability remained strong during both years analyzed. Four of five condominium sales met the PABAI affordability standard during 2024, while both condominium sales recorded during 2025 qualified as affordable. Average affordable sales price remained in the mid-$300,000 range, while the average required household income remained relatively stable near $106,000 to $108,000.
Because condominium activity in Troutdale is limited, affordability results are heavily influenced by the specific units that sell during a given year. Nevertheless, the available data indicate that condominiums remained among the city’s more attainable ownership options during both years analyzed.
The City of Troutdale seal, featuring the community’s long-standing connection to the Columbia River and its identity as the “Gateway to the Gorge.” Photo: Abdur Abdul-Malik, Portland Appraisal Blog
Key Takeaways
Troutdale’s housing market is, for practical purposes, a detached-home market. Detached homes accounted for the overwhelming majority of residential sales activity during 2025 and remain the property type that most clearly defines local housing conditions.
The city’s housing stock is primarily composed of resale housing rather than new homes. No new construction detached-home sales were recorded during either 2024 or 2025. Among detached-home sales occurring during the two-year period, construction dates ranged from 1893 to 2022, with the average home built in 1989.
While attached homes and condominiums provide alternative ownership opportunities, both segments remain relatively small and generate limited annual transaction volume compared with detached housing. For buyers looking to take advantage of their comparatively lower prices, such units do not come on the market very often and may require patience.
For buyers seeking a balance between affordability, access to the Portland Region, and proximity to outdoor recreation, Troutdale remains a community worth considering. Located at the gateway to the Columbia River Gorge, the city offers a housing market that remains more attainable than many higher-priced areas within the metropolitan region.
Sources & Further Reading
All data presented in this annual snapshot is sourced directly from RMLS and has been subjected to a rigorous cleaning and validation process to ensure reliability for each single-family residential housing segment analysis. The trends, comparisons, and commentary are the result of original appraisal expertise and independent analysis—not aggregated from secondary sources or news summaries.
Thanks for reading—I hope you found a useful insight or an unexpected nugget along the way. If you enjoyed the post, please consider subscribing for future updates.
Are you an agent in Portland who wonders why appraisers always do “x”?
A homeowner with questions about appraiser methodology?
If so, feel free to reach out—I enjoy connecting with market participants across Portland and the surrounding counties, and am always happy to help where I can.
And if you’re in need of appraisal services in Troutdale or anywhere in the Portland Region, we’d be glad to assist.
About the Author — Abdur Abdul‑Malik, SRA, ASA
Abdur Abdul‑Malik is the founder, author, and publisher of the Portland Appraisal Blog, where he produces original regional and neighborhood‑level housing analytics for the Portland Region. He is a certified residential appraiser serving Oregon and Washington, drawing on RMLS transaction data, public records, and custom segmentation models he has built.
He developed the Portland Appraisal Blog Affordability Index (PABAI), a payment‑based affordability metric built from actual RMLS sales. PABAI incorporates weekly updates based on the prevailing 30‑year fixed mortgage rate, providing a locally grounded measure of housing affordability across the region.