

Photo: Abdur Abdul-Malik, Portland Appraisal Blog
Annual property taxes are an important component of homeownership costs and directly affect housing affordability. Unlike mortgage principal and interest, property taxes are a recurring expense that generally remains payable regardless of financing structure.
Effective tax rate measures annual property taxes as a percentage of sales price. This helps normalize tax burdens across homes with different values and provides a useful point of comparison beyond the annual tax bill itself.
The table below compares annual property tax burdens and effective tax rates for detached-home sales occurring in Troutdale during 2024 and 2025.
| Category | 2024 | 2025 | Change |
|---|---|---|---|
| Average Annual Taxes | $4,629.97 | $4,481.68 | -$148.28 |
| Median Annual Taxes | $4,483.49 | $4,337.72 | -$145.76 |
| Average Effective Tax Rate | 0.9060% | 0.9082% | +0.0022 pts |
| Median Effective Tax Rate | 0.8988% | 0.9026% | +0.0038 pts |
| Highest Annual Tax Bill | $8,914.49 | $8,160.61 | -$753.88 |
| Total # of Sales | 112 | 123 | +11 homes |
Single-Family Detached Residential | 2024 vs. 2025
Data: RMLS | PortlandAppraisalBlog.com
Annual property taxes declined modestly between the two years. Average annual taxes fell from $4,629.97 in 2024 to $4,481.68 in 2025, a decline of 3.20%. Detached homes selling during 2025 were also 3.52% smaller on average according to the Troutdale Snapshot, a likely contributor to the lower tax burden observed during the study period.
Despite the decline in annual tax bills, effective tax rates remained remarkably stable. Average effective tax rates increased only 0.0022 percentage points, while median effective tax rates increased 0.0038 percentage points. This suggests that lower tax bills were primarily associated with differences in the characteristics of homes selling during each year rather than a meaningful change in the effective tax burden relative to sales prices.
The histogram below shows the distribution of annual property tax obligations among detached-home sales occurring during the study period.
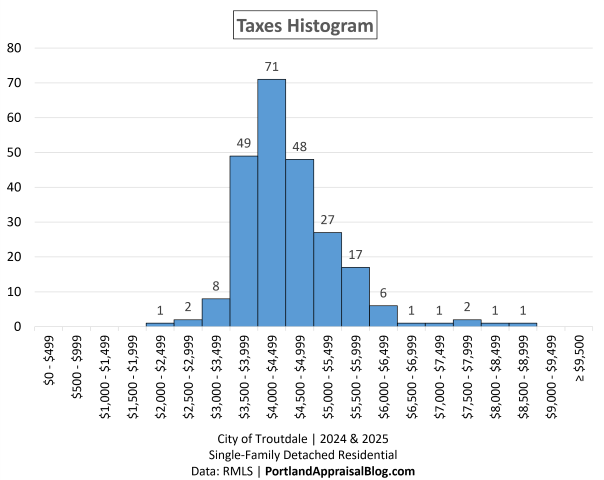
Most sales were concentrated within a relatively narrow range. The largest concentrations occurred between $3,500 and $4,999 annually, with the single dominant bracket being $4,000-$4,499 (71 sales). Relatively few homes reported annual property tax obligations below $3,500 (11) or at or above $6,000 (12). The distribution suggests that most Troutdale buyers purchased homes with annual property tax responsibilities falling near the market average.
The table below summarizes detached-home sales grouped by annual property tax range and includes sales volume, average sales price, average annual taxes, home size, construction era, acreage, and affordability.
| Taxes Range | Sales | Avg Close Price | Avg Tax | Avg Total SF | Avg Year Built | # Afford. |
|---|---|---|---|---|---|---|
| $0 – $499 | 0 | — | — | — | — | 0 |
| $500 – $999 | 0 | — | — | — | — | 0 |
| $1,000 – $1,499 | 0 | — | — | — | — | 0 |
| $1,500 – $1,999 | 0 | — | — | — | — | 0 |
| $2,000 – $2,499 | 1 | $396,060 | $2,484 | 1,228 | 1944 | 1 |
| $2,500 – $2,999 | 2 | $395,000 | $2,985 | 1,403 | 1923 | 2 |
| $3,000 – $3,499 | 8 | $423,688 | $3,379 | 1,266 | 1988 | 8 |
| $3,500 – $3,999 | 49 | $461,555 | $3,824 | 1,381 | 1986 | 18 |
| $4,000 – $4,499 | 71 | $488,158 | $4,250 | 1,601 | 1987 | 13 |
| $4,500 – $4,999 | 48 | $501,543 | $4,674 | 1,801 | 1991 | 7 |
| $5,000 – $5,499 | 27 | $527,396 | $5,212 | 1,965 | 1994 | 1 |
| $5,500 – $5,999 | 17 | $582,497 | $5,667 | 2,169 | 1997 | 0 |
| $6,000 – $6,499 | 6 | $618,131 | $6,204 | 2,681 | 2002 | 0 |
| $6,500 – $6,999 | 1 | $645,000 | $6,662 | 2,580 | 2003 | 0 |
| $7,000 – $7,499 | 1 | $720,000 | $7,279 | 3,255 | 2007 | 0 |
| $7,500 – $7,999 | 2 | $615,500 | $7,781 | 2,954 | 1999 | 0 |
| $8,000 – $8,499 | 1 | $840,000 | $8,161 | 5,100 | 1907 | 0 |
| $8,500 – $8,999 | 1 | $914,000 | $8,914 | 2,992 | 1972 | 0 |
| $9,000 – $9,499 | 0 | — | — | — | — | 0 |
| ≥ $9,500 | 0 | — | — | — | — | 0 |
| Total/ Avg | 235 | $502,664 | $4,552 | 1,735 | 1989 | 50 |
Single-Family Detached Residential | 2024 & 2025
Data: RMLS | PortlandAppraisalBlog.com
Property taxes were heavily concentrated within a relatively narrow range. A total of 168 sales, representing 71.49% of the market, reported annual property taxes between $3,500 and $4,999.
The table also reveals a strong relationship between annual property taxes, home size, and sales price. Homes with average annual taxes between $3,000 and $3,499 averaged 1,266 square feet and a $423,688 sales price. By comparison, homes with average annual taxes between $6,000 and $6,999 averaged 2,667 square feet and a $621,969 sales price. Higher annual tax burdens were generally associated with larger homes, newer construction, and higher sales prices.
The scatter plot below illustrates the relationship between annual property taxes and total living area.
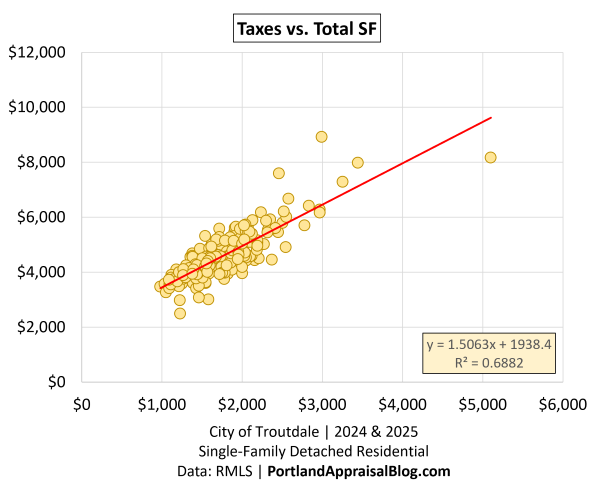
A strong positive relationship is evident, with larger homes generally carrying higher property tax obligations. The trendline produces an R² of 0.6882, indicating that total living area alone explains a substantial portion of the variation in annual property taxes across the study period. The relationship is not perfect, but it is strong enough to suggest that dwelling size is one of the most important predictors of annual tax burden among detached homes in Troutdale.
Although lot size can influence property taxes in some cases, additional analysis indicated that higher tax burdens were more consistently associated with larger homes and higher-value properties than with acreage alone. Very large parcels represented only a small portion of the market and do not appear to explain the broader tax distribution.
Property taxes also played a meaningful role in housing affordability. Across the 235 detached-home sales included in this study, annual property taxes accounted for 12.09% of the estimated monthly housing obligation, on average, calculated under the Portland Appraisal Blog Affordability Index (PABAI). Among individual sales, the proportion ranged from 7.29% to 18.42%.
Affordable homes were concentrated within the lower tax ranges. Affordability became increasingly uncommon as annual taxes, sales prices, and dwelling sizes increased. In the higher tax bands, where average sales prices exceeded $500,000, relatively few homes met PABAI affordability standards for households earning the applicable HUD median family income.
Most Troutdale buyers purchased homes with annual property tax obligations between $3,500 and $4,999 during 2024-2025, while effective tax rates remained remarkably stable across the study period. Higher tax burdens were generally associated with larger homes, newer construction, and higher sales prices, making property taxes an important component of overall housing affordability and ownership costs.
Related Studies
About PAB Insights
PAB Insights is a Portland Appraisal Blog (PAB) series providing concise, data-driven answers to individual housing-market questions using transaction-level research, local market knowledge, and proprietary models, such as the Portland Appraisal Blog Affordability Index (PABAI).
Sources & Further Reading
All data presented in this PAB Insight is sourced directly from RMLS and has been subjected to a rigorous cleaning and validation process to ensure reliability for detached single-family residential analysis in the six-county Portland Region. The trends, comparisons, and commentary are the result of original appraisal expertise and independent analysis—not aggregated from secondary sources or news summaries.
- RMLS Data Challenges: Portland Appraisal Blog
- The Portland Region – Six-County Market Area Overview: Portland Appraisal Blog
- Portland Affordability Index – PABAI: A Realistic Housing Qualification Metric for the Portland Region: Portland Appraisal Blog
- HUD Portland-Vancouver-Hillsboro, OR-WA MSA: Median Family Income
- City of Troutdale Housing Market Snapshot – 2025: Portland Appraisal Blog
- PAB Insights: What Could Different Household Incomes Buy Among Troutdale’s Affordable Homes?: Portland Appraisal Blog
- PAB Insights: What Income Was Required to Buy a Home in Troutdale (2024-2025)?: Portland Appraisal Blog
- PAB Insights: Which Home Sizes Sold Most Often in Troutdale (2024-2025)?: Portland Appraisal Blog
- PAB Insights: When Were Troutdale’s Homes Built (2024-2025)?: Portland Appraisal Blog
- PAB Insights: What Lot Sizes Defined the Troutdale Market (2024-2025)?: Portland Appraisal Blog
- PAB Insights: Which Bedroom Counts Dominated the Troutdale Market (2024-2025)?: Portland Appraisal Blog
- PAB Insights: Which Bathroom Configurations Sold Most Often in Troutdale (2024-2025)?: Portland Appraisal Blog
- PAB Insights: How Did Buyers Finance Homes in Troutdale (2024-2025)?: Portland Appraisal Blog
- PAB Insights: When Did Homes Sell in Troutdale (2024-2025)?: Portland Appraisal Blog
- PAB Insights: How Long Did It Take Homes to Sell in Troutdale (2024-2025)?: Portland Appraisal Blog
- PAB Insights: Did Troutdale Sellers Get Their Asking Price (2024-2025)?: Portland Appraisal Blog

Coda
Thanks for reading—I hope you found a useful insight or an unexpected nugget along the way. If you enjoyed the post, please consider subscribing for future updates.
Are you an agent in Portland who wonders why appraisers always do “x”?
A homeowner with questions about appraiser methodology?
If so, feel free to reach out—I enjoy connecting with market participants across Portland and the surrounding counties, and am always happy to help where I can.
And if you’re in need of appraisal services in Troutdale or anywhere in the Portland Region, we’d be glad to assist.
About the Author — Abdur Abdul‑Malik, SRA, ASA
Abdur Abdul‑Malik is the founder, author, and publisher of the Portland Appraisal Blog, where he produces original regional and neighborhood‑level housing analytics for the Portland Region. He is a certified residential appraiser serving Oregon and Washington, drawing on RMLS transaction data, public records, and custom segmentation models he has built.
He developed the Portland Appraisal Blog Affordability Index (PABAI), a payment‑based affordability metric built from actual RMLS sales. PABAI incorporates weekly updates based on the prevailing 30‑year fixed mortgage rate, providing a locally grounded measure of housing affordability across the region.
Learn more → PABAI explainer • mortgage rate series • full author bio


