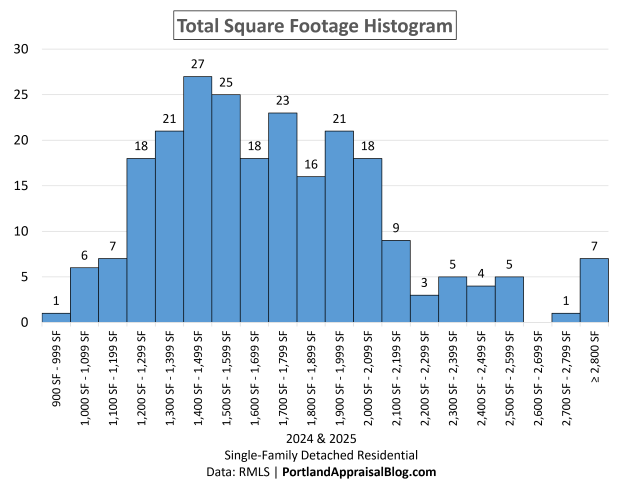
Detached-home sales in Troutdale were highly concentrated, with 79.57% of all sales occurring between 1,200 SF and 2,099 SF during 2024-2025. Average home size declined by 62 SF, while median home size fell by 113 SF.
Troutdale city seal—“Gateway to the Gorge.” Photo: Abdur Abdul-Malik, Portland Appraisal Blog
Detached-home sales in Troutdale spanned a wide range of sizes during 2024 and 2025. While sales ranged from under 1,000 square feet to more than 5,000 square feet, most buyers purchased homes within a much narrower range, with homes 1,400-1,499 SF the most dominant bracket.
The table below compares key home-size metrics across both years.
Category
2024
2025
Change
Average Total SF
1,768
1,706
-62 SF
Median Total SF
1,727
1,614
-113 SF
Smallest Sale
1,089
980
-109 SF
Largest Sale
2,992
5,100
+2,108 SF
Total # of Sales
112
123
+11 homes
City of Troutdale Total Square Footage Comparisons Single-Family Detached Residential | 2024 vs. 2025 Data: RMLS |PortlandAppraisalBlog.com
Smaller detached homes sold on average in 2025 than in 2024. Average home size declined from 1,768 SF to 1,706 SF, while median size fell from 1,727 SF to 1,614 SF. At the same time, the largest detached-home sale increased from 2,992 SF to 5,100 SF, illustrating the presence of a small upper-end market.
The chart below shows where detached-home sales were concentrated by total square footage during 2024 and 2025.
Detached homes smaller than 1,200 SF saw relatively few transactions. The number of sales increased noticeably beginning in the 1,200-1,299 SF & 1,300-1,399 ranges and remained strong through much of the market’s mid-sized ranges, reaching a peak in the 1,400-1,499 SF range, which recorded 27 sales. Other notable concentrations occurred in the 1,500-1,599 SF range (25 sales), the 1,700-1,799 SF range (23 sales), and the 1,900-1,999 SF range (21 sales).
The final size band (≥2,800 SF) serves as a catch-all category for the market’s thin upper tail. Larger detached homes continued to sell throughout the study period, but transaction volume declined substantially beyond roughly 2,100 SF.
The table below summarizes each size band and includes average sales price, average living area, average year built, and average lot size.
SF Range
Sales
Avg Close Price
Avg Total SF
Avg Year Built
Avg Acres
900 SF – 999 SF
1
$422,500
980
1979
0.130
1,000 SF – 1,099 SF
6
$424,167
1,074
1981
0.228
1,100 SF – 1,199 SF
7
$451,286
1,146
1979
0.166
1,200 SF – 1,299 SF
18
$457,244
1,251
1980
0.181
1,300 SF – 1,399 SF
21
$467,995
1,351
1984
0.198
1,400 SF – 1,499 SF
27
$481,009
1,443
1986
0.319
1,500 SF – 1,599 SF
25
$473,312
1,555
1989
0.172
1,600 SF – 1,699 SF
18
$485,436
1,641
1990
0.181
1,700 SF – 1,799 SF
23
$479,465
1,752
1988
0.177
1,800 SF – 1,899 SF
16
$516,053
1,851
1991
0.235
1,900 SF – 1,999 SF
21
$530,940
1,947
1994
0.188
2,000 SF – 2,099 SF
18
$530,242
2,042
1994
0.188
2,100 SF – 2,199 SF
9
$536,222
2,156
1997
0.143
2,200 SF – 2,299 SF
3
$559,300
2,240
1985
0.233
2,300 SF – 2,399 SF
5
$582,600
2,333
2002
0.154
2,400 SF – 2,499 SF
4
$568,750
2,434
2001
0.160
2,500 SF – 2,599 SF
5
$560,780
2,541
1997
0.164
2,600 SF – 2,699 SF
0
—
—
—
—
2,700 SF – 2,799 SF
1
$705,000
2,778
1990
0.620
≥ 2,800 SF
7
$743,412
3,367
1986
0.580
Total/Avg
235
$502,664
1,735
1989
0.214
City of Troutdale Home Sales by Size Band Single-Family Detached Residential | 2024 & 2025 Data: RMLS |PortlandAppraisalBlog.com
The market was highly concentrated. Homes between 1,200 SF and 2,099 SF accounted for 187 of 235 sales, or 79.57% of all detached-home transactions during the study period.
Within this range, average sales price increased from approximately $457,000 to a little over $530,000 as home size increased. Most homes in the market’s most active size ranges were built during the 1980s and 1990s, reflecting the era that helped define much of Troutdale’s detached-housing stock.
Despite substantial differences in living area, average lot sizes remained relatively consistent throughout much of the market’s core size ranges.
Troutdale’s detached-home market was highly concentrated between 1,200 SF and 2,099 SF.
PAB Insights is a Portland Appraisal Blog (PAB) series providing concise, data-driven answers to individual housing-market questions using transaction-level research, local market knowledge, and proprietary models, such as the Portland Appraisal Blog Affordability Index (PABAI).
Sources & Further Reading
All data presented in this PAB Insight is sourced directly from RMLS and has been subjected to our rigorous cleaning and validation process to ensure reliability for detached single-family residential analysis in the six-county Portland Region. The trends, comparisons, and commentary are the result of original appraisal expertise and independent analysis—not aggregated from secondary sources or news summaries.
PAB Insights: What Could Different Household Incomes Buy Among Troutdale’s Affordable Homes?: Portland Appraisal Blog
PAB Insights: What Income Was Required to Buy a Home in Troutdale (2024-2025)?: Portland Appraisal Blog
Coda
Thanks for reading—I hope you found a useful insight or an unexpected nugget along the way. If you enjoyed the post, please consider subscribing for future updates.
Are you an agent in Portland who wonders why appraisers always do “x”?
A homeowner with questions about appraiser methodology?
If so, feel free to reach out—I enjoy connecting with market participants across Portland and the surrounding counties, and am always happy to help where I can.
And if you’re in need of appraisal services in Troutdale or anywhere in the Portland Region, we’d be glad to assist.
About the Author — Abdur Abdul‑Malik, SRA, ASA
Abdur Abdul‑Malik is the founder, author, and publisher of the Portland Appraisal Blog, where he produces original regional and neighborhood‑level housing analytics for the Portland Region. He is a certified residential appraiser serving Oregon and Washington, drawing on RMLS transaction data, public records, and custom segmentation models he has built.
He developed the Portland Appraisal Blog Affordability Index (PABAI), a payment‑based affordability metric built from actual RMLS sales. PABAI incorporates weekly updates based on the prevailing 30‑year fixed mortgage rate, providing a locally grounded measure of housing affordability across the region.
Average required income for Troutdale detached homes declined from $137,475 in 2024 to $131,873 in 2025. While required incomes fell only modestly, affordable detached-home sales increased dramatically as many homes sat near the affordability threshold. Rates tipped the scale.
Troutdale arch sign. Photo: Abdur Abdul-Malik, Portland Appraisal Blog
The amount of income required to purchase a detached home in Troutdale declined modestly between 2024 and 2025. While average and median required incomes fell by roughly 4%, the share of detached-home sales classified as affordable under the Portland Appraisal Blog Affordability Index (PABAI) increased dramatically.
The table below compares key required-income metrics across both years.
Metric
2024
2025
Change
Avg Required Income
$137,475
$131,873
-4.07%
Median Required Income
$134,148
$128,256
-4.39%
Affordable Sales
7
43
+36 homes
% Affordable
6.25%
34.96%
+28.71 pts
Detached-home affordability overview, Troutdale city limits. Affordable homes determined using PABAI. Single-Family Detached Residential | 2024 vs. 2025 Data: RMLS |PortlandAppraisalBlog.com
How “affordable” is defined: PABAI calculates the income needed to buy each home using its actual reported price, taxes, HOA dues, and insurance estimate, financed at the Freddie Mac 30-year rate in effect at the time of sale. A home counts as affordable if that required income is at or below the HUD median family income for the Portland-Vancouver-Hillsboro MSA in effect at the time.
At first glance, the affordability gains appear out of proportion to the decline in required incomes. Average required income fell just 4.07%, yet affordable detached-home sales increased from 7 to 43.
Part of the explanation can be found in how ownership costs were allocated.
Category
2024
2025
Change
Avg Principal & Interest Share
82.47%
82.05%
-0.42 pts
Avg Taxes Share
12.01%
12.17%
+0.16 pts
Avg HOA Share
0.21%
0.41%
+0.20 pts
Avg Insurance Share
5.31%
5.37%
+0.06 pts
Average share of housing payments attributable to principal & interest, property taxes, HOA dues, and insurance as modeled under the PABAI framework. Shares are averaged across all detached sales; sales without HOA dues count as 0% HOA. Single-Family Detached Residential | 2024 vs. 2025 Data: RMLS |PortlandAppraisalBlog.com
Mortgage principal and interest accounted for roughly 82% of the typical modeled housing payment in both years. While the P&I share declined by only 0.42 percentage points between 2024 and 2025, that small change proved meaningful because detached-home sales were heavily concentrated near the affordability threshold. In a market sitting at the boundary of affordability, even modest improvements in financing costs can move a significant number of homes from unaffordable to affordable.
Taxes and insurance remained relatively stable. HOA dues represented a larger share of modeled ownership costs in 2025, although part of that increase can be attributed to a greater number of HOA-governed homes selling in 2025 (35) than in 2024 (24).
The table above illustrates why mortgage rates matter. When more than four-fifths of a typical housing payment is attributable to financing costs, even modest improvements in mortgage financing conditions can materially affect affordability.
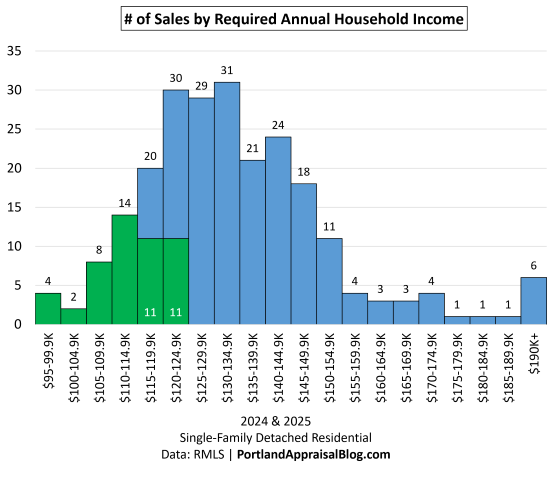
The chart below combines 2024 and 2025 detached-home sales to show where required incomes were concentrated.
Most detached-home sales required between roughly $115,000 and $149,999 of annual household income. The green bars represent homes that met the PABAI affordability standard in effect at the time of sale.
The first four income bands were naturally affordable because they generally fell below the applicable HUD median family income thresholds throughout the study period. Additional affordable sales appeared in the $115,000-$119,999 and $120,000-$124,999 income bands, reflecting changes in affordability thresholds and financing conditions over time.
The table below summarizes the distribution and includes the percentage of sales in each band, making it easier to evaluate where the market was concentrated.
Required Income
# of Sales
% of Sales
# Affordable
$95-99.9K
4
1.70%
4
$100-104.9K
2
0.85%
2
$105-109.9K
8
3.40%
8
$110-114.9K
14
5.96%
14
$115-119.9K
20
8.51%
11
$120-124.9K
30
12.77%
11
$125-129.9K
29
12.34%
0
$130-134.9K
31
13.19%
0
$135-139.9K
21
8.94%
0
$140-144.9K
24
10.21%
0
$145-149.9K
18
7.66%
0
$150-154.9K
11
4.68%
0
$155-159.9K
4
1.70%
0
$160-164.9K
3
1.28%
0
$165-169.9K
3
1.28%
0
$170-174.9K
4
1.70%
0
$175-179.9K
1
0.43%
0
$180-184.9K
1
0.43%
0
$185-189.9K
1
0.43%
0
$190K+
6
2.55%
0
Sum
235
100.00%
50
Detached-home sales by required income band (2024-2025), including the share of sales and number classified as affordable under PABAI. Lower bound inclusive. Single-Family Detached Residential | 2024 & 2025 Data: RMLS |PortlandAppraisalBlog.com
Nearly three-quarters (73.62%) of all detached-home sales required between $115,000 to $149,999 of annual household income. The single largest income band was $130,000 to $134,999, accounting for 13.19% of all sales.
The market was not dominated by homes requiring substantially more income than the affordability threshold. Instead, many sales clustered immediately around it. As mortgage rates modestly improved during much of the 2025 selling season, required incomes fell enough to bring more homes into the affordability zone. Affordability was also buoyed by a rising HUD median family income for the Portland-Vancouver-Hillsboro MSA: $114,400 in 2024, rising to $124,100 by April 2025 and holding there through year-end.
PAB Insights is a Portland Appraisal Blog (PAB) series providing concise, data-driven answers to individual housing-market questions using transaction-level research, local market knowledge, and proprietary models, such as the Portland Appraisal Blog Affordability Index (PABAI).
Sources & Further Reading
All data presented in this PAB Insight is sourced directly from RMLS and has been subjected to our rigorous cleaning and validation process to ensure reliability for detached single-family residential analysis in the six-county Portland Region. The trends, comparisons, and commentary are the result of original appraisal expertise and independent analysis—not aggregated from secondary sources or news summaries.
PAB Insights: What Could Different Household Incomes Buy Among Troutdale’s Affordable Homes?: Portland Appraisal Blog
Coda
Thanks for reading—I hope you found a useful insight or an unexpected nugget along the way. If you enjoyed the post, please consider subscribing for future updates.
Are you an agent in Portland who wonders why appraisers always do “x”?
A homeowner with questions about appraiser methodology?
If so, feel free to reach out—I enjoy connecting with market participants across Portland and the surrounding counties, and am always happy to help where I can.
And if you’re in need of appraisal services in Troutdale or anywhere in the Portland Region, we’d be glad to assist.
About the Author — Abdur Abdul‑Malik, SRA, ASA
Abdur Abdul‑Malik is the founder, author, and publisher of the Portland Appraisal Blog, where he produces original regional and neighborhood‑level housing analytics for the Portland Region. He is a certified residential appraiser serving Oregon and Washington, drawing on RMLS transaction data, public records, and custom segmentation models he has built.
He developed the Portland Appraisal Blog Affordability Index (PABAI), a payment‑based affordability metric built from actual RMLS sales. PABAI incorporates weekly updates based on the prevailing 30‑year fixed mortgage rate, providing a locally grounded measure of housing affordability across the region.
During 2024 and 2025, 50 detached homes in the City of Troutdale were classified as affordable, as measured by the Portland Appraisal Blog Affordability Index (PABAI). A household earning approximately $124,000 could have qualified for all of them.
Troutdale city seal—“Gateway to the Gorge.” Photo: Abdur Abdul-Malik, Portland Appraisal Blog
During 2024 and 2025, detached homes accounted for 92.16% of all residential sales occurring within Troutdale city limits. As a result, most discussions about housing affordability in Troutdale are effectively discussions about the detached-home market.
During the two-year study period, 235 detached homes sold on the open market. Of those, 50 (21.28%) were classified as affordable under the Portland Appraisal Blog Affordability Index (PABAI). The majority of the affordable homes (43 of the 50) sold in 2025.
Metric
Value
Total Detached Sales
235
Affordable Detached Sales
50
% Affordable
21.28%
Min Required Income (All Detached Sales)
$95,373
Median Required Income (All Detached Sales)
$131,883
Max Required Income (All Detached Sales)
$242,349
Detached-home affordability overview, Troutdale city limits. Affordable homes determined using PABAI. Single-Family Detached Residential | 2024 & 2025 Data: RMLS |PortlandAppraisalBlog.com
How “affordable” is defined: PABAI calculates the income needed to buy each home using its actual reported price, taxes, HOA dues, and insurance estimate, financed at the Freddie Mac 30-year rate in effect at the time of sale. A home counts as affordable if that required income is at or below the HUD median family income for the Portland-Vancouver-Hillsboro MSA in effect at the time.
The required-income figures above describe the entire detached-home market, not just affordable homes. During the study period, the most expensive detached home that still qualified as affordable required approximately $123,916 of household income. That figure closely aligned with the applicable HUD MSA family income used during much of the period.
The following table is cumulative. For example, a household earning $115,000 could theoretically access all affordable detached homes requiring $115,000 or less in qualifying income. Likewise, a household earning $124,000 could access the entire inventory of detached homes meeting the affordability standard.
Household Income
# Affordable
Avg Price
Avg Total SF
Avg Acres
Avg Year
$100,000
4
$359,375
1,495
0.175
1956
$115,000
28
$410,250
1,425
0.162
1981
$124,000
50
$428,457
1,462
0.164
1984
Average characteristics of cumulative affordable detached-home inventory accessible at selected household income levels. Data: RMLS | PortlandAppraisalBlog.com
One of the most interesting findings is that higher household income primarily expanded buyer choice rather than dramatically changing the type of home available. The number of attainable homes increased substantially as income increased, but the physical characteristics of those homes remained surprisingly similar.
Home size, lot size, and age varied less than many buyers might expect. Across all three tiers, the typical affordable detached home remained roughly 1,400 to 1,500 square feet on approximately 0.16 to 0.18 acres.
The more meaningful differences appeared in inventory count and property condition. The lowest-income tier included several fixer and distressed-sale opportunities, while the highest-income tier opened access to a much larger selection of well-maintained and updated homes. The affordable inventory was dominated by traditional suburban housing styles, particularly one-story ranch homes and split-level designs. Among the ten highest-priced affordable detached homes sold during the study period, only one was reported in below-average condition, with the remainder described as being in good, updated, or remodeled condition.
For Troutdale’s relatively uniform detached-home market, additional household income often translated into more options and better-condition homes rather than dramatically larger ones. Households near the $124,000 income tier not only gained access to the full affordable detached-home inventory, but also enjoyed a broader selection of turnkey homes requiring little or no immediate repair work.
About PAB Insights
PAB Insights is a Portland Appraisal Blog (PAB) series providing concise, data-driven answers to individual housing-market questions using transaction-level research, local market knowledge, and proprietary models, such as the Portland Appraisal Blog Affordability Index (PABAI).
Sources & Further Reading
All data presented in this PAB Insight is sourced directly from RMLS and has been subjected to our rigorous cleaning and validation process to ensure reliability for detached single-family residential analysis in the six-county Portland Region. The trends, comparisons, and commentary are the result of original appraisal expertise and independent analysis—not aggregated from secondary sources or news summaries.
Thanks for reading—I hope you found a useful insight or an unexpected nugget along the way. If you enjoyed the post, please consider subscribing for future updates.
Are you an agent in Portland who wonders why appraisers always do “x”?
A homeowner with questions about appraiser methodology?
If so, feel free to reach out—I enjoy connecting with market participants across Portland and the surrounding counties, and am always happy to help where I can.
And if you’re in need of appraisal services in Troutdale or anywhere in the Portland Region, we’d be glad to assist.
About the Author — Abdur Abdul‑Malik, SRA, ASA
Abdur Abdul‑Malik is the founder, author, and publisher of the Portland Appraisal Blog, where he produces original regional and neighborhood‑level housing analytics for the Portland Region. He is a certified residential appraiser serving Oregon and Washington, drawing on RMLS transaction data, public records, and custom segmentation models he has built.
He developed the Portland Appraisal Blog Affordability Index (PABAI), a payment‑based affordability metric built from actual RMLS sales. PABAI incorporates weekly updates based on the prevailing 30‑year fixed mortgage rate, providing a locally grounded measure of housing affordability across the region.
Q1 2026 detached homes: average price $659,197, median $580,000, and 3,349 sales in the Portland Region. Core (< $1M) dipped modestly, luxury new construction (≥ $1M) fell 44%, and CDOM rose in most counties. Mix shifts shaped pricing as smaller lots sold. Affordability improved, but demand held steady despite slightly lower mortgage rates.
Via Canva Pro
The first quarter of 2026 landed softer than the same period last year, even as mortgage rates eased from their 2025 highs. Activity across the region was steady enough to keep the market functional, but not strong enough to match last year’s pace. What emerged instead was a quarter defined by segmentation: different counties, and even different price tiers within counties, moved in noticeably different directions depending on what types of homes sold.
The core market—homes under $1 million—saw mild slippage, much of it tied to compositional changes. Smaller homes on smaller lots were more common this quarter, which pulled down average prices even as underlying values remained relatively stable. The luxury market told a different story. New construction in the $1M+ segment fell sharply, and that retreat alone accounted for a large share of the region’s year‑over‑year decline. With fewer high‑end new builds closing, luxury volume and pricing softened more noticeably than the core.
Across the region, buyers were active but deliberate, and sellers faced longer marketing times in most counties. Affordability improved modestly thanks to lower rates, but not enough to materially change buyer behavior. Taken together, Q1 2026 was not a dramatic quarter—just a quieter one, shaped as much by what sold as by how the market performed.
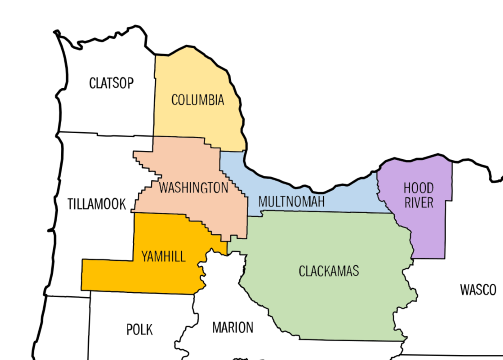
The Portland Region in this update comprises the six Oregon counties of Columbia, Clackamas, Hood River, Multnomah, Washington, and Yamhill. These counties form a contiguous housing ecosystem centered on Portland—Multnomah as the core home county, with the others tightly integrated through commuting patterns, economic ties, and shared market dynamics (e.g., Yamhill’s strong connection via Highway 99W and wine-country adjacency). Beyond Yamhill, the MLS system changes, further distinguishing this six-county area from broader geographic aggregations. For a detailed overview—including county profiles, population data, key value influencers, and why this definition differs from the official seven-county Portland–Vancouver–Hillsboro MSA—see the dedicated page: The Portland Region – Six-County Market Area Overview.
All data is sourced from RMLS and reflects open-market detached single-family residential sales (excluding condos, attached homes, manufactured homes on leased land, and multifamily). SNL (“Sold Not Listed”) entries—off-market transactions entered retroactively—have been excluded to preserve consistency with true market activity.
All figures have undergone my standard cleaning process to address common RMLS accuracy challenges, including misclassifications (e.g., condos listed as detached), square footage/price typos, incomplete fields, status/date mismatches, and non-representative entries. For a detailed overview of these issues, their impact on market analysis, and how I mitigate them through automated flagging, cross-verification, and manual review, see the dedicated page: RMLS Data Accuracy Challenges.
Residential Housing Snapshot
Category
Detached
Attached
Condo
Manuf.
Total $ Volume
$2.2B
$161.0M
$199.0M
$32.4M
Avg Price
$659,197
$444,672
$389,438
$540,352
Avg PPSF (Total SF)
$316.21
$286.91
$325.55
$356.75
Avg Total SF
2,164
1,576
1,180
1,571
Avg Lot Size (ac)
0.655
0.066
N/A
7.959
Avg Age (Yrs)
46.03
15.09
32.03
29.10
Avg CDOM
80.22
80.59
119.62
118.25
# of Sales
3,349
362
511
60
% of Market
78.21%
8.45%
11.93%
1.40%
Highest Sale
$5,725,950
$1,175,000
$2,450,000
$2,400,000
Lowest Sale
$135,000
$249,000
$100,000
$199,700
Price Spread Ratio
42.41
4.72
24.50
12.02
PPSF Spread Ratio
30.93
4.08
11.91
13.29
Total SF Spread Ratio
23.46
4.14
12.24
3.52
Avg PABAI
85.45
110.38
122.83
118.04
Q1 2026 (4,282 total residential sales). Data: RMLS | PortlandAppraisalBlog.com
Detached homes continue to define the structure of the Portland Region’s residential market in Q1 2026. They account for more than three‑quarters of all open‑market residential sales and over $2.2 billion of the region’s $2.6 billion in total dollar volume, and they remain the least affordable segment with a PABAI of 85.45. For readers new to the metric, a PABAI of 100 means a home is perfectly affordable to the median HUD MSA income; values below 100 indicate unaffordability, and values above 100 indicate more readily affordable conditions. Detached properties also sit on ten times the land of attached homes on average and are significantly larger, with an average dwelling size more than 500 square feet above attached and manufactured homes and over 1,000 square feet above condos. Their wide spread ratios across price, PPSF, and size reflect a segment that spans everything from sub‑$150,000 fixers to multi‑million‑dollar estates. This combination of scale, land intensity, and internal diversity will be explored in greater detail in this update.
In contrast, the other three segments help illustrate the pathways buyers take when detached becomes harder to access. Attached homes are the clearest counterpoint: the youngest segment (average age ~15 years), the most uniform by spread ratios, and the most “commodity‑like” product in the region. Their modest affordability (PABAI 110.38) and predictable size and pricing make them the safety‑net entry point for buyers priced out of detached. Condos and manufactured homes share surprising similarities—affordability (PABAI 122.83 and 118.04), age, CDOM, and even price ceilings—yet diverge sharply in average price because manufactured homes trade on land, while condos trade on HOA dues, the hidden variable that shapes their affordability profile.
Entry‑level opportunities still exist across the region, with the lowest Q1 sale closing at $100,000, but buyers must compromise on location, utility, condition, or quality—especially for detached fixers. Three of the four segments cluster in the low–mid $300s PPSF, underscoring that structure cost is relatively consistent across the metro; it is land and home size that creates the separation between detached and everything else. Spread ratios help illustrate this internal variation by comparing the highest and lowest values within each segment—higher ratios indicate a wider spectrum of product types and price points, while lower ratios signal a more uniform, commodity‑like segment. Detached homes’ wide spread ratios (Price 42.41, PPSF 30.93, SF 23.46) highlight its internal variability and set the stage for the segment‑specific analysis that follows.
Portland Region Q1 2026 Overview
Overall Regional Trends
The table below summarizes key metrics for detached single-family residential sales in the Portland Region (Columbia, Clackamas, Hood River, Multnomah, Washington, and Yamhill counties) for Q1 2026 compared with Q1 2025.
Category
Q1 2025
Q1 2026
% Change
Total $ Volume
$2.25 Billion
$2.21 Billion
-1.79%
Average Price
$673,455
$659,197
-2.12%
Median Price
$590,000
$580,000
-1.69%
Avg SP/OLP
97.35%
96.88%
-0.48%
Avg PPSF (TSF)
$320.27
$316.21
-1.27%
Avg HOA Dues
$71.23
$69.10
-2.99%
Avg Lot Size (ac)
0.63
0.66
+4.15%
Avg Age (Yrs)
46.14
46.03
-0.24%
Avg CDOM
72.10
80.22
+11.26%
Avg Total SF
2,167
2,164
-0.16%
Total # of Sales
3,338
3,349
+0.33%
# of New Constr.
459
461
+0.44%
# of REOs
16
40
+150.00%
# of Short Sales
11
14
+27.27%
Average PABAI
75.21
85.45
+13.62%
Note: The calculated average HOA dues is for sales reporting nonzero HOA dues (860 sales for Q1 2025 & 879 sales for Q1 2026). All other metrics use the full dataset for each quarter. Single-Family Detached Residential | Q1 2025 & Q1 2026 Data: RMLS | PortlandAppraisalBlog.com
Key Observations From the Aggregate Data
The regional market showed modest softening in Q1 2026, with average and median prices both posting low‑single‑digit declines. Because total sales, average square footage, new‑construction activity, and the age of sold homes all remained essentially unchanged year over year, much of this movement reflects genuine price erosion rather than a shift in the types of homes selling. Dollar volume fell by nearly the same percentage as median price, reinforcing that the decline was driven by pricing rather than a contraction in activity.
Affordability improved meaningfully, with the regional PABAI rising from 75.21 to 85.45. This improvement was driven less by price relief and more by the combination of rising HUD MSA incomes and the fact that Q1 2025 mortgage rates were among the most punishing of the cycle. Even with this improvement, the region remains broadly unaffordable to the median household, but the year‑over‑year shift marks a notable easing of conditions compared to the prior winter.
One nuance becomes clear only when the market is sliced: while the regional average lot size increased slightly, this was driven by the ≥$1M segment, where larger‑parcel properties made up a greater share of sales. In the core market (<$1M), average lot size actually declined, and that shift contributed to the mild price softening in that segment. This compositional effect is not visible in the aggregate data but becomes important when interpreting the underlying dynamics of the detached market.
Distressed sales, while still a small share of the market, increased materially. REOs more than doubled and short sales rose as well, bringing the distressed share from 0.80% to 1.61% of all closings. These are not systemic levels, but they may represent early signs of pressure at the margins—particularly among households who purchased or refinanced during the peak‑rate environment. Marketing times lengthened for the second consecutive year, with CDOM rising more than 11%. This continues the multi‑quarter pattern of a market weighed down by persistently high interest rates, where buyers remain active but more selective, and sellers face longer exposure before securing a contract.
Portland Region Scatter Plots
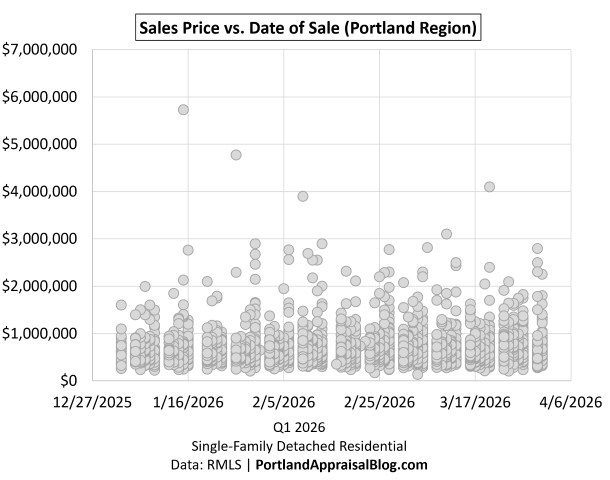
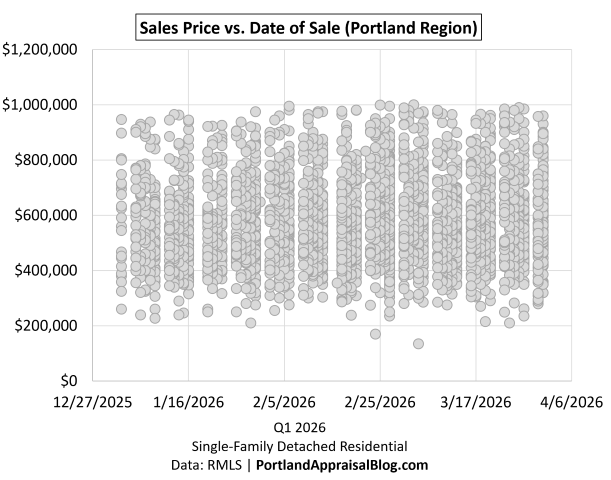
To visualize the distribution of individual detached homes sales prices across Q1 2026, the following scatter plot shows sales price against date of sale:
The scatter plot below illustrates the distribution of individual detached home sales across Q1 2026, with each point representing a single closing. The vast majority of activity—more than 3,000 of the 3,349 sales—occurred below $1 million, forming the dense mid‑band that represents the functional core of the detached market. Above $1 million, the cloud begins to thin, with a smaller set of luxury transactions extending into the $3–5 million range; these outliers contribute to the segment’s wide price spread but do not define overall market behavior. The vertical dispersion in the chart reflects the extraordinary diversity of detached housing in the region, ranging from sub‑1,000‑square‑foot cottages to 9,000‑square‑foot luxury builds, combined with differences in land, location, and condition. Sales are evenly distributed across the quarter, showing a market that remained active and steady, and the absence of any clear trend reinforces that the modest year‑over‑year price erosion observed in the aggregate data reflects broader conditions rather than intra‑quarter softening.
Core Market (< $1M)
The core market—detached single‑family homes closing under $1 million—continues to anchor the region’s detached activity, representing 91.61% of all sales and 81.03% of total dollar volume in Q1 2026. Because this segment accounts for nearly all transactions, it provides the clearest view of underlying market conditions. Year‑over‑year changes are modest, but they reveal a market that remains functional, rate‑weighted, and subtly reshaped by a shift in land characteristics that is not visible in the regional aggregates.
The table below shows core-market metrics for Q1 2026 compared with Q1 2025.
Price levels in the core segment softened slightly, with average price down about 1.5% and median price slipping just under 1%. These declines are small but meaningful—and importantly, they are partly compositional. While total square footage, average age, and the number of sales remained essentially unchanged, average lot size contracted from 0.51 to 0.45 acres, a notable shift for detached homes. Smaller parcels naturally pull down both price and PPSF, even when structure size is stable. This nuance is masked in the regional overview, where the >$1M segment—characterized by larger lots—pulled the overall average upward. Only by slicing the market does the underlying trend become clear: the core segment sold slightly less land this year, and that contributed to the mild price erosion.
PPSF followed the same pattern, declining from $312.73 to $308.78 (‑1.3%). With total square footage essentially flat (2,007 → 2,005), this movement reflects both the modest softening in pricing and the shift toward smaller lots. In a detached market where land is a major component of value, even small changes in parcel size can influence price metrics in ways that are not immediately visible without segmentation.
New construction strengthened the segment, rising from 407 to 432 closings (+6.1%). This increase helped keep the average age of sold homes stable and indicates that builders continue to find demand in the entry‑to‑mid‑level detached market despite elevated borrowing costs. The steady flow of new inventory also contributes to the segment’s overall stability, offering buyers predictable options within the core price band.
Market tempo slowed, with average cumulative days on market rising from 69 to 75 days (+8.8%). This increase mirrors the broader regional pattern and reflects the behavior of affordability‑conscious buyers navigating higher rates: more comparison shopping, more negotiation, and more time before committing. The slight decline in the SP/OLP ratio (97.54% → 97.12%) reinforces this dynamic, showing that buyers in the core segment have gained a bit more leverage than they held a year ago.
Overall, the core market remains structurally stable. Prices softened modestly, lots trended smaller, new construction strengthened, and buyers took more time to transact—all consistent with a detached market adjusting to persistent rate pressure rather than reacting to distress or volatility. The compositional shift in land is the key nuance this quarter: it explains part of the mild price decline and highlights why slicing the market is essential for understanding the true dynamics beneath the regional averages.
Core Market (< $1M) Scatter Plot
To visualize pricing behavior within the core detached segment, the following scatter plot shows individual sales under $1 million across Q1 2026:
Most core‑market sales fall between $300,000 and $800,000, and this is where the scatter plot forms its densest cluster; 86.95% of detached sales occur within this range. Activity becomes noticeably thinner above $800,000 and tapers further as prices approach the $1 million threshold. The even spread of points across the quarter indicates a steady, active market with no visible intra‑quarter trend—consistent with a segment that is stable, rate‑weighted, and not experiencing rapid shifts in buyer or seller behavior. The mild year‑over‑year softening observed in the core market reflects broader conditions and subtle compositional changes rather than any short‑term movement within the quarter.
Luxury Market (≥ $1M)
The luxury segment—detached homes closing at $1 million or more—remains a small but influential share of the regional market, representing 8.39% of all sales and 18.97% of total dollar volume in Q1 2026. Activity held essentially flat year over year, with total sales dipping only slightly (284 → 281), but the composition of what sold shifted in ways that meaningfully shaped the segment’s pricing and tempo.
The table below shows luxury-market metrics for Q1 2026 compared with Q1 2025.
The most striking change this quarter is the sharp increase in market time. Average cumulative days on market rose from 105 to 136 days, a nearly 29% jump that pushes the segment well past the four‑month mark. This reflects a luxury market where buyers remain active but highly selective, and where elevated borrowing costs have lengthened decision cycles. The decline in the SP/OLP ratio (95.31% → 94.33%) reinforces this dynamic: sellers are conceding more at the negotiation table to secure a contract.
Pricing signals are mixed but ultimately point toward softening. Average price fell 3.8%, while median price rose 1.2%—a divergence explained by a significant compositional shift. The average lot size of sold luxury homes increased dramatically, from 1.93 to 2.90 acres (+50%). Larger parcels tend to pull the median upward even when underlying pricing is flat or declining. This is consistent with the modest drop in PPSF (‑1.0%) and the decline in average price, both of which indicate that the underlying value trend is softening despite the median tick upward.
The segment also skewed older this year, with average age rising from 37 to 41 years. This is directly tied to the steep decline in new‑construction closings (52 → 29, down 44%). With fewer new deliveries entering the upper market, older resale inventory made up a larger share of what sold. These resales helped keep total unit volume nearly flat.
Overall, the luxury market in Q1 2026 reflects a slower, more deliberate segment shaped by higher rates, fewer new‑construction offerings, and a shift toward larger, older properties. Demand remains present, but buyers are taking more time, negotiating more firmly, and showing greater sensitivity to price and condition. The compositional shift toward larger lots also helps explain why the regional average lot size appeared stable even as the core market contracted—an important nuance that becomes visible only when the market is segmented.
Luxury Market (≥ $1M) Scatter Plot
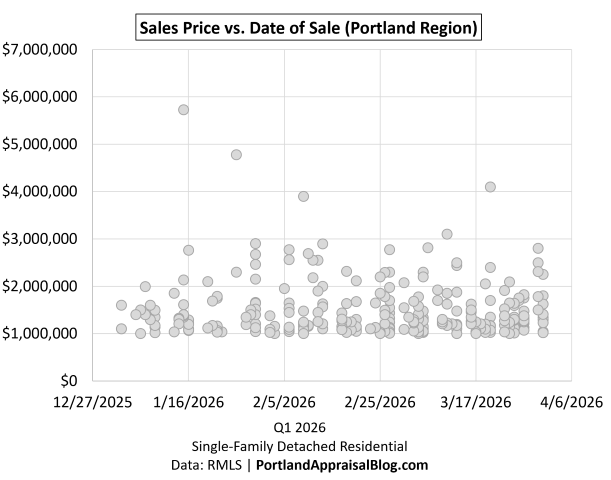
To visualize pricing behavior in the upper end of the detached market, the scatter plot below shows individual sales at or above $1 million across Q1 2026.
Most luxury‑segment sales cluster between $1 million and $2 million, with activity thinning noticeably above $2 million and only a small number of outliers reaching into the $4–6 million range. The distribution remains steady across the quarter, with no visible intra‑quarter trend—consistent with a segment that is active but slower‑moving, shaped more by buyer selectivity and longer marketing times than by rapid shifts in pricing. The wide vertical spread reflects the diversity of the upper market, where property characteristics vary substantially in size, age, and acreage. The mild softening observed in the luxury metrics aligns with what the scatter shows: a functioning but rate‑weighted segment where buyers are taking more time, negotiating more firmly, and concentrating their activity in the lower half of the luxury price band.
Sales Volume
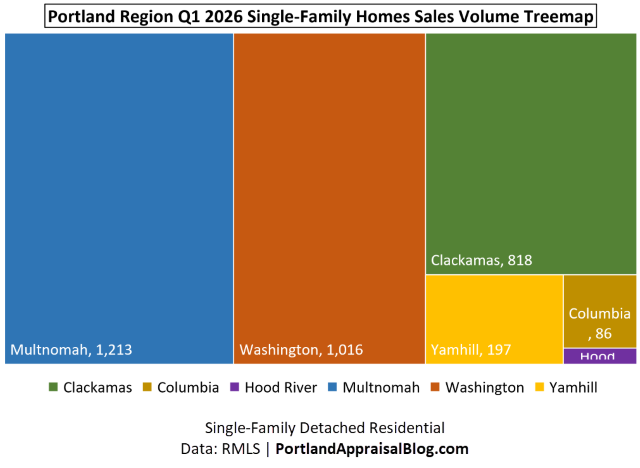
A treemap visualizing the distribution of detached single-family home sales by county in Q1 2026 clearly illustrates the market’s geographic concentration.
Sales volume remains heavily concentrated in the region’s Big Three counties—Multnomah, Washington, and Clackamas—which together account for 90.98% of all detached transactions. Multnomah leads with 36.22% of sales, followed by Washington at 30.34% and Clackamas at 24.43%, forming the structural core of regional activity. The remaining counties—Yamhill, Columbia, and Hood River—collectively contribute less than 10% of sales, and their smaller footprints are clearly visible in the treemap.
This distribution underscores how dependent the detached market is on the Big Three for both volume and trend formation. Regional pricing, tempo, and compositional shifts are shaped primarily by these counties, while the outlying markets play a supporting but comparatively limited role. The treemap also reinforces why segmentation by price tier is essential: even within this dominant tri‑county block, the mix of property types, lot sizes, and buyer profiles varies enough to influence the broader narrative when examined more closely.
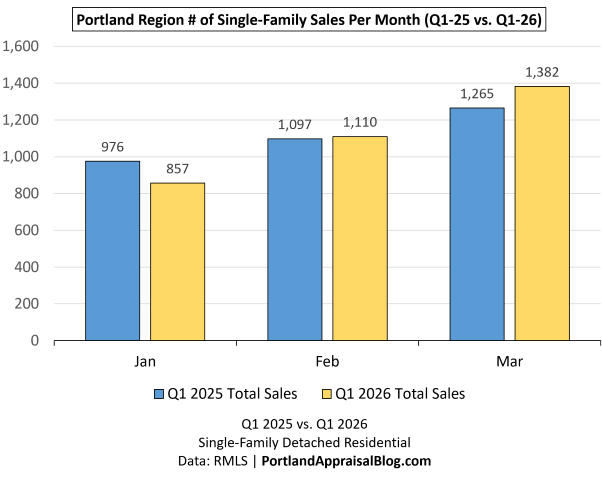
The bar chart below compares monthly sales volume across the three months of Q1 for 2025 and 2026.
Monthly activity varied between the two years, but total quarterly volume was nearly identical (3,338 vs. 3,349). January posted the largest difference, with 2026 starting slower (‑119 sales), while February and March both exceeded their 2025 counterparts. March in particular showed a notable lift, adding 117 more sales than the prior year and offsetting January’s deficit. The overall pattern reflects a market that remains active and steady despite rate pressure: timing shifted within the quarter, but the total number of homes changing hands was effectively unchanged. This reinforces the broader theme of Q1 2026—a functional, rate‑weighted market where buyer activity persists even as conditions evolve.
Sales Price
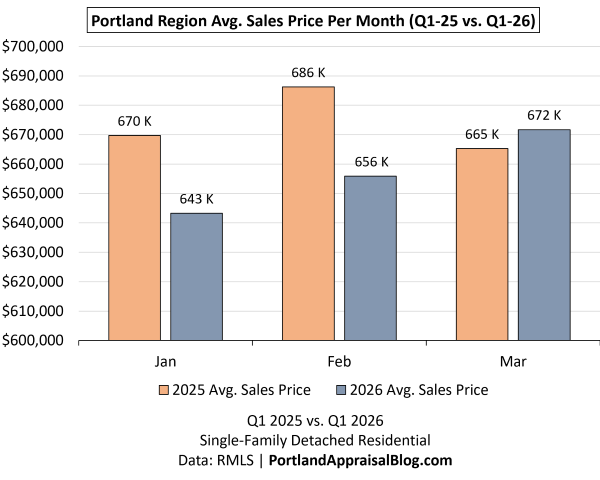
The bar chart below compares monthly average sales prices across the three months of Q1 for 2025 and 2026.
Note: The y-axis starts at $600,000 to allow better examination of monthly differences.
Average prices in January and February 2026 trailed their 2025 counterparts, down 3.9% and 4.4%, respectively. March posted a modest gain of 0.97%, but the improvement was not enough to offset the softer performance earlier in the quarter. The overall pattern reflects a market that began the year under mild price pressure before stabilizing toward the end of the quarter. This aligns with the broader Q1 narrative: steady sales volume, longer marketing times, and modest year‑over‑year softening shaped partly by composition and partly by rate‑driven buyer behavior.
New Construction
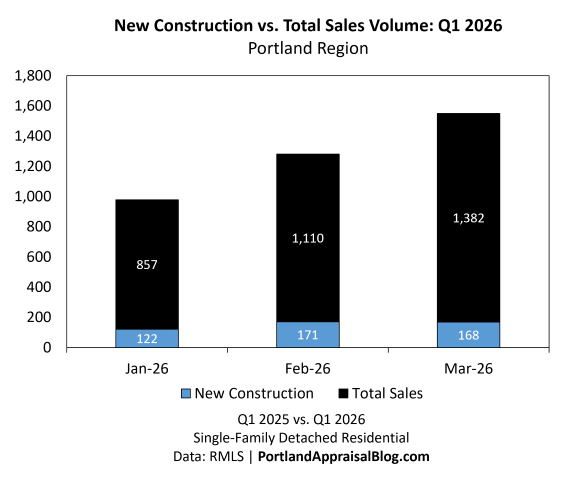
The bar graph below shows monthly total detached single-family sales in Q1 2026, with new construction volume nested within each bar to illustrate the portion of sales that were newly built.
New‑construction activity held remarkably steady throughout the quarter, ranging from 12% to 15% of monthly sales and totaling 461 closings, or 13.77% of all Q1 transactions. This consistency indicates that builders are delivering homes at a stable cadence and have adapted effectively to the higher‑rate environment. Even as resale activity fluctuated month to month, new‑construction volume remained a reliable contributor to overall supply, helping to support market stability and providing buyers with fresh inventory options across the region.
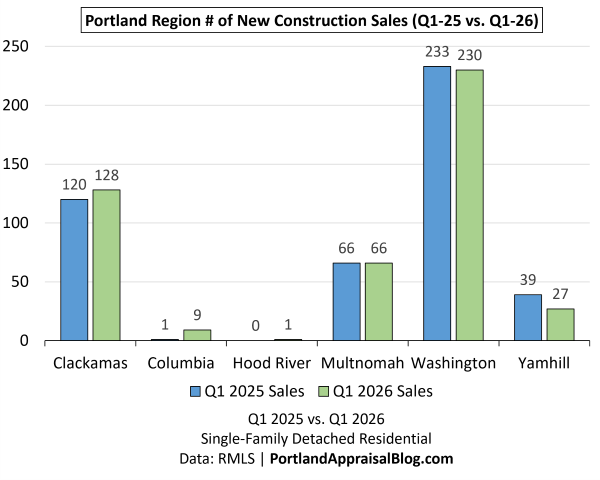
New‑construction activity in Q1 2026 landed almost exactly on par with the prior year—461 closings vs. 459, a difference of just two homes. This near‑perfect match is remarkable given the higher‑rate environment and reflects how effectively builders have adapted their pipelines, pricing, and product mix to current conditions.
At the county level, the distribution shifted modestly. Clackamas posted a small gain, Multnomah held perfectly steady, and Washington County—which continues to dominate the region’s new‑construction landscape—remained essentially unchanged with 230 closings, representing nearly half (49.89%) of all new‑construction sales. Smaller counties showed more volatility: Columbia saw a jump from 1 to 9 closings, Hood River recorded a single new‑construction sale, and Yamhill experienced a notable decline.
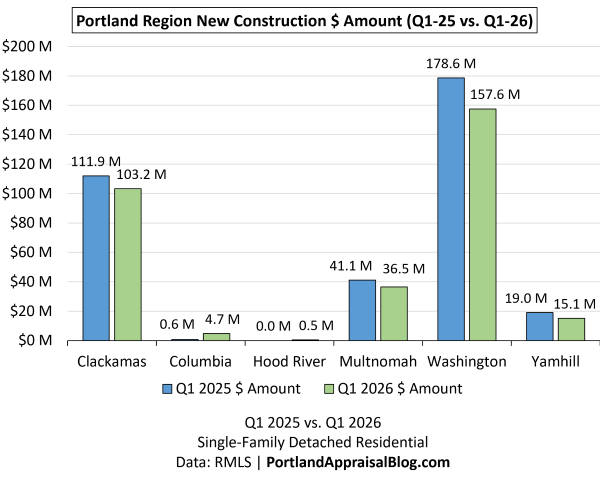
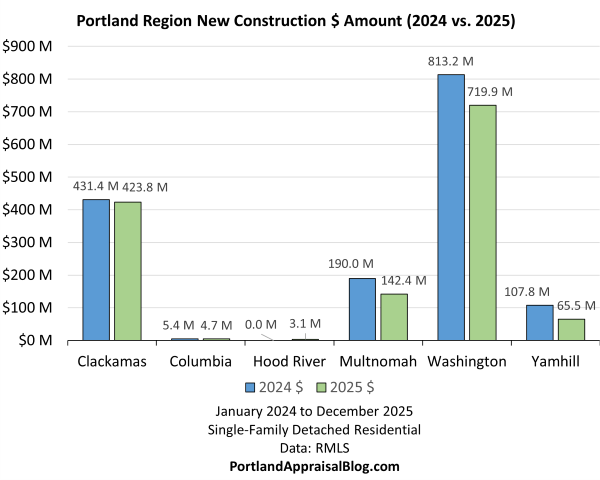
The dollar value of new construction closings provides additional context on builder activity and investment scale. The table below shows new construction sales volume by dollar amount for Q1 2026 compared with Q1 2025.
The following double bar chart provides the above information at a glance.
Even though the number of new‑construction closings in Q1 2026 nearly matched the prior year, total dollar volume declined by 9.61%. This reflects a meaningful shift in the mix of what builders delivered. The upper end of the market retreated this quarter, and because luxury new‑construction homes typically carry price points roughly double those of core‑market builds, the reduction in high‑value deliveries had an outsized impact on total dollars.
Washington County—still the region’s dominant new‑construction hub—saw an 11.79% decline in dollar volume despite only a slight dip in unit count. Clackamas and Multnomah posted similar declines, while Yamhill experienced a sharper drop. Smaller counties showed volatility in percentage terms, but their absolute dollar contributions remain minimal.
The overall pattern shows that builders maintained production levels but shifted toward more moderately priced offerings, resulting in a lower aggregate dollar footprint even as total units held steady. This aligns with the broader Q1 dynamic: the luxury segment softened, and that softness reflected directly in the new‑construction dollar totals.
Cumulative Days on Market
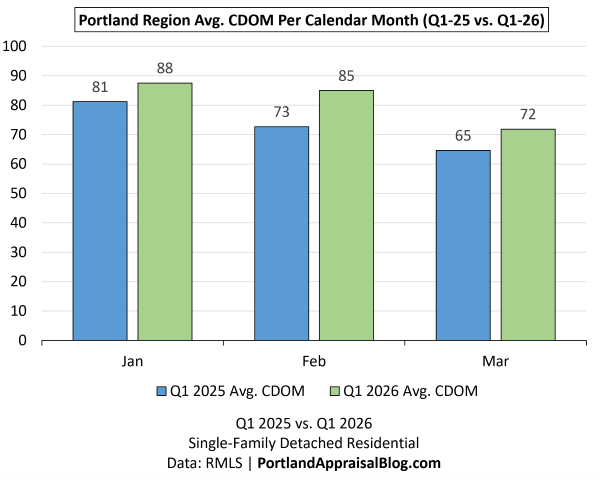
The bar chart below compares average cumulative days on market (CDOM) across the three months of Q1 for 2025 and 2026.
Marketing time increased across all three months, with January up 7.9%, February up 16.9%, and March up 11.2% compared with the prior year. The consistent rise reflects a market where buyers remain active but more deliberate, taking longer to commit as elevated rates continue to shape decision‑making. While sales volume held steady quarter over quarter, the longer exposure times indicate that sellers needed more patience in Q1 2026, and that homes generally required additional time to find the right match.
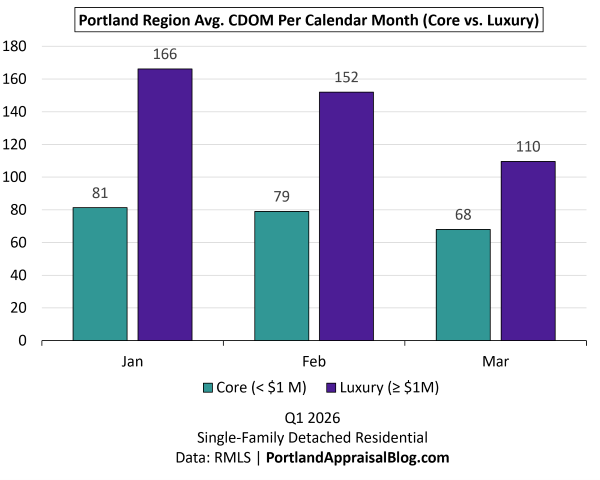
The bar chart below breaks out average CDOM by market segment for the three months of Q1 2026, comparing core (< $1M) and luxury (≥ $1M) properties.
Across all three months, luxury homes required substantially more time to sell, with differences ranging from 42 to 85 days. In January, the gap was widest—luxury listings averaged 166 days on market compared with 81 days for core‑market homes, a spread of nearly three months. February and March showed similar patterns, with luxury homes consistently taking 1.5 to 2.5 months longer to secure a buyer. This disparity reflects the natural dynamics of the upper market, where higher price points, specialized features, and a smaller buyer pool contribute to longer marketing times even in steady conditions.
HOA Dues
While HOA dues are not a defining feature of the detached‑home market, they are far from rare. More than a quarter of all detached sales in Q1 2026 were located in communities with mandatory dues.
Category
Q1 2025
Q1 2026
# of HOA Sales
860
879
Total Sales
3,338
3,349
% of Market
25.76%
26.25%
HOA dues count are sales reporting nonzero HOA dues. Single-Family Detached Residential | Q1 2025 & Q1 2026 Data: RMLS | PortlandAppraisalBlog.com
The share of detached homes with HOA dues edged slightly higher this year, rising to 26.25% of all sales. This reflects the continued prevalence of master‑planned communities, private streets, and shared‑amenity neighborhoods across the region—especially in newer suburban developments. While dues for detached homes are generally modest, they represent a persistent monthly expense for a meaningful portion of buyers and remain an important part of the carrying‑cost profile for these properties.
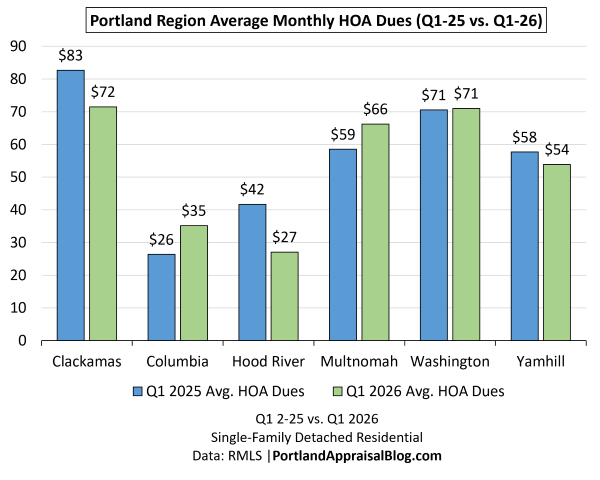
The bar chart below compares average monthly HOA dues (for reporting sales) for Q1 2025 and Q1 2026:
Average HOA dues for detached homes remained relatively modest across all counties, with most falling between $50 and $75 per month. Year‑over‑year changes were small and mixed: some counties saw slight decreases, while others posted mild increases. These shifts reflect normal variation in community‑level budgeting rather than any broad regional trend. Although detached‑home dues are a fraction of those seen in the attached and condominium segments, they remain a consistent monthly obligation for more than a quarter of buyers and continue to shape affordability at the margins.
Miscellaneous Statistics & Standout Transactions
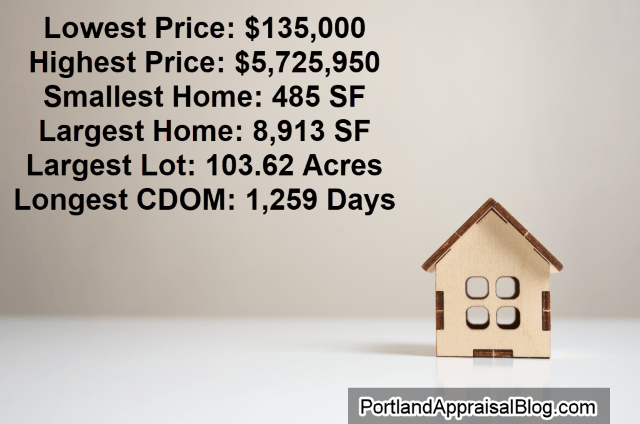
A few notable extremes and outliers from Q1 2026 illustrate the wide range of value drivers across the six-county region.
Lowest close price: $135,000—a 1963 fixer in Lafayette (Yamhill County). Not much information was given, but tax records show it was sold to an LLC, so the site may be redeveloped. Exterior photos of this property are currently available online.
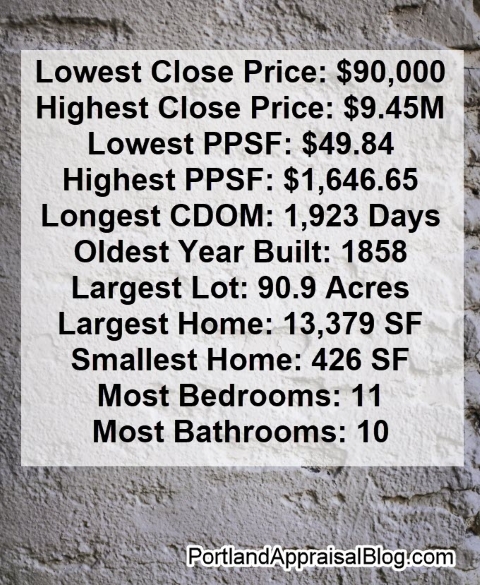
Highest close price: $5,725,950—a 1990 lakefront estate in Lake Oswego (Clackamas County). The custom-built residence features high-quality finishes, a swimming pool, and excellent views of the Lake. Photos of this property are currently available online.
Smallest Home: 485 sq. ft.—a 1946 cabin in Hood River County. The property was habitable at the time of sale. Given the two-acre lot, the cabin may be eventually demoted to an ADU and a larger residence built. Photos of this property are currently available online.
Largest Home: 8,913 sq. ft.—a 1999 estate home in Portland’s Forest Park neighborhood. The property is situated on a private, forested 10-acre lot and offers expansive rooms. Photos of this property are currently available online.
Largest Lot: 103.62 Acres—a 2008 custom home in Vernonia (Columbia County). The property is located along the Nehalem River and has a half mile of frontage. The property was used as an inn in the past. Photos of this property are currently available online.
Longest CDOM: 1,259 days—a $1.9M listing in Happy Valley (Clackamas County) that closed at $1.7M. The 2005 home is 7,070 sq. ft. and is located in a gated community. Photos of this property are currently available online.
These outliers demonstrate that detached single-family home ownership in the Portland Region can begin around $135,000 for buyers who are patient, flexible, and prepared to address condition or location factors. They stand in contrast to the region’s severely strained affordability.
With the regional aggregate trends, segment splits, monthly patterns, and notable outliers now in view, the remainder of this update turns to a county-level breakdown. The following sections present year-over-year comparisons for each of the six counties in the Portland Region—Multnomah, Washington, Clackamas, Yamhill, Columbia, and Hood River—ordered by Q1 2026 sales volume descending. Each county snapshot includes key metrics, commentary on local drivers, and any segment-specific observations that help explain broader regional patterns.
Multnomah County Q1 2026 Stats
The table below summarizes key metrics for Multnomah County detached single-family residential sales in Q1 2026 compared with Q1 2025.
Category
Q1 2025
Q1 2026
% Change
Total $ Volume
$756.1 Million
$740.9 Million
-2.02%
Average Price
$624,914
$610,761
-2.26%
Median Price
$540,000
$525,000
-2.78%
Avg SP/OLP
97.82%
97.57%
-0.25%
Avg PPSF (TSF)
$318.13
$313.92
-1.33%
Avg HOA Dues
$58.52
$66.21
+13.15%
Avg Lot Size (ac)
0.23
0.29
+28.18%
Avg Age (Yrs)
67.18
67.79
+0.91%
Avg CDOM
65.89
67.13
+1.88%
Avg Total SF
2,066
2,057
-0.44%
Total # of Sales
1,210
1,213
+0.25%
# of New Constr.
66
66
0.00%
# of REOs
9
21
+133.33%
# of Short Sales
6
6
0.00%
Average PABAI
79.45
90.77
+14.25%
HOA figures are for homes reporting nonzero dues. All other metrics use the full dataset. Single-Family Detached Residential | Q1 2025 & Q1 2026 Data: RMLS | PortlandAppraisalBlog.com
Multnomah County was one of the most stable submarkets in the region this quarter. Total sales were essentially unchanged (1,210 → 1,213), and average cumulative days on market held nearly flat (65.9 → 67.1 days). This is notable because the broader region saw a more pronounced slowdown in tempo; Multnomah’s size and liquidity helped keep marketing times steady even as rates remained elevated.
Prices softened modestly across all major measures. Average price (‑2.26%), median price (‑2.78%), and PPSF (‑1.33%) all moved in the same direction and by similar magnitudes, reflecting mild, rate‑weighted pressure rather than any structural shift in demand. The increase in average lot size (0.23 → 0.29 acres, +28%) appears to be a compositional change rather than a land‑value story, as it did not prevent prices from easing.
New construction held perfectly steady at 66 closings, a rare outcome among the counties and a sign of a stable, predictable supply pipeline. REOs increased from 9 to 21, but the absolute number remains very small—just 1.7% of all sales—so this does not indicate distress.
Affordability improved meaningfully. Multnomah’s PABAI rose from 75.13 to 90.77, a 14.2% gain, driven largely by slightly better mortgage rates and income growth.
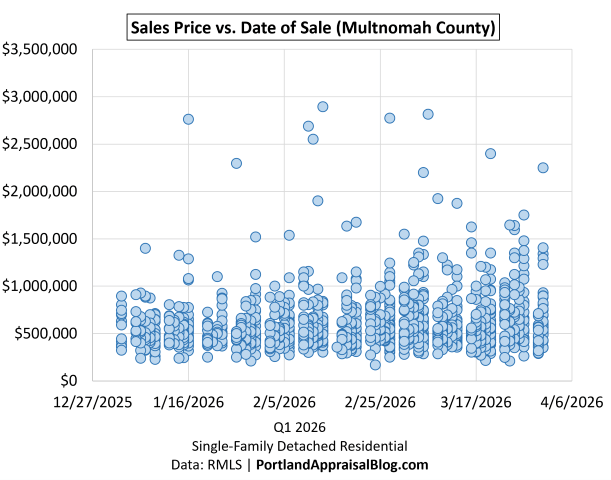
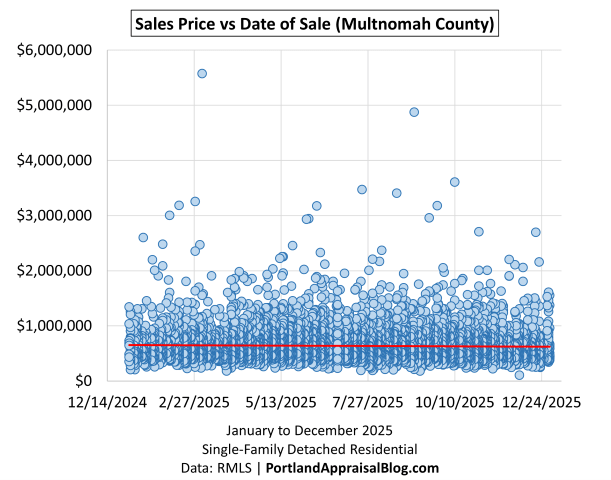
The scatter plot of all Multnomah County sales in Q1 2026 reinforces these themes:
Most sales cluster below $1 million, with a consistent spread across the quarter and only a small number of outliers above $2 million. There is no visible intra‑quarter trend or volatility spike—just a steady, well‑distributed flow of transactions. This visual stability mirrors the metrics: Multnomah continues to function as the region’s most liquid and predictable submarket, with steady demand, steady tempo, and only mild softening at the margins.
Washington County Q1 2026 Stats
The table below summarizes key metrics for Washington County detached single-family residential sales in Q1 2026 compared with Q1 2025.
Category
Q1 2025
Q1 2026
% Change
Total $ Volume
$697.4 Million
$665.7 Million
-4.55%
Average Price
$678,423
$655,226
-3.42%
Median Price
$638,950
$604,250
-5.43%
Avg SP/OLP
97.54%
96.86%
-0.70%
Avg PPSF (TSF)
$318.99
$307.81
-3.50%
Avg HOA Dues
$70.55
$70.98
+0.61%
Avg Lot Size (ac)
0.41
0.33
-19.46%
Avg Age (Yrs)
30.00
30.11
+0.34%
Avg CDOM
72.44
79.97
+10.39%
Avg Total SF
2,211
2,198
-0.58%
Total # of Sales
1,028
1,016
-1.17%
# of New Constr.
233
230
-1.29%
# of REOs
1
7
+600.00%
# of Short Sales
4
1
-75.00%
Average PABAI
69.92
81.73
+16.51%
HOA figures are for homes reporting nonzero dues. All other metrics use the full dataset. Single-Family Detached Residential | Q1 2025 & Q1 2026 Data: RMLS | PortlandAppraisalBlog.com
Washington County showed a mild but noticeable softening in Q1 2026, with most metrics drifting slightly lower while overall activity remained stable. Total sales dipped only marginally (1,028 → 1,016, ‑1.17%), but the county experienced a more meaningful increase in marketing time: CDOM rose from 72.4 to 80.0 days (+10.39%). This was a larger tempo shift than in Multnomah and reflects a market where buyers took longer to commit, particularly in the mid‑tier price ranges.
Prices declined across all major measures. Average price (‑3.42%), median price (‑5.43%), and PPSF (‑3.50%) all moved downward in a coordinated way, indicating broad, rate‑weighted softening rather than a compositional anomaly. The sharper decline in median price suggests that the lower and middle segments of the market felt more pressure—a pattern consistent with the employment uncertainty tied to Intel’s layoffs, which disproportionately affect Washington County’s buyer pool.
Average lot size decreased from 0.41 → 0.33 acres (‑19.46%), which contributed to the price movement but does not fully explain it. Most other structural metrics—home size, age, HOA dues, and new‑construction volume—were essentially unchanged. New construction in particular held steady (233 → 230), reinforcing Washington County’s role as the region’s largest and most consistent builder hub.
Affordability improved meaningfully. Washington’s PABAI rose from 69.92 to 81.73, a 16.9% increase, driven by slightly better mortgage rates and income growth. Even so, the county remains less affordable than the regional average (85.45), reflecting its higher baseline pricing and strong demand for newer suburban housing.
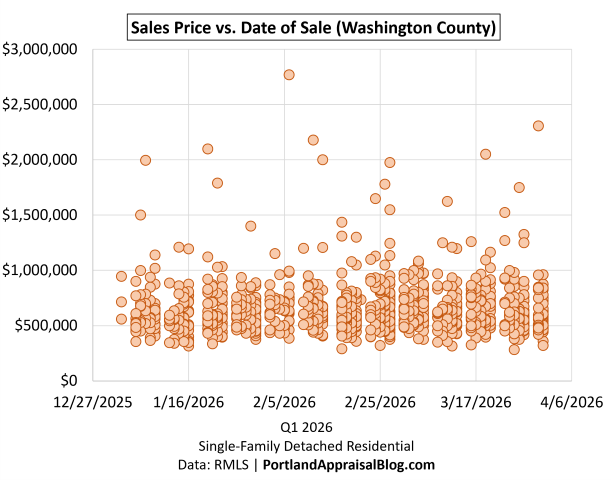
The scatter plot reinforces these themes: a dense cluster of sales between $500k and $900k, a thinner upper tier, and a handful of outliers above $1.5M. There is no visible intra‑quarter trend—just steady, slightly slower activity. Overall, Washington County remained functional and active, but with softer pricing and a more deliberate buyer pace than last year.
The following is a scatter plot of all Washington County sales in Q1 2026:
The scatter plot reveals a dense cluster of sales between $500k and $900k, a thinner upper tier, and a handful of outliers above $1.5M. There is no visible intra‑quarter trend—just steady, slightly slower activity. Overall, Washington County remained functional and active, but with softer pricing and a more deliberate buyer pace than last year.
Clackamas County Q1 2026 Stats
The table below summarizes key metrics for Clackamas County detached single-family residential sales in Q1 2026 compared with Q1 2025.
Category
Q1 2025
Q1 2026
% Change
Total $ Volume
$607.5 Million
$620.5 Million
+2.13%
Average Price
$796,232
$758,529
-4.74%
Median Price
$644,000
$637,283
-1.04%
Avg SP/OLP
96.64%
96.51%
-0.13%
Avg PPSF (TSF)
$331.32
$331.56
+0.07%
Avg HOA Dues
$82.72
$71.50
-13.56%
Avg Lot Size (ac)
1.05
0.91
-14.12%
Avg Age (Yrs)
36.99
36.64
-0.97%
Avg CDOM
73.29
94.03
+28.29%
Avg Total SF
2,400
2,358
-1.71%
Total # of Sales
763
818
+7.21%
# of New Constr.
120
128
+6.67%
# of REOs
4
8
+100.00%
# of Short Sales
1
3
+200.00%
Average PABAI
68.00
77.03
+12.91%
HOA figures are for homes reporting nonzero dues. All other metrics use the full dataset. Single-Family Detached Residential | Q1 2025 & Q1 2026 Data: RMLS | PortlandAppraisalBlog.com
Clackamas County was one of the few counties to post an increase in total dollar volume this quarter, rising 2.13% year over year. This wasn’t driven by higher prices—average and median prices both dipped—but rather by more sales overall (763 → 818, +7.21%). Clackamas was one of the most active counties in Q1, and that higher transaction count helped offset modest price softening.
Prices declined in a way that clearly reflects compositional changes rather than value erosion. Average price fell 4.74%, but PPSF held almost perfectly flat ($331.32 → $331.56, +0.07%). At the same time, both average home size (‑1.71%) and average lot size (‑14.12%) decreased. This combination tells a consistent story: the mix shifted toward smaller homes on smaller parcels, pulling down the averages even as underlying price per square foot remained stable.
Marketing time increased sharply. Average CDOM rose from 73.3 to 94.0 days (+28.29%), one of the largest tempo shifts in the region. Buyers were more deliberate, and sellers needed more patience—especially in the upper‑end segments, which tend to be more sensitive to rate conditions and seasonal timing.
New construction increased (120 → 128, +6.67%), reinforcing Clackamas County’s role as a growth corridor with steady builder activity. REOs and short sales rose in percentage terms but remain extremely small in absolute numbers and do not indicate distress.
Affordability improved but remains strained. Clackamas’ PABAI rose from 68.00 to 77.03 (+13.3%), yet the county remains one of the least affordable in the region, driven in part by the presence of high‑value submarkets such as Lake Oswego and West Linn. One important feature of the PABAI is that it’s not strongly influenced by outliers. Since the index averages affordability ratios across every sale—not just a median price—high‑end transactions have only a muted effect on the final number. This makes county‑to‑county comparisons more stable and meaningful.
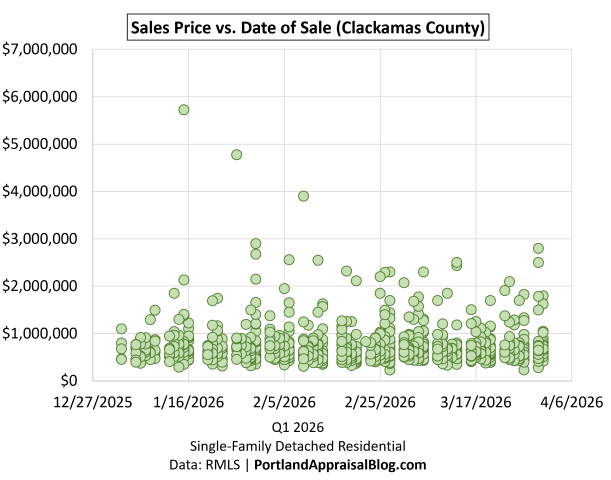
The following is a scatter plot of all Clackamas County sales in Q1 2026:
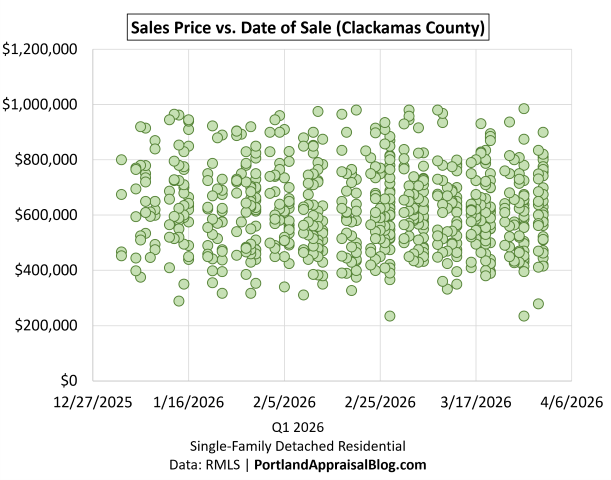
The following scatter plot zooms in on sales below $1,000,000:
The scatter plots reinforce these themes. Most sales cluster below $1M, with a healthy mid‑range and a handful of very high‑end outliers extending above $5M. There is no visible intra‑quarter trend—just steady activity across a wide price spectrum. The visual spread mirrors the metrics: active and stable, with price softening driven primarily by mix rather than market weakness.
Yamhill County Q1 2026 Stats
The table below summarizes key metrics for Yamhill County detached single-family residential sales in Q1 2026 compared with Q1 2025.
Category
Q1 2025
Q1 2026
% Change
Total $ Volume
$127.4 Million
$120.4 Million
-5.47%
Average Price
$571,125
$611,154
+7.01%
Median Price
$485,000
$499,500
+2.99%
Avg SP/OLP
97.43%
95.07%
-2.42%
Avg PPSF (TSF)
$312.30
$311.90
-0.13%
Avg HOA Dues
$56.43
$52.70
-6.61%
Avg Lot Size (ac)
1.62
2.22
+36.85%
Avg Age (Yrs)
36.09
36.83
+2.04%
Avg CDOM
84.09
100.55
+19.57%
Avg Total SF
1,866
1,956
+4.82%
Total # of Sales
223
197
-11.66%
# of New Constr.
39
27
-30.77%
# of REOs
1
1
0.00%
# of Short Sales
0
3
—
Average PABAI
91.58
99.08
+7.85%
HOA figures are for homes reporting nonzero dues. All other metrics use the full dataset. Single-Family Detached Residential | Q1 2025 & Q1 2026 Data: RMLS | PortlandAppraisalBlog.com
Yamhill County experienced one of the sharper slowdowns in sales activity this quarter. Total transactions fell from 223 → 197 (‑11.66%), which in turn pulled total dollar volume down 5.47%. Yet despite fewer sales, both average and median prices increased—a signal that the mix shifted toward larger, higher‑acreage properties rather than broad‑based appreciation.
That mix shift is visible in the structural metrics. Average lot size rose dramatically (1.62 → 2.22 acres, +36.85%), and average home size increased as well (1,866 → 1,956 SF, +4.82%). PPSF, however, remained essentially unchanged (‑0.13%), confirming that underlying values were stable and that the higher averages were driven by the types of homes selling, not by rising prices across the board.
Marketing time lengthened meaningfully. Average CDOM climbed from 84.1 to 100.6 days (+19.57%), crossing the 100‑day threshold and signaling a slower, more deliberate market. This is typical for rural counties with a wide range of property types and a thinner buyer pool, especially when larger acreage properties dominate the quarter’s activity.
New construction declined sharply (39 → 27, ‑30.77%), one of the steepest drops in the region. This reflects fewer subdivision deliveries and a shift toward resale activity on larger parcels. REOs and short sales remain negligible in number and do not indicate distress.
Affordability improved modestly. Yamhill’s PABAI rose from 91.58 to 99.08 (+8.19%), placing it among the more affordable counties in the region—well above the regional average (85.45). This aligns with its lower baseline pricing and rural character, even as larger properties influenced this quarter’s mix.
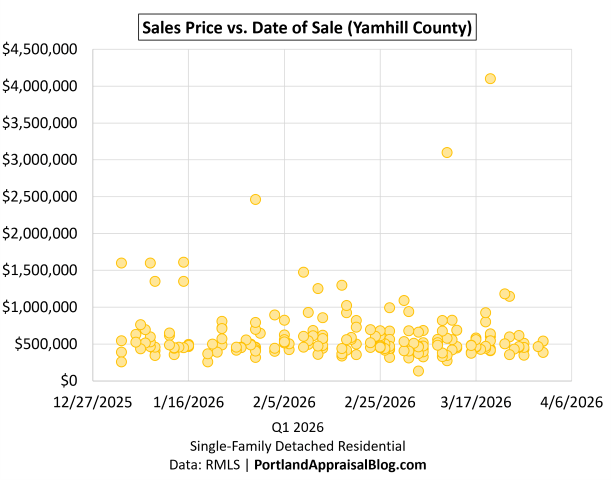
The following is a scatter plot of all Yamhill County sales in Q1 2026:
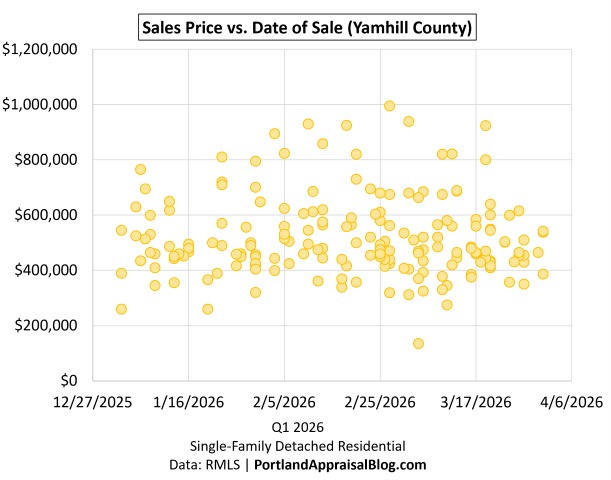
The following scatter plot zooms in on sales below $1,000,000:
Most sales cluster below $1M, with a handful of high‑end outliers reaching into the multi‑million‑dollar range. The distribution is wide, typical of a rural county with diverse housing stock. Overall, Yamhill’s Q1 performance reflects fewer sales, larger properties, stable underlying values, and a slower market tempo.
Columbia County Q1 2026 Stats
The table below summarizes key metrics for Columbia County detached single-family residential sales in Q1 2026 compared with Q1 2025.
Category
Q1 2025
Q1 2026
% Change
Total $ Volume
$48.48 Million
$44.83 Million
-7.52%
Average Price
$484,812
$521,336
+7.53%
Median Price
$468,500
$471,350
+0.61%
Avg SP/OLP
95.43%
96.11%
+0.71%
Avg PPSF (TSF)
$278.74
$275.14
-1.29%
Avg HOA Dues
$26.37
$35.20
+33.46%
Avg Lot Size (ac)
2.09
3.54
+69.41%
Avg Age (Yrs)
47.34
39.91
-15.70%
Avg CDOM
96.56
81.29
-15.81%
Avg Total SF
1,880
1,952
+3.79%
Total # of Sales
100
86
-14.00%
# of New Constr.
1
9
+800.00%
# of REOs
1
2
+100.00%
# of Short Sales
0
1
—
Average PABAI
98.24
106.66
+8.57%
HOA figures are for homes reporting nonzero dues. All other metrics use the full dataset. Single-Family Detached Residential | Q1 2025 & Q1 2026 Data: RMLS | PortlandAppraisalBlog.com
Columbia County remains the smallest and most variable market in the region, and that scale is essential context when interpreting quarterly changes. Total sales fell from 100 → 86 (‑14%), which alone explains the decline in total dollar volume (‑7.52%). With so few transactions, even modest shifts in the types of homes selling can move averages more than in the larger counties.
That mix shift is clearly visible this quarter. Average lot size increased dramatically (2.09 → 3.54 acres, +69.41%), and average home size rose as well (1,880 → 1,952 SF, +3.79%). These structural changes helped lift the average sale price by 7.53%, even though PPSF declined slightly (‑1.29%) and median price barely moved (+0.61%). This is a textbook example of how acreage‑heavy quarters can buoy averages without indicating broad appreciation.
Interestingly, Columbia was one of the few counties where marketing time improved. Average CDOM fell from 96.6 to 81.3 days (‑15.81%), suggesting that the buyers who were active in Q1 were decisive, even as overall activity thinned. The county also saw a notable increase in new construction closings (1 → 9), though the absolute numbers remain too small to draw structural conclusions.
Affordability remains Columbia County’s defining characteristic. Its PABAI rose from 98.24 to 106.66, making it the most affordable county in the region by a wide margin and the only one with a PABAI above 100. This reflects its lower baseline pricing, rural character, and the relative absence of high‑cost submarkets.
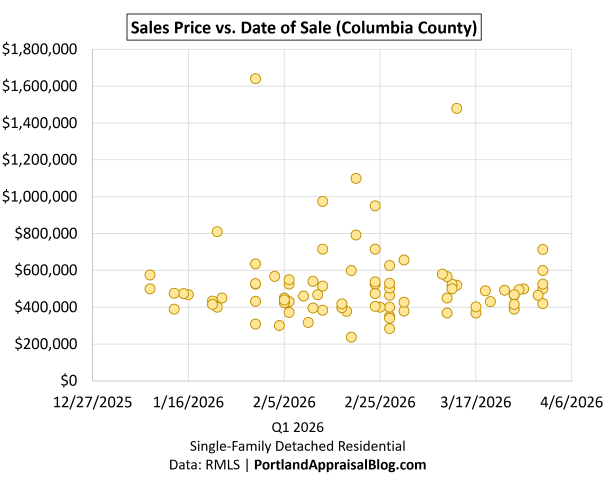
The following is a scatter plot of all Columbia County sales in Q1 2026:
The scatter plot reinforces the small‑market dynamics. Most sales cluster below $600k, with a handful of outliers extending upward. The distribution is wide but thin, typical of a rural county with diverse property types and limited transaction volume. Overall, Columbia’s Q1 performance reflects fewer sales, larger properties, stable underlying values, and the strongest affordability profile in the region.
Hood River County Q1 2026 Stats
The table below summarizes key metrics for Hood River County detached single-family residential sales in Q1 2026 compared with Q1 2025.
Category
Q1 2025
Q1 2026
% Change
Total $ Volume
$11.06 Million
$15.38 Million
39.03%
Average Price
$790,029
$809,316
2.44%
Median Price
$654,200
$745,000
13.88%
Avg SP/OLP
93.64%
92.61%
-1.11%
Avg PPSF (TSF)
$420.77
$480.64
14.23%
Avg HOA Dues
$41.66
$27.08
-35.00%
Avg Lot Size (ac)
1.85
1.12
-39.43%
Avg Age (Yrs)
62.36
35
-43.87%
Avg CDOM
153.86
120.11
-21.94%
Avg Total SF
1,959
1,928
-1.62%
Total # of Sales
14
19
35.71%
# of New Constr.
0
1
—
# of REOs
0
1
—
# of Short Sales
0
0
—
HOA figures are for homes reporting nonzero dues. All other metrics use the full dataset. Single-Family Detached Residential | Q1 2025 & Q1 2026 Data: RMLS | PortlandAppraisalBlog.com
Hood River County is by far the smallest market in the region, and that scale shapes how its quarterly metrics should be interpreted. With only 19 sales this quarter, even a handful of transactions can meaningfully shift averages. For that reason, the most appropriate approach here is to report the changes rather than infer broad trends.
Total sales increased from 14 → 19 (+35.71%), and total dollar volume rose proportionally (+39.03%). Average and median prices both increased—average price by 2.44% and median price by 13.88%—but these movements reflect the specific mix of homes that sold rather than market‑wide appreciation. The structural metrics confirm this: homes sold this quarter were younger on average (62.4 → 35.0 years, ‑43.87%) and sat on much smaller lots (1.85 → 1.12 acres, ‑39.43%). These shifts alone can easily move median and average prices in a small dataset.
Price per square foot increased ($420.77 → $480.64, +14.23%), but again, with so few sales, this reflects the characteristics of individual properties rather than a reliable directional signal. Average home size was nearly unchanged (‑1.62%), reinforcing that PPSF is being influenced by the composition of the sales rather than broad pricing pressure.
Marketing time improved meaningfully. Average CDOM fell from 153.9 to 120.1 days (‑21.94%), though both figures remain high relative to the metro counties. This is typical for a small, rural, and lifestyle‑driven market where unique properties take longer to match with the right buyer.
PABAI is not reported for this county due to not meeting the sales threshold. The index is most reliable in segments with at least 20–30 transactions, and Hood River’s small sample size means PABAI is generally more meaningful for this county on a semi‑annual or annual basis.
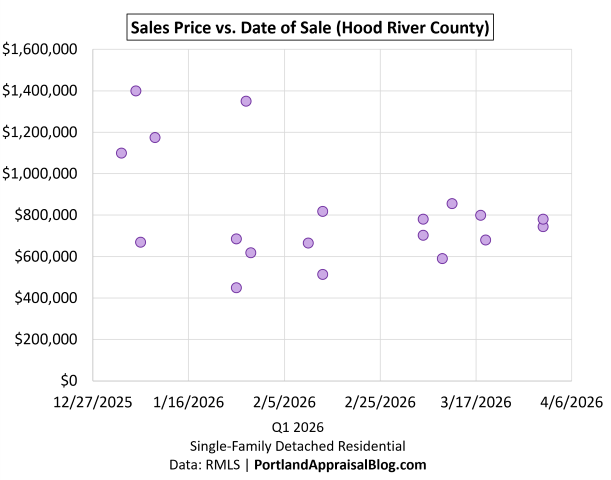
The following is a scatter plot of all Hood River County sales in Q1 2026:
The scatter plot reinforces the small‑sample dynamics. Prices vary widely from sale to sale, with a handful of higher‑priced transactions early in the quarter and a cluster of mid‑range sales later on. There is no meaningful intra‑quarter trend—just the natural variability of a market with very few transactions.
Closing Thoughts
Taken together, the first quarter of 2026 reads as a softer, more composition‑driven period for the Portland region. Most counties posted lower dollar volume than last year, and even where prices held steady, the underlying story often came down to the types of homes that sold rather than broad market movement. Smaller homes and smaller lots were more common in several counties, while others saw the opposite—larger rural properties that lifted averages despite thinner activity. Across the board, the data shows a market that is functioning, but not accelerating.
The core and luxury segments reinforced this pattern. The sub‑$1M market slipped modestly, shaped largely by mix and by buyers who remained price‑sensitive despite slightly better mortgage rates. The luxury market, meanwhile, saw a sharper pullback, driven in large part by a steep decline in new construction closings. With fewer high‑end builds delivering, luxury volume contracted and marketing times lengthened, underscoring how sensitive the upper tier remains to both rates and inventory cycles.
Affordability improved across all counties, but not enough to materially change behavior. Buyers were active but deliberate, sellers needed more patience, and the region continued to operate in a narrow band between stability and constraint. Q1 wasn’t a dramatic quarter—just a quieter one, shaped by rate‑sensitivity, local variation, and the ongoing influence of what sells in any given slice of time. As we move into the spring and summer markets, the question is less about momentum and more about whether mortgage rates will continue to weigh upon the market.
What trends do you expect to see in Q2 2026? I’d love to hear your thoughts—feel free to reply here or reach out directly.
Sources & Further Reading
All data presented in this quarterly update is sourced directly from RMLS and has been subjected to our rigorous cleaning and validation process to ensure reliability for detached single-family residential analysis in the six-county Portland Region. The trends, comparisons, and commentary are the result of original appraisal expertise and independent analysis—not aggregated from secondary sources or news summaries.
External Obsolescence in Hillsboro — Residential Market Response to Intel’s 2024–2025 Workforce Reductions: Portland Appraisal Blog
Coda
Thanks for reading—I hope you found a useful insight or an unexpected nugget along the way. If you enjoyed the post, please consider subscribing for future updates.
Are you an agent in Portland who wonders why appraisers always do “x”?
A homeowner with questions about appraiser methodology?
If so, feel free to reach out—I enjoy connecting with market participants across Portland and the surrounding counties, and am always happy to help where I can.
And if you’re in need of appraisal services in Portland or anywhere in the Portland Region, we’d be glad to assist.
About the Author — Abdur Abdul‑Malik, SRA, ASA
Abdur Abdul‑Malik is the founder, author, and publisher of the Portland Appraisal Blog, where he produces original regional and neighborhood‑level housing analytics for the Portland Region. He is a certified residential appraiser serving Oregon and Washington, drawing on RMLS transaction data, public records, and custom segmentation models he has built.
He developed the Portland Appraisal Blog Affordability Index (PABAI), a payment‑based affordability metric built from actual RMLS sales. PABAI incorporates weekly updates based on the prevailing 30‑year fixed mortgage rate, providing a locally grounded measure of housing affordability across the region.
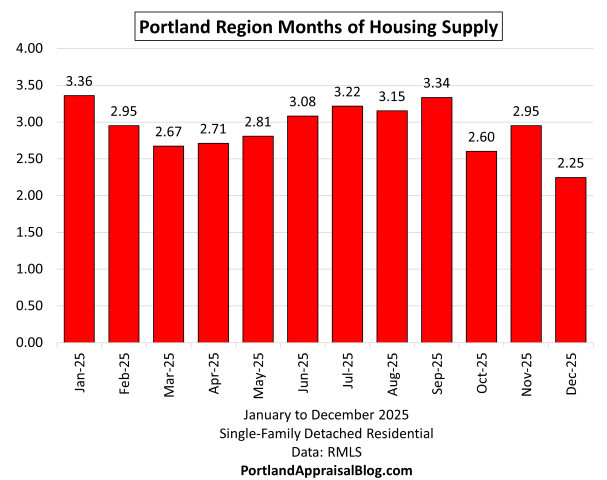
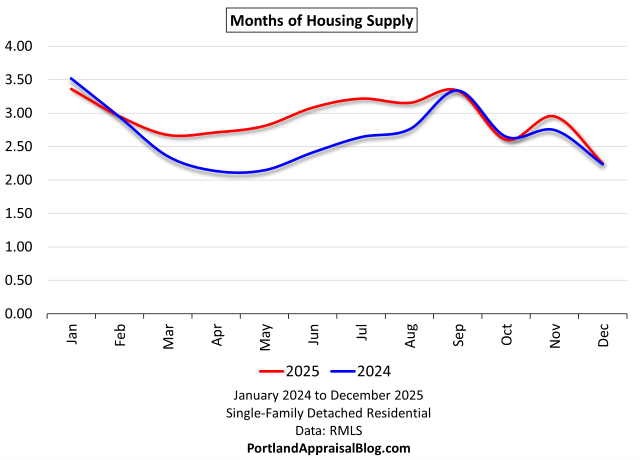
The Portland Region detached homes market recorded 17,083 sales in 2025. Overall, the market remained stable—modest gains in volume (+2.11%) and prices (+0.84% median to $599,990) amid longer CDOM (+11.09% to 59.15 days) and reduced new construction (-11.86%). Tight supply (~2.9 months) supported price resilience in a selective, balanced environment.
Portland White Stag sign with trees in autumn colors. Via Canva Pro
The Portland Region’s detached single-family home market in 2025 remained in a state of equilibrium—a continuation of the balanced conditions observed throughout the quarterly updates. After the sharp rate-driven shifts of 2022–2023, the region has settled into a new normal: modest growth, increased buyer selectivity, and persistent supply constraints. Prices held firm with slight upward movement, transaction volume grew incrementally, and marketing times lengthened as buyers became more deliberate in a still-elevated borrowing environment.
This stability was not uniform across segments or submarkets. Core properties continued to drive the majority of activity, while luxury showed resilience in select pockets. New construction retreated further, pushing the average home age older and reinforcing resale dominance. Months of supply stayed tight, supporting price levels without dramatic volatility.
The following sections provide a regional overview, segment breakdown, monthly trends, and detailed county-level statistics.
The Portland Region in this review comprises the six Oregon counties of Columbia, Clackamas, Hood River, Multnomah, Washington, and Yamhill. These counties form a contiguous housing ecosystem centered on Portland—Multnomah as the core home county, with the others tightly integrated through commuting patterns, economic ties, and shared market dynamics (e.g., Yamhill’s strong connection via Highway 99W and wine-country adjacency). Beyond Yamhill, the MLS system changes, further distinguishing this six-county area from broader geographic aggregations. For a detailed overview—including county profiles, population data, key value influencers, and why this definition differs from the official seven-county Portland–Vancouver–Hillsboro MSA—see my dedicated page: The Portland Region – Six-County Market Area Overview.
All data is sourced from RMLS and reflects open-market detached single-family residential sales (excluding condos, attached homes, manufactured homes on leased land, and multifamily). SNL (“Sold Not Listed”) entries—off-market transactions entered retroactively—have been excluded to preserve consistency with true market activity.
All figures have undergone my standard cleaning process to address common RMLS accuracy challenges, including misclassifications (e.g., condos listed as detached), square footage/price typos, incomplete fields, status/date mismatches, and non-representative entries. For a detailed overview of these issues, their impact on market analysis, and how I mitigate them through automated flagging, cross-verification, and manual review, see the dedicated page: RMLS Data Accuracy Challenges.
Important note for the 2025 annual review: I published quarterly updates for each quarter of 2025, and sharp readers may notice that the total sales count here exceeds the sum of the four quarterly figures. This occurs because some agents delay updating records for months after closing. A recent comprehensive check of all non-close-sale data uncovered additional stragglers that were not captured in the quarterly snapshots. As a result, this full-year aggregation provides the most complete and accurate picture of 2025 detached home activity in the region.
Portland Region 2025 Overview
The Portland Region’s detached single-family home market in 2025 remained in a state of equilibrium—modest gains across key metrics despite increased buyer selectivity and a continued retreat in new construction.
Overall Regional Trends
The table below summarizes key metrics for detached single-family residential sales in the Portland Region (Columbia, Clackamas, Hood River, Multnomah, Washington, and Yamhill counties) for all of 2025 compared with 2024.
The 2025 full-year metrics reinforce the theme of stability that defined the quarterly updates—modest gains in volume and prices occurred within a market that remained balanced rather than shifting dramatically in any direction.
Modest overall growth with compositional support: Total sales volume rose +2.11% to $11.7 billion on +1.25% more transactions (17,083 closings). Median and average close prices advanced +0.84% each—to $599,990 and $682,557—while average PPSF edged +0.21% to $321.05 despite homes becoming slightly larger (+1.04% to 2,203 SF). Normally, larger average sizes exert downward pressure on PPSF; the fact that PPSF held positive suggests underlying value support through quality or compositional shifts in the sold inventory.
Aging inventory and reduced new construction: Average home age increased +12.84% to 48.52 years, driven primarily by a -11.86% decline in new construction closings (1,858 vs 2,108 in 2024). This shift skewed the transaction mix toward older existing stock, limiting fresh supply and reinforcing resale dominance.
Increased buyer selectivity: Average cumulative days on market lengthened +11.09% to 59.15 days—a clear sign of greater deliberation and caution. Even as mortgage rates eased gradually through 2025 (from early highs near 7.0% to year-end levels around 6.1–6.2%), rates remained elevated relative to historical norms and sustained the lock-in effect for many homeowners. Buyers took more time to decide, compare, and negotiate, contributing to the modest dip in SP/OLP ratio to 97.24% (-0.69%).
Tight supply conditions: Months of supply averaged approximately 2.9 months—well below the traditional 4–6 month benchmark for balance. This continued tightness supported price resilience and prevented broader volatility, even as selectivity rose.
The gradual downward trend in weekly 30-year fixed mortgage rates throughout 2025—from early-year highs near 7.0% to year-end levels around 6.1–6.2%—provided some affordability relief compared to 2024. However, rates remained elevated relative to recent historical norms and continued to contribute to buyer caution, as evidenced by the increase in average cumulative days on market.
Portland Region Scatter Plots
To visualize the distribution of individual sale prices across 2025, the following scatter plots show sales price against date of sale. The first graph displays the full range of transactions, while the second focuses on the $0–$2M range. In both, the red line represents a fitted trendline across all transactions.
The full-range scatter illustrates the complete distribution of detached single-family home sales prices in the Portland Region for 2025. The majority of transactions cluster in the lower bands, with occasional high-end outliers extending up to $10M+. The fitted trendline shows no clear upward or downward direction, reinforcing the year’s price stability.
The zoomed view focuses on the $0–$2M range, revealing a dense “wall” of sales below approximately $1.3M–$1.5M throughout the year. Density thins noticeably above that level, highlighting the core market’s dominance in transaction volume while higher-price sales remain comparatively sparse and scattered. This pattern aligns with the broader stability theme: modest gains supported by compositional factors rather than broad appreciation.
Bottom-line Summary
The 2025 Portland Region detached single-family home market delivered a year of continued equilibrium—modest gains in volume and prices persisted within a balanced, non-volatile environment. While cumulative days on market lengthened and new construction retreated, the overall picture remained one of stability three years after the rapid mortgage rate rise. Supply stayed tight, buyer selectivity increased modestly, and prices held firm with slight upward movement, reflecting a market that has settled into a sustainable new normal.
Core Market (< $1M)
The core market—homes under $1 million—continued to anchor the majority of activity in the Portland Region during 2025, driving most of the transaction volume while showing modest resilience amid broader selectivity. This segment remained the primary engine of market movement, with buyers in this price range facing affordability constraints yet benefiting from greater availability of inventory compared to the luxury tier.
The following table compares core market metrics (< $1M) in 2025 with 2024:
The core market—homes under $1 million—continued to anchor the majority of activity in the Portland Region during 2025, accounting for 90.18% of total sales count and 78.84% of dollar volume. This segment drove the bulk of transaction movement while demonstrating modest resilience amid broader selectivity pressures. Transaction volume grew slightly (+0.96% to 15,406 sales), and dollar volume advanced +1.71% to $9.19 billion. Median and average close prices rose +0.78% and +0.74% respectively—to $575,000 and $596,742—with average PPSF edging +0.35% to $312.93 despite a modest increase in average home size (+0.91% to 2,026 SF).
The core segment experienced more pronounced lengthening of marketing times than the region overall, with average cumulative days on market rising +13.02% to 56.50 days. This reflects heightened buyer caution in the more rate-sensitive price range, though sellers conceded only modestly more ground (SP/OLP ratio 97.47%, down -0.69%). New construction in core declined -10.82% to 1,698 closings, contributing to an older average age (+5.48% to 48.93 years) and further emphasizing resale dominance. Notably, average lot size in core increased +10.06% to 0.46 acres—a compositional shift that likely supported the modest PPSF gain by adding value through additional land.
Overall, the core market remained the foundation of regional activity in 2025, absorbing the majority of demand while navigating increased selectivity and reduced fresh supply. Its performance—modest gains in volume and prices with firmer PPSF resilience—helped maintain the year’s broader equilibrium.
Luxury Market (≥ $1M)
The luxury segment—homes priced at $1 million and above—represented a smaller but resilient portion of the Portland Region’s 2025 detached single-family market. While core properties drove the majority of transaction volume, luxury homes showed greater stability in certain metrics, particularly time on market, amid a year of overall equilibrium. This segment benefited from buyers who were often less rate-sensitive and more decisive when the right property aligned with their preferences.
The following table compares luxury market metrics (≥ $1M) in 2025 with 2024:
Luxury homes accounted for 9.82% of total sales count and 21.16% of dollar volume in 2025, with transaction count rising +4.03% to 1,677 and dollar volume advancing +3.63% to $2.47 billion. Median and average close prices softened slightly—down -0.37% to $1,255,000 and -0.39% to $1,470,905—while average PPSF declined -1.37% to $395.59.
Average cumulative days on market showed resilience, dipping -0.63% to 83.47 days, in contrast to the core segment’s more pronounced lengthening (+13.02% to 56.50 days). This suggests that well-positioned high-end homes are still finding buyers efficiently, and emphasizes the need to price homes realistically.
New construction in luxury fell more sharply (-21.57% to 160 closings), contributing to a shift toward resale dominance within the segment.
Average lot size decreased -17.16% to 2.33 acres, though this may reflect a compositional move toward smaller urban or estate parcels rather than a broad trend.
Overall, the luxury market demonstrated relative strength in marketing time and modest dollar-volume growth, even as per-unit metrics softened. This resilience—particularly in time on market—helped balance the year’s broader selectivity, with luxury buyers remaining committed when the right property appeared.
Sales Volume
Washington, Clackamas, and Multnomah counties together accounted for nearly 91% of the region’s detached single-family sales in 2025, underscoring their central role in overall market activity. The following treemap visualizes the distribution by county, sized by sales count:
Multnomah led with 6,459 sales (37.81% of regional total), followed by Washington (5,046 sales, 29.54%) and Clackamas (3,986 sales, 23.33%). Yamhill contributed 964 sales (5.64%), Columbia 487 sales (2.85%), and Hood River 141 sales (0.83%). This geographic concentration remained highly consistent with 2024—the top three counties held ~90.68% of sales in 2025 compared to ~90.26% the prior year—reflecting the region’s enduring urban and suburban dominance.
The modest year-over-year shifts in county shares (e.g., Multnomah up slightly to 37.81%, Washington down to 29.54%, Clackamas essentially flat) further illustrate the stability that characterized 2025. Smaller counties showed greater percentage volatility due to lower base volumes, but the overall distribution reinforced a balanced market without significant reallocation of activity.
Monthly sales counts in 2025 followed a classic seasonal pattern typical of the Portland Region—lower activity in winter, a ramp-up through spring, peak momentum in late spring and early summer, a modest dip in early fall, and a surprising late-year rebound. The following bar chart shows total detached single-family sales by month for 2025:
The chart reveals the expected seasonality: weakest in January and February, building steadily to a spring peak in May and then gradually declining until October (1,686—the year’s highest month) before tapering in November and December. This late-year strength in October and December helped offset softer mid-spring and summer months compared to 2024, contributing to the modest annual increase in total closings.
Monthly sales counts in 2025 tracked closely with 2024 for most of the year, reflecting the same underlying stability across seasons. The following double bar chart compares total detached single-family sales by month for the two years:
The two years remained remarkably neck-and-neck in monthly activity, with differences mostly modest in scale. 2024 showed noticeable strength in May, June, and November, while 2025 pulled ahead in January, October, and December. This pattern aligns with gradual mortgage rate easing throughout 2025, which likely encouraged some buyers to act earlier in the year or wait for improved affordability late in the year. The standout October performance in 2025 (1,686 sales, the year’s high point) echoed a strong fall trend seen in 2024, likely influenced by families finalizing moves after the school year start, pre-holiday motivation, and Portland’s relatively mild October weather facilitating showings and closings.
Overall, the close month-to-month alignment reinforces that 2025 was not a year of dramatic seasonal shifts or momentum changes—just incremental variations that netted the modest +1.25% increase in annual sales.
Sales Price
Monthly average sales prices in 2025 remained remarkably stable throughout the year, closely mirroring 2024’s patterns with only modest seasonal fluctuations and no significant directional trend. The following bar chart shows average close prices by month for 2025:
Note: The y-axis starts at $600,000 to allow better examination of monthly differences.
The chart reveals a narrow range of monthly averages—from approximately $657,000 in November and December to $703,265 in June—a spread of about 7% from low to high. Prices peaked in late spring and early summer (April–August mostly $690k–$703k), then gradually softened through fall and winter. This seasonal arc is typical of the region, with stronger activity and higher-value closings during peak buyer season, followed by a quieter late-year period. The overall flatness across months reinforces the year’s broader price equilibrium.
The following line graph below compares monthly average sales prices for 2024 (blue) and 2025 (red), with a full y-axis scale starting near zero to show true proportional differences:
When viewed on this full scale, the two years appear nearly identical across most months, with only minor divergences — primarily a stronger start in January and February 2025. This visual compression underscores the high degree of price stability year-over-year. Zooming in we have:
Note: The y-axis starts at $580,000 to allow better examination of monthly differences.
The above graph reveals the modest seasonal movements more clearly.
New Construction
New construction activity in 2025 declined noticeably from 2024 levels, with 1,858 new homes closing compared to 2,108 the prior year (-11.86%). As a share of total sales, new construction averaged 10.88% for the year, reflecting a reduced contribution from fresh inventory to overall market volume. The following double bar chart shows monthly total sales (primary bars) versus new construction closings (nested/secondary bars) in 2025:
New construction share was highest early in the year (February 15.35%, January 13.05%, March 13.03%), then trended lower through spring and summer (June–August ~9–10%), reached a low in September (8.41%), and rebounded modestly in November and December (~11–12%). This pattern reflects typical builder closing cycles—more completions in Q1/Q2 — while total sales peaked later in the spring/summer buyer season, resulting in lower relative share during high-volume months. The annual decline contributed to older average inventory and reinforced resale dominance across the region.
While new construction declined regionally, the geographic distribution of new closings remained concentrated in the larger suburban counties. The following side-by-side double bar chart compares new construction sales volume by county in 2024 versus 2025:
Washington County continued to dominate new construction activity, accounting for 52.53% of regional new closings in 2025 (976 sales, down -8.87% from 2024). Clackamas followed at 26.16% (486 sales, -4.14%), and Multnomah contributed 14.10% (262 sales, -15.76%). Yamhill saw the sharpest relative drop (-42.86% to 120 sales, 6.46% share), while Columbia remained flat at 9 sales (0.48%) and Hood River posted a small gain (5 sales from 0, 0.27% share). The concentration in Washington and Clackamas—together nearly 79% of 2025 new closings—reflects their suburban growth areas and remaining builder pipelines, while smaller counties saw more volatility due to limited scale.
The table below shows new construction sales volume by dollar amount for 2025 compared with 2024.
The following double bar chart provides the above information at a glance:
Washington County dominated new construction dollar volume in 2025 ($719.9 million, 52.96% of regional total), followed by Clackamas ($423.8 million, 31.18%). Together these two counties accounted for over 84% of regional new-home value, reflecting their suburban growth areas and remaining builder pipelines. The regional decline in new construction dollar volume (~12.17% to $1.36 billion) slightly outpaced the count drop, indicating modest softening in average new-home pricing alongside reduced volume.
Clackamas County’s strong showing in new construction value was supported by vested projects in growth areas like Sandy. However, the ongoing sewer moratorium in Sandy (extended to June 2026) may limit future pipeline, potentially reducing Clackamas’s regional share in 2026–2027 as approved projects are completed. For full details on the moratorium’s history, impacts, and timeline, see my recent analysis.
Despite the measurable pullback in new construction closings and dollar volume, the segment remained a significant economic force in the Portland Region. Nearly $1.4 billion in new home value changed hands in 2025—a substantial contribution to local jobs, supply-chain activity, tax base support, and overall economic circulation. This underscores the ongoing importance of home building even in a year of reduced activity and resale dominance.
Cumulative Days on Market
Average cumulative days on market (CDOM) rose +11.09% year-over-year to 59.15 days in 2025, reflecting increased buyer selectivity in a market where mortgage rates, while easing modestly, remained elevated relative to historical norms. The following bar chart shows average CDOM by calendar month for 2025:
The chart reveals the classic “V” pattern typical of the region: longest marketing times in winter months (January & December), a sharp drop through spring (March through May), a trough in late spring/early summer (June & July), then a gradual rise through fall/early winter (September through December). This seasonality aligns with expected patterns—stronger buyer activity and faster turnover during peak season, slower movement in winter due to holidays, weather, and reduced showings.
The bar chart below compares cumulative days on market for 2024 and 2025:
2025 CDOM was higher in nearly every month, with the increase most pronounced in winter (January +26 days, December +18 days) but evident across the board. The “V” shape persisted in both years, yet the overall elevation in 2025 underscores structural factors—persistent affordability hurdles and buyer caution—rather than seasonal-only shifts. Sellers contributed by holding firm to initial list prices, conceding only modestly more ground (SP/OLP ratio 97.24%, down -0.69%), which extended exposure periods without triggering widespread reductions.
The Core vs Luxury CDOM comparison further illustrates segment-specific dynamics within the year’s broader selectivity trend. The following bar chart shows average cumulative days on market by calendar month for 2025, segmented by core (< $1M) and luxury (≥ $1M):
Luxury CDOM remained consistently higher than core throughout the year, reflecting the longer marketing times typical of higher-price properties that attract fewer, more selective buyers. Annual averages were 83.47 days for luxury (-0.63% from 2024) versus 56.50 days for core (+13.02% from 2024), highlighting greater resilience in the luxury segment. The “V” seasonality persisted in both, with winter highs and summer lows, but luxury showed a flatter profile overall—less pronounced seasonal swings—while core experienced more noticeable lengthening during peak periods.
This divergence aligns with buyer behavior: core buyers, more rate-sensitive and facing affordability constraints, exercised greater caution and took longer to decide, contributing to the segment’s sharper CDOM rise. Luxury buyers—often with more equity or cash positions—remained decisive when the right property appeared, resulting in relatively stable marketing times despite a slower sales pace. The contrast reinforces that selectivity pressures in 2025 were more acute in the core market, while luxury benefited from targeted demand in premium submarkets.
Housing Supply
Months of supply (MOS)—the number of months it would take to absorb current active inventory at the prevailing sales pace, assuming no new listings enter the market—remained low throughout 2025, averaging approximately 2.9 months. This continued tightness supported price resilience and modest gains despite increased buyer selectivity and longer marketing times. The following bar chart shows MOS by calendar month for 2025:
The chart illustrates clear seasonality: MOS peaked in January (3.36 months) as sales slowed and some listings lingered or re-entered the market post-holidays, dipped through spring (March 2.67, April 2.71), rose modestly during summer (June 3.08, July 3.22, August 3.15), and reached its lowest point in December (2.25 months). The December low reflects widespread year-end listing cancellations and withdrawals—a common pattern as sellers pause for holidays, tax considerations, or motivation loss—while January’s high results from many of those listings re-entering the market alongside new ones.
This seasonal wave aligns with expected regional patterns: stronger sales pace relative to inventory in peak buyer months (spring/summer) pulls MOS lower, while slower winter activity allows inventory to build relative to closings. The annual average of ~2.9 months stayed well below the traditional 4–6 month benchmark for a balanced market, maintaining a seller-leaning environment that helped anchor price stability even as CDOM lengthened.
The line graph below compares monthly months of supply for 2024 (blue line) and 2025 (red line), with a full y-axis scale to show true proportional differences:
Both years exhibited similar seasonal waves: higher MOS in winter (January peaks around 3.4–3.5 months), a dip through spring as sales pace accelerated, a modest rise in summer, and lows in late fall/early winter (December ~2.2–2.3 months in both years). The lines converged closely at the start (January) and end (December) of the year, with the most noticeable divergence occurring in spring and summer months, where 2024 showed lower (more constrained) MOS—often 0.5–0.8 months below 2025 levels—indicating relatively stronger absorption relative to inventory during peak buying season in 2024.
Overall, 2025 averaged modestly higher supply (2.92 months) compared to 2024 (2.66 months), remaining well below the traditional 4–6 month benchmark for a balanced market. This slight increase contributed to incremental affordability relief and helped support the year’s modest transaction volume growth, while the persistent tightness anchored price stability and limited broader volatility.
Miscellaneous Statistics & Standout Transactions
The 2025 Portland Region detached single-family market produced a range of notable extremes and interesting figures that highlight the diversity and breadth of activity across price points, sizes, features, and marketing times. The following standouts capture some of the year’s most remarkable data points.
Lowest close price: $90,000—a 1930s fixer cabin in Forest Grove (Washington County). The property offered original character but required extensive rehabilitation, including interior plumbing repairs and floor work. Photos of this property are currently available online.
Highest close price: $9.45 million—a lakefront estate in Lake Oswego (Clackamas County). The property featured approximately 280 feet of private Oswego Lake shoreline, panoramic views, a primary suite addition, pool, extensive entertaining spaces, six-car garage (pre-wired for expansion), and a boathouse. This transaction reflects sustained demand for premium waterfront properties in Clackamas County, consistent with the area’s historical strength at the upper end of the market. Photos of this property are currently available online.
Lowest PPSF: $49.84—an REO (bank-owned) fixer-upper in Clatskanie, OR 97016 (Columbia County). This 2-story home with basement offered good natural light and scenic surroundings but required significant vision and effort to restore to its potential. As one of the region’s most affordable major counties, Columbia continues to produce entry-level opportunities for buyers willing to undertake rehabilitation work. Photos of this property are currently available online.
Highest PPSF: $1,646.65 per square foot—a lakefront property on Oswego Lake in Clackamas County that is near the highest sale. The home sold for $8,500,000 and measured 5,162 square feet, featuring 4 bedrooms, 6 full bathrooms, 1 half bathroom, and a 0.26-acre lot. This transaction reflects strong demand for premium waterfront locations in the region, where location and views can drive exceptional value per square foot. Photos of this property are currently available online.
Longest CDOM: 1,923 days—a working vineyard estate in Yamhill County. The property first listed in March 2019 for $1.3 million, saw no price adjustment until March 2023, went pending in July 2024, and closed in August 2025 for $1.195 million. The extended marketing time reflects the challenges of selling a specialized vineyard property on a small-volume market, though the final discount was moderated by appreciation since the initial listing. This extreme duration highlights how niche or rural properties can face prolonged exposure in a selective environment. Photos of this property are currently available online.
Oldest home sold in 2025: Built in 1858—the former residence of Capt. George Jerome in Oregon City, OR (Clackamas County, Canemah historic neighborhood). This 3-bedroom home (main level living plus 3 upstairs bedrooms) sits adjacent to Willamette Falls, with a detached garage offering bonus room potential for hobbies or an ADU. The property represents a piece of Oregon’s early history, located in a neighborhood poised for future development tied to the falls area. Photos of this property are currently available online.
Largest lot sold in 2025: 90.9 acres—a property in North Plains, Oregon (Washington County). The 4,335-square-foot home sits on a mostly sloped and heavily forested lot, offering significant land area with limited immediate buildable potential. This sale reflects the region’s occasional demand for large rural or acreage parcels, often appealing to buyers seeking privacy, recreation, or long-term investment. Photos of this property are currently available online.
Largest home sold in 2025: 13,379 square feet—a sprawling estate in West Linn, Oregon (Clackamas County). The property sat on 20.18 acres adjacent to the Oregon Golf Club and included a shop building larger than the main residence itself. It sold for $6,500,000 after 299 days on market. This sale highlights demand for expansive, large-lot properties in the region’s suburban and semi-rural areas, where size and outbuildings add significant utility. An exterior photo of the property may be viewed here.
Smallest home sold in 2025: 426 square feet—a cabin in Scappoose, Oregon (Columbia County) on 1.4 acres. This compact property offered a minimal footprint with potential for buyers seeking an affordable entry into detached ownership or a rural retreat. Photos of the cozy home are currently available online and may be viewed here.
Most bedrooms: 11—a former adult foster care home in Tigard, OR (Washington County). The 7-bathroom property included a large kitchen, laundry area, living and family rooms, formal and informal dining, a back living/dining area with wet bar and desk setup, recent updates (new roof, AC/furnace, water heater, LVP flooring, electrical panel, interior/exterior paint), furniture negotiable, detached garage for storage, private deck, and an adjacent city-owned lot for extra parking. It sold to another adult care company, reflecting continued demand for larger, adaptable homes suitable for group living or care facilities in the region. Photos of this property are currently available online.
Most bathrooms: 10—a 9,500-square-foot residence in Dundee, Oregon (Yamhill County), currently operating as the Franziska Haus bed and breakfast. The property included 10 bedrooms and was designed for guest accommodations, making it convenient for wine-tasting visitors in the area. It likely could be converted to a private residence with minimal interior changes. Photos of the home are currently available online and may be viewed here.
Multnomah County 2025 Stats
Multnomah County remained the Portland Region’s core and highest-volume market in 2025, accounting for 37.81% of all detached single-family sales with 6,459 transactions. The following table compares key metrics for the county in 2025 with 2024:
The table below summarizes key metrics for Multnomah County detached single-family residential sales in Q1 2026 compared with Q1 2025.
Multnomah showed modest growth in transaction volume (+4.08% to 6,459 sales) and dollar volume (+6.10% to $4.1 billion), outpacing the regional increase in both metrics. Median and average close prices rose +1.85% to $550,000 and +1.94% to $635,278 respectively, while average PPSF gained +1.08% to $316.80. The PPSF gains occurred despite a modest home size increase (+1.08% to 2,108 SF), suggesting underlying value support through compositional factors (larger average lot size) and location premiums in the county’s urban/suburban mix. Average cumulative days on market lengthened +4.87% to 49.14 days—a milder increase than the regional +11.09%—indicating relatively stronger demand and quicker turnover compared to surrounding counties. New construction fell -15.76% to 262 closings, contributing to an older average age (+4.68% to 68.84 years) and further emphasizing resale dominance.
The scatter plots below visualize individual sale prices against date of sale in Multnomah County for 2025. The first shows the full range, while the second focuses on the $0–$2M range:
The full-range plot includes occasional high-end outliers up to nearly $6M, while the zoomed view reveals a dense “wall” of transactions below approximately $1M, accounting for roughly 91% of the county’s sales count. Density thins noticeably above that level, underscoring Multnomah’s role as the primary driver of core and mid-range volume while luxury sales remained comparatively sparse and scattered throughout the year. This distribution aligns with the county’s urban/suburban character and older inventory base.
Washington County 2025 Stats
Washington County, the region’s second-largest market by volume, represented 29.54% of all detached single-family sales in 2025 with 5,046 transactions. The following table compares key metrics for the county in 2025 with 2024:
Washington posted a near-flat sales count (-0.77% to 5,046) but saw dollar volume soften -2.38% to $3.45 billion, reflecting modest price erosion and compositional shifts. Median price declined -1.31% to $626,699, average price -1.62% to $684,155, and average PPSF -2.17% to $317.20. These declines occurred despite a slight increase in average home size (+1.09% to 2,245 SF) and were driven primarily by smaller average lot sizes (-10.34% to 0.42 acres) and reduced new construction (-8.87% to 976 closings), which limited higher-priced fresh inventory. Average cumulative days on market surged +20.03% to 61.89 days—the sharpest increase among major counties—signaling greater buyer selectivity and slower absorption in this suburban-heavy market. SP/OLP ratio fell -1.34% to 97.02%, indicating increased concessions.
The scatter plots below visualize individual sale prices against date of sale in Washington County for 2025. The first shows the full range, while the second focuses on the $0–$2M range:
The full-range plot includes occasional high-end outliers up to $4M, while the zoomed view reveals a dense “wall” of transactions below approximately $1M, thinning noticeably above that level. This pattern underscores Washington’s core market strength in volume while highlighting softer momentum in the luxury segment, consistent with localized pressures in tech-heavy submarkets like Hillsboro. For a detailed look at how Intel layoffs have impacted inventory, pricing, and absorption in Hillsboro during 2024–2025, see my recent analysis.
Clackamas County 2025 Stats
Clackamas County, the region’s third-largest market by volume, represented 23.33% of all detached single-family sales in 2025 with 3,986 transactions. The following table compares key metrics for the county in 2025 with 2024:
Clackamas delivered modest but genuine growth in 2025. Sales count rose +1.22% to 3,986, dollar volume increased +2.72% to $3.16 billion, median price advanced +1.35% to $658,750, average price gained +1.49% to $793,962, and average PPSF edged +1.00% to $336.43. These gains occurred despite a reduction in average lot size (-9.29% to 0.94 acres) and only modest home size increase (+0.55% to 2,394 SF), suggesting underlying value support through location, quality, or compositional factors rather than broad size-driven appreciation. Average cumulative days on market lengthened only +3.04% to 64.41 days—a relatively mild increase compared to regional +11.09% or Washington +20.03%—indicating stronger relative demand and quicker turnover in this diverse county. New construction declined modestly -4.14% to 486 closings, the smallest drop among major counties.
Clackamas’s performance was bolstered by its mix of rural/exurban areas and premium enclaves, particularly Lake Oswego and West Linn, which contribute to the county’s outsized share of regional luxury activity. In 2025, Clackamas accounted for approximately 42.1% of the Portland Region’s luxury dollar volume (≥ $1M), totaling $1.04 billion out of the regional $2.47 billion—the largest share among counties. This contrasts with the core market (< $1M), which comprised only ~67% of Clackamas’s own dollar volume, the smallest core dollar volume share among major counties with significant activity.
The scatter plots below visualize individual sale prices against date of sale in Clackamas County for 2025. The first shows the full range, while the second focuses on the $0–$2M range:
The full-range plot includes occasional high-end outliers up to nearly $10M, while the zoomed view reveals a dense “wall” of transactions below approximately $1.3M–$1.5M throughout the year, with density thinning noticeably above that level. This pattern highlights Clackamas’s strong core volume alongside its leading role in regional luxury value, driven by premium lakefront and waterfront properties.
Yamhill County 2025 Stats
Yamhill County, a smaller but growing market in the region (5.64% of total sales), saw 964 detached single-family sales in 2025. The following table compares key metrics for the county in 2025 with 2024:
Yamhill experienced a sharp decline in transaction volume (-7.57% to 964 sales) and dollar volume (-4.88% to $574 million), driven primarily by a steep drop in new construction (-42.86% to 120 closings). This reduction in fresh supply limited higher-priced inventory and contributed to the overall pullback. Despite these headwinds, price metrics showed resilience: median price rose +3.00% to $515,000, average price +2.92% to $595,444, and average PPSF +3.30% to $312.04. These gains occurred amid only modest home size increase (+1.21% to 1,972 SF) and were largely supported by a significant rise in average lot size (+14.23% to 1.90 acres), suggesting buyers prioritized additional land or rural parcels that added value. Average cumulative days on market lengthened +13.19% to 76.14 days, reflecting increased selectivity, while SP/OLP ratio fell -0.59% to 96.49%, indicating modestly greater concessions.
The scatter plot below visualizes individual sale prices against date of sale in Yamhill County for 2025:
The scatter shows a dense concentration of transactions below approximately $1M throughout the year, with sparser, more scattered points above that level. This pattern reflects Yamhill’s more rural and affordable character, where core and mid-range volume dominates while luxury sales remain limited. The absence of strong seasonal clustering in the price cloud supports the county’s price resilience despite the volume decline, bolstered by larger lot sizes and selective demand for wine-country or rural properties.
Columbia County 2025 Stats
Columbia County, the region’s smallest major market by volume, represented 2.85% of all detached single-family sales in 2025 with 487 transactions. The following table compares key metrics for the county in 2025 with 2024:
Columbia County delivered solid performance in 2025, with sales count rising +4.51% to 487 and dollar volume advancing +8.00% to $244 million — growth that outpaced the increase in transactions. Median price gained +4.18% to $477,125, average price +3.35% to $501,012, and average PPSF +3.39% to $281.23. These improvements occurred alongside larger average home size (+2.51% to 1,933 SF) and a substantial increase in average lot size (+16.33% to 2.25 acres), indicating compositional factors — more spacious properties and land parcels — supported genuine value appreciation. Average cumulative days on market lengthened +14.84% to 81.81 days, reflecting increased selectivity consistent with regional trends. New construction remained flat at 9 closings, and SP/OLP ratio improved slightly +0.16% to 96.08%.
The scatter plot below visualizes individual sale prices against date of sale in Columbia County for 2025:
The scatter shows an extremely dense concentration of transactions below approximately $600,000 throughout the year, with thin activity above that level; $1M+ sales are rare outliers. This tight clustering reinforces Columbia’s position as the most affordable county in the region, where the core market (< $1M) overwhelmingly dominated (98.56% of sales count, 96.57% of dollar volume) and luxury activity remained negligible (only 7 sales, ~3.43% of county dollar volume).
Hood River County 2025 Stats
Hood River County, the region’s smallest market by volume, represented 0.83% of all detached single-family sales in 2025 with 141 transactions. Due to its low base numbers, the county is prone to large percentage swings. The following table compares key metrics for the county in 2025 with 2024:
Hood River posted solid growth on a small base: sales count rose +5.22% to 141, and dollar volume advanced +15.27% to $121.9 million. Median price gained +2.01% to $735,000, average price increased +9.55% to $864,341, and average PPSF softened -1.62% to $417.15. These results were driven by compositional factors—larger average home size (+7.30% to 2,136 SF) and a substantial increase in average lot size (+98.78% to 2.47 acres)—which added value and supported the dollar volume jump despite only modest sales growth. Average cumulative days on market lengthened significantly +44.29% to 76.21 days, amplified by the small base and reflecting increased selectivity. New construction emerged modestly (5 closings from 0), while SP/OLP ratio fell -2.17% to 94.00%, indicating greater discounts.
The scatter plot below visualizes individual sale prices against date of sale in Hood River County for 2025:
The scatter shows a relatively tight mid-range cluster ($500k–$1.5M) for much of the year, with several high-end outliers ($2M–$3.5M+) appearing more frequently in the latter months. The fitted trendline reflects an upward shift in the second half of 2025, driven by these late-year luxury sales. This pattern aligns with the segment’s strong performance (luxury sales count +60% to 32, dollar volume +68.15% to $47.3M) on a small base, contributing significantly to the county’s overall growth. Hood River’s scenic Gorge location, wine-country appeal, and tourism/second-home demand help explain the selective strength at the upper end despite limited overall volume.
Closing Thoughts
The 2025 Portland Region detached single-family home market delivered a year of continued equilibrium—modest gains in volume and prices persisted within a balanced, non-volatile environment. While cumulative days on market lengthened and new construction retreated, the overall picture remained one of stability three years after the rapid mortgage rate rise. Supply stayed tight, buyer selectivity increased modestly, and prices held firm with slight upward movement, reflecting a market that has settled into a sustainable new normal.
This stability played out against a backdrop of remarkable diversity across the six-county region. From urban core neighborhoods in Multnomah to suburban growth corridors in Washington and Clackamas, rural and wine-country areas in Yamhill, affordable exurban pockets in Columbia, and scenic Gorge communities in Hood River, the market offered a wide spectrum of options. Affordability remained a challenge for many, yet detached ownership was still attainable at the lower end—the year’s lowest sale closed at $90,000. Homes were found for those willing to be patient, search diligently, and consider rehabilitation or rural locations. Meanwhile, the 17,083 transactions represented substantial movement: long-time owners parting with properties held for decades, families relocating for schools, jobs, or lifestyle, and first-time buyers achieving detached homeownership. Each closing reflected real human transitions and progress in a selective but functional market.
Sources & Further Reading
All data presented in this annual review is sourced directly from RMLS and has been subjected to my rigorous cleaning and validation process to ensure reliability for detached single-family residential analysis in the six-county Portland Region. The trends, comparisons, and commentary are the result of original appraisal expertise and independent analysis—not aggregated from secondary sources or news summaries.
Sandy Oregon’s Sewer Moratorium — The End of a 27-Year New Construction Boom: Portland Appraisal Blog
External Obsolescence in Hillsboro — Residential Market Response to Intel’s 2024–2025 Workforce Reductions: Portland Appraisal Blog
Coda
Thanks for reading—I hope you found a useful insight or an unexpected nugget along the way. If you enjoyed the post, please consider subscribing for future updates.
Are you an agent in Portland who wonders why appraisers always do “x”?
A homeowner with questions about appraiser methodology?
If so, feel free to reach out—I enjoy connecting with market participants across Portland and the surrounding counties, and am always happy to help where I can.
And if you’re in need of appraisal services in Portland or anywhere in the Portland Region, we’d be glad to assist.
About the Author — Abdur Abdul‑Malik, SRA, ASA
Abdur Abdul‑Malik is the founder, author, and publisher of the Portland Appraisal Blog, where he produces original regional and neighborhood‑level housing analytics for the Portland Region. He is a certified residential appraiser serving Oregon and Washington, drawing on RMLS transaction data, public records, and custom segmentation models he has built.
He developed the Portland Appraisal Blog Affordability Index (PABAI), a payment‑based affordability metric built from actual RMLS sales. PABAI incorporates weekly updates based on the prevailing 30‑year fixed mortgage rate, providing a locally grounded measure of housing affordability across the region.